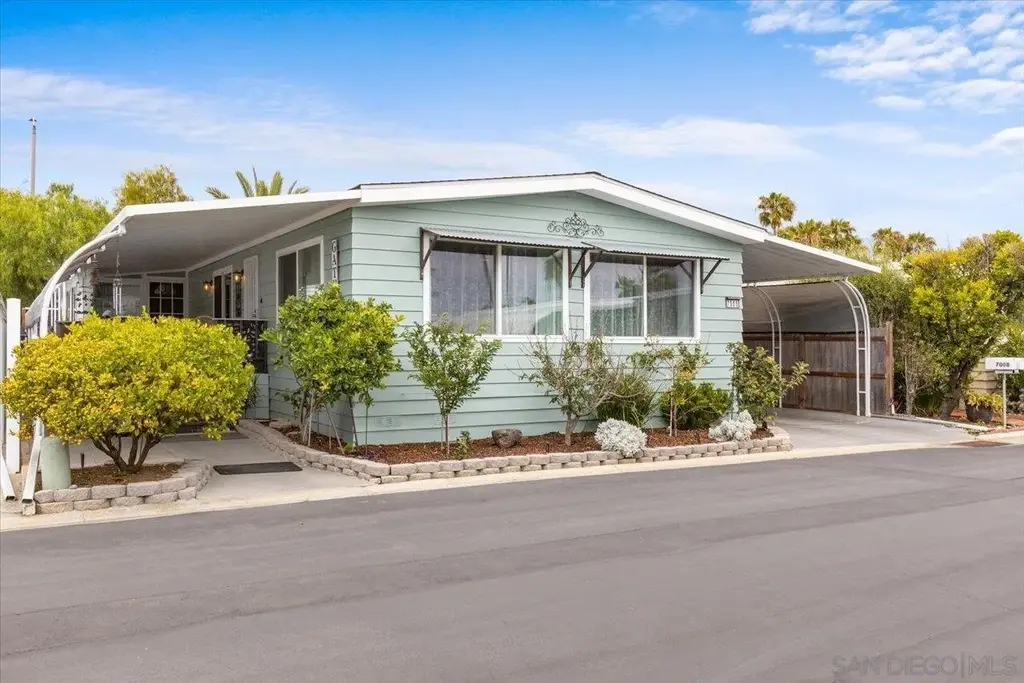
7008 San Bartolo St #27 · Carlsbad, CA
Flood risk 1/10 · Minimal
- FEMA flood zone
- X (unshaded)
- Chance of flooding over 30 yrs
- 0.0%
- Est. flood insurance / yr
- $507 – $1,088
Fire risk 1/10 · Minimal
- Est. fire insurance / yr
- $659 – $1,223
Heat risk 5/10 · Moderate
- Hot days now (above 82°F)
- 7 days/yr
- Hot days in 30 yrs
- 19 days/yr
Wind risk 1/10 · Minimal
- Chance of severe wind over 30 yrs
- —
Air-quality risk 3/10 · Minor
- Unhealthy air days now
- 4 days/yr
- Unhealthy air days in 30 yrs
- 4 days/yr
Risk factors via First Street. Map © Google.
Why this score? — see what drove the A grade
The composite is a weighted blend of 9 inputs, each scored 0–100. Each bar is that input's sub-score; the figure is the points it added to the 100-point composite (weight × sub-score).
- Cash flow +30.0/30.0
- ARV discount +15.0/15.0
- 1% rule +10.0/10.0
- DSCR +10.0/10.0
- Schools +6.5/10.0
- Appreciation +5.9/10.0
- Livability +3.9/5.0
- Rent growth +3.4/5.0
- Condition / age +2.5/5.0
$245,000
🖨 Deal sheet 📄 Offer letter ✓ Due diligence
Listing remarks MLS
Cute as can be. Quiet location in the park. With nice sun room and back patio. Priced to sell-seller moving out of state. Walk to shopping, Carlsbad beach and bus lines. Park has alot to offer for fun and pleasure. .. .
Key facts
- Exterior paint
- All new windows
- Luxury vinyl plank
Tags
Property features AI
Finance
- Other: Property is in the Lakeshore Gardens community (Carlsbad West subdivision)
- HOA & community: Community pool; Clubhouse; Fitness center; Billiard room; Meeting room; Barbecue facilities; RV parking; Recreation facilities; Spa/Hot tub; Senior community
Exterior
- Parking: 2 parking spaces
- Security: Gated community
- Utilities: Public water; Sewer connected; Electricity available and connected; Natural gas available and connected; Water connected; Sprinklers (irrigation)
- Home design: Manufactured home (updated/remodeled); Single-story
- Construction: Metal siding; Asphalt shingle roof
- Exterior features: Barbecue; Deck; Awning(s); Covered porch; Full fencing; Shed(s)
Interior
- Kitchen: Dishwasher; Disposal; Microwave; Refrigerator; Freezer; Gas oven; Gas range / gas cooktop; Range hood; Warming drawer; Ice maker; Vented exhaust fan; Gas water heater
- Bedrooms: Up to 2 possible bedrooms
- Flooring: Carpet
- Bathrooms: 2 full bathrooms
- Heating & cooling: Forced air heating (natural gas)
- Interior features: Sauna; Ceiling fans; Smoke detector(s); Low-flow water fixtures
- Laundry & utility: Washer; Dryer; Common area laundry
Neighborhood map
What this means for you Summary
Snapshot
- This is a 2-bed/2.0-bath manufactured listed at $245k.
Deal economics
- At list price, monthly cash flow is $3k ($37k/yr) — positive.
- The deal already cash-flows at list — no discount required.
- Meets the 1% rule at list price ($6k rent vs $245k).
- Recommended offer: $238k (3.0% below list) — sets the bar for market timing.
- Cap rate 21.6% vs local median 2.1% in Carlsbad — top-decile yield for the area; either an underpriced asset or a hidden risk that comps aren't pricing in. Stress-test before assuming the spread holds.
Location & tenants
- Location reads 78/100 on livability (#67 in CA, #2,526 nationally) — a middle-class / working-renter tenant base. Strengths: schools A+, amenities A+, commute A+; Watch: health & safety D+, cost of living F.
- Carlsbad Unified (urban): math 68% / reading 76% proficiency, ranked #87 of 1,400 in CA (top 6%) — strong family-tenant draw, lease renewals of 3-5y typical; only 18% free/reduced lunch — higher-income household profile.
- Market conditions: Rents rising (+3.5%/yr); 96 active listings in the ZIP; 12 comparable units currently listed for rent nearby; rentals at typical pace (median 18d on market — plan ~3-4 weeks tenant-placement turnaround); 42% of comp listings sitting > 30 days — soft ceiling on asking rent; high-income renter base; 11,759 units permitted in San Diego County in 2024 (7,244 in 5+ unit buildings).
- At $6,088/mo this rent would consume 46% of the median local household income ($159k/yr) (locally 714% of renters already pay >50% of income on rent) — very limited rent-growth headroom before tenants either downsize or default.
Forward outlook
- In year one you build about $6k of equity ($2k loan paydown + $4k appreciation (1.8% local appreciation)).
- San Diego County population projected at +20% by 2050 — long-run rental-demand tailwind backs the buy-and-hold thesis.
- At projected returns (1.8% appreciation + 3.5% rent growth), your $69k cash investment doubles in ~2 years — after that, you're playing with house money.
- By year 6, paydown + projected appreciation supports a ~$32k cash-out refi (75% LTV) — recoverable capital for the next deal without selling this one.
Negotiation context
- It's been on market 35 days — a 3% lower offer ($238k) is reasonable based on typical stale-listing flexibility.
- 2 sale attempts since 14y ago with the ask held roughly flat each time — persistent listings suggest the price (not the market) is what's stuck; bring a comps-based counter.
- Current owner paid $53k; list at $245k implies a 362% gain — meaningful room to come down on a strong offer.
Risks & watch-outs
- Climate carrying-cost: extreme-heat days projected 7→19/yr by 2055 (HVAC capex compounding) — expect insurance premiums to compound above CPI over the hold.
Questions for the listing agent
- It's been on market 35 days. Have you received any prior offers? Is the seller open to a 3% concession, seller financing, or rate buy-down credit?
- Built in 1973 — when were the roof, HVAC, electrical panel, plumbing, and water heater last replaced?
- Is there a deadline driving the sale (1031 exchange, divorce, estate, relocation)? That informs how much negotiation room exists.
- Schools are A-rated — typically a magnet for longer-tenancy family renters. What's the average tenant stay here, and is there a school-zone premium baked into asking?
- What's the average days-on-market for RENTAL listings here right now (not sales)? A rising rental-DOM trend means longer vacancies and softer asking-rent achievability than the comps imply.
- What's the recent tenant-quality profile in this submarket — average credit score on applications, eviction rate, late-payment / NSF rate, and stable-employment percentage? A property-management company in the area should have these aggregated.
- How much new for-sale + rental construction is in the pipeline within 1–3 miles? Heavy new supply typically softens prices + rents 12–24 months out; constrained supply supports both.
Investment metrics
- 1% rule
- 2.48% ✓
- Cap rate
- 21.56%
- Cash-on-cash
- 54.51%
- DSCR
- 3.43
- GRM
- 3.4
CMA / ARV
- ARV (median comp)
- $380,537
- List price
- $245,000
- Delta
- -35.62%
- Verdict
- UNDERPRICED
- Comps
- 20 within 1.0 mi
Show comp detail 12 sales within ~0.75 mi
| Address | Dist | Beds/Ba | Sqft | Sold | Price | $/sf | Match |
|---|---|---|---|---|---|---|---|
| 7024 San Bartolo Unit 19 A | 0.00mi | 3/2.0 (+1) | 1,544 (-1%) | 2mo | $425,000 | $275 | 91 |
| 7203 San Luis St #166 | 0.06mi | 2/2.5 | 1,536 (-2%) | 9mo | $375,000 | $244 | 85 |
| 7224 San Benito St | 0.13mi | 2/2.0 | 1,600 (+3%) | 9mo | $400,000 | $250 | 82 |
| 7207 Santa Barbara St #154 | 0.00mi | 3/2.0 (+1) | 1,656 (+6%) | 3mo | $513,300 | $310 | 82 |
| 7106 Santa Cruz #56 | 0.05mi | 2/2.0 | 1,464 (-6%) | 9mo | $390,000 | $266 | 80 |
| 7140 Santa Rosa St | 0.04mi | 2/2.0 | 1,440 (-8%) | 6mo | $191,000 | $133 | 80 |
| 7018 San Carlos St #60 | 0.10mi | 2/2.0 | 1,440 (-8%) | 6mo | $392,000 | $272 | 78 |
| 7304 Santa Barbara St #325 | 0.23mi | 2/2.0 | 1,512 (-3%) | 9mo | $481,000 | $318 | 77 |
| 7313 San Luis St #236 | 0.32mi | 3/2.0 (+1) | 1,548 (-1%) | 5mo | $450,000 | $291 | 75 |
| 7002 San Bartolo St #30 | 0.15mi | 3/2.0 (+1) | 1,781 (+14%) | 2mo | $341,500 | $192 | 63 |
| 7318 San Luis St | 0.37mi | 2/2.0 | 1,440 (-8%) | 9mo | $285,000 | $198 | 62 |
| 7311 San Luis St #237 | 0.35mi | 3/2.0 (+1) | 1,359 (-13%) | 1mo | $236,550 | $174 | 56 |
Match score weights: distance 35% · size 25% · config 20% · recency 20%. Top-matched comps best support the ARV.
Projected returns pro-forma
1.75% appreciation · 3.54% rent growth · sell at horizon
- IRR
- 58.7%
- Equity multiple
- 4.14×
- Total profit
- $215,586
- Equity at exit
- $93,321
- IRR
- 59.6%
- Equity multiple
- 8.51×
- Total profit
- $515,053
- Equity at exit
- $131,882
Cash invested: $68,600 (down + closing). Projections, not guarantees.
Landlord ↔ Tenant lean methodology
- Overall (STATE)
- 18 Strongly Tenant-Friendly
- State California
- 18 Strongly Tenant-Friendly · D+13
- County
- — inherits STATE
- City
- — inherits STATE
ZIP-level market 92011
- Home prices YoY
- 0.4%
- Rents YoY
- 3.5%
- Active inventory
- 96
- Price-to-rent
- 3.4×
Monthly cashflow live
- Estimated rent
- $6,088 high interval (Pro) →
- Mortgage (P&I)
- −$1,285
- Tax est. 1.5%
- −$306 /mo · $3,675/yr
- Insurance
- −$102
- HOA
- −$0
- Vacancy / Maint / Mgmt
- −$1,278
- Net cashflow
- $3,116
Break-even live
UW: 25.0% down · 7.5% · 30yr · 1.5% tax · 5.0% vac · 8.0% maint · 8.0% mgmt
Financing live
Cash to close
- Down payment
- $61,250
- Closing costs
- $7,350
- Reserves months
- —
- Total cash needed
- —
Loan-product check · same deal, 3 products live
Conventional
25% down · 7.5% · 30yr
- Down + closing
- —
- Monthly P&I
- —
- Monthly cashflow
- —
- DSCR
- —
- Eligible?
- —
Personal DTI + credit; lowest rate.
DSCR
20% down · 8.5% · 30yr
- Down + closing
- —
- Monthly P&I
- —
- Monthly cashflow
- —
- DSCR
- —
- Eligible?
- —
No personal income docs; deal must DSCR.
Hard money
10% down · 12.0% · 12mo
- Down + closing
- —
- Monthly P&I
- —
- Monthly cashflow
- —
- DSCR
- —
- Eligible?
- —
Short-term bridge; refi at stabilization.
Rent comps 12 comps
| Address | Beds | Baths | Sqft | Rent | $/sqft | DOM | Units | Dist |
|---|---|---|---|---|---|---|---|---|
| 7064 Whitewater St Carlsbad, CA | 3.0 | 2.5 | 2050 | $8,500 | $4.15 | 43d | 1 | 0.14mi |
| 6923 Whitecap Dr Carlsbad, CA | 3.0 | 2.0 | 1246 | $5,250 | $4.21 | 43d | 1 | 0.47mi |
| 820 Windcrest Dr Carlsbad, CA | 3.0 | 2.0 | 1404 | $5,581 | $3.98 | 18d | 1 | 0.65mi |
| 6790 Embarcadero Ln Carlsbad, CA | 1.0–2.0 | 2.0–2.5 | 2104 | $5,750 | $2.73 | 5d | 1 | 0.72mi |
| 6910 Peachtree Rd Unit 1546353P Carlsbad, CA | 3.0 | 2.0 | 1399 | $6,129 | $4.38 | 16d | 1 | 0.76mi |
| 6811 Alderwood Dr Carlsbad, CA | 2.0 | 2.0 | 1292 | $3,850 | $2.98 | 43d | 1 | 0.86mi |
| 916 Caminito Estrada Unit B Carlsbad, CA | 2.0 | 2.0 | 1188 | $3,650 | $3.07 | 43d | 1 | 0.98mi |
| 925 Wind Drift Dr Carlsbad, CA | 2.0 | 2.5 | 1110 | $3,895 | $3.51 | 43d | 1 | 1.15mi |
| 6555 Sea Gate Rd Carlsbad, CA | 2.0 | 2.0 | 1114 | $4,095 | $3.67 | 1d | 3 | 1.18mi |
| 1967 N Vulcan Ave Encinitas, CA | 1.0–2.0 | 1.0–2.0 | 929 | $5,359 | $5.77 | 1d | 7 | 1.27mi |
| 1812 Parliament Rd Encinitas, CA | 2.0 | 2.0 | 1467 | $11,200 | $7.63 | 1d | 1 | 1.43mi |
| 1859 N Vulcan Ave Encinitas, CA | 2.0 | 2.5 | 1950 | $7,000 | $3.59 | 1d | 1 | 1.43mi |
Listing history 18 events
-
2026-06-18days on market $245,000 Active 35 DOM
-
2026-06-17days on market $245,000 Active 34 DOM
-
2026-06-16days on market $245,000 Active 33 DOM
-
2026-06-15days on market $245,000 Active 32 DOM
-
2026-06-13days on market $245,000 Active 30 DOM
-
2026-06-13days on market $245,000 Active 29 DOM
-
2026-06-09days on market $245,000 Active 26 DOM
-
2026-06-08days on market $245,000 Active 25 DOM
-
2026-06-07days on market $245,000 Active 24 DOM
-
2026-06-04days on market $245,000 Active 21 DOM
-
2026-06-03days on market $245,000 Active 20 DOM
-
2026-06-02days on market $245,000 Active 19 DOM
-
2026-06-01days on market $245,000 Active 18 DOM
-
2026-05-31days on market $245,000 Active 17 DOM
-
2026-05-09$245,000 Active 700-char remark
-
2012-11-14soldstatus $53,000 219-char remark
Show marketing remark (219 chars)
Cute as can be. Quiet location in the park. With nice sun room and back patio. Priced to sell-seller moving out of state. Walk to shopping, Carlsbad beach and bus lines. Park has alot to offer for fun and pleasure. .. .
-
2012-10-29price $59,000
-
2012-09-24$59,000 219-char remark
Show marketing remark (219 chars)
Cute as can be. Quiet location in the park. With nice sun room and back patio. Priced to sell-seller moving out of state. Walk to shopping, Carlsbad beach and bus lines. Park has alot to offer for fun and pleasure. .. .
ⓘ Source: listings_history table (triggers on properties + properties_extension) + one-shot
backfill from property_details.listing_events for pre-trigger history.
Climate risk First Street
- Flood 1/10 Low FEMA zone X (unshaded) · 0% chance over 30 yrs
- Wildfire 1/10 Low
- Heat 5/10 Major 7 d/yr ≥82°F today · 19 d/yr by 30 yrs out
- Wind 1/10 Low
- Air quality 3/10 Moderate 4 unhealthy d/yr today · 4 by 30 yrs out
Nearby sold comps map
Loading sold comps map…
Walkable amenities ~0.75 mi
Loading nearby amenities…
Taxation est. · year 1
- Rental income
- $73,056
- − Mortgage interest
- −$13,724
- − Property taxes
- −$3,675
- − Insurance
- −$1,225
- − Repairs & maintenance
- −$5,845
- − Management
- −$5,845
- − Depreciation
- −$7,127
- Taxable income
- $35,616
- Est. tax owed @ 24.0%
- −$8,548
- After-tax cash flow
- $28,849/yr
For passive investors: Depreciation is non-cash, so a rental often shows a tax loss while cash-flowing — sheltering income. Rental losses are passive: they offset passive income freely, and up to $25,000/yr can offset ordinary (W-2) income if you actively participate and your MAGI is under $100k (phasing out to $0 by $150k); unused losses carry forward. On sale, claimed depreciation is recaptured at up to 25%, and gains may owe capital-gains tax (a 1031 exchange can defer both). Figures are a year-1 estimate at your 24.0% rate — not tax advice; consult a CPA.
Schools (NCES district)
- District
- Carlsbad Unified
- NCES district ID
- 0607500
- Math proficiency
- 68% ▲ 2.00%
- Reading proficiency
- 76% ▲ 2.00%
- Median HH income
- $81,200
- Composite
- 65.11/100
- National rank
- #1068
- State rank
- #87 of 1400 in CA
Livability — Carlsbad
- Score
- 78/100
- State rank
- #67
- US rank
- #2526
Category grades
Schools grade is shown separately in the Schools card above.
Census & demographics
- Census place
- Carlsbad, CA
- County
- San Diego County · 3,178,799 people
- City population
- 114,373
- Metro
- San Diego-Chula Vista-Carlsbad, CA
- Population (ZIP)
- 23,190
- Household income
- $159,235
- Rent vs Own
- Severe rent burden
- 714.0
Population outlook (San Diego County) Hauer SSP2
- Today (2025)
- 3,678,185 people
- By 2030
- 3,856,546 · +4.8%
- By 2040
- 4,171,407 · +13.4%
- By 2050
- 4,421,607 · +20.2%
- By 2075
- 4,831,599 · +31.4%
- By 2100
- 4,832,502 · +31.4%
Race, ethnicity, and origin ACS 2023
- Neighborhood character
- Majority White (64%)
- Race & ethnicity
- White 64% Hispanic / Latino 17% Two or more races 15% Asian 12%
- Hispanic origin (detail)
- Mexican 12%
- Common ancestry
- Portuguese 4% Slovak 3% Italian 3%
- Foreign-born
- 16% · Canada, China, Vietnam
- Languages at home
- 82% English-only · Spanish 6% Chinese 4% German/W. Germanic 2%
Political lean MEDSL · San Diego
- 2024 margin
- D (+16.8) · D 56.9% · R 40.1% · Other 2.9%
- 2008→2024 swing
- +6.6pp toward D · 2008: 10.2pp · 2024: 16.8pp
- All cycles
- 2024: D+16.8 2020: D+22.8 2016: D+17.8 2012: D+5.1 2008: D+10.2
Not yet ingested
- Civics
- —
Market trends
- HPI YoY
- ▲ 1.75%
- Current HPI
- 399.8502
- Rent YoY
- ▲ 3.54%
- Metro
- San Diego-Chula Vista-Carlsbad, CA
- State GDP YoY
- ▲ 3.21%
- F500 in state
- 116
Industry mix (Fortune 500 HQ in CA)
| Industry | F500 HQs | Revenue |
|---|---|---|
| Technology | 27 | $1,492B |
|
||
| Financial Services | 3 | $174B |
|
||
| Retail | 3 | $44B |
|
||
| Insurance | 3 | $26B |
|
||
| Media / Entertainment | 2 | $115B |
|
||
| Pharmaceuticals / Biotech | 2 | $62B |
|
||
Price history
+315.3% since first listed4 events — show timeline
- 2026-05-09 Listed $245,000 SDMLS
- 2012-11-14 Sold (MLS) $53,000 CRMLS
- 2012-10-29 Price Changed $59,000 SDMLS
- 2012-09-24 Listed $59,000 CRMLS
Cash-flow waterfall
monthlySold comps — $/sqft
last 12 mo · ≤1 miLoading sold comps…