23 Bouton St · West Mountain, CT
Flood risk 1/10 · Minimal
- FEMA flood zone
- X (unshaded)
- Chance of flooding over 30 yrs
- 0.0%
- Est. flood insurance / yr
- $473 – $860
Fire risk 3/10 · Minor
- Est. fire insurance / yr
- $691 – $1,283
Heat risk 4/10 · Minor
- Hot days now (above 98°F)
- 7 days/yr
- Hot days in 30 yrs
- 17 days/yr
Wind risk 6/10 · Moderate
- Chance of severe wind over 30 yrs
- 27.0%
Air-quality risk 4/10 · Minor
- Unhealthy air days now
- 3 days/yr
- Unhealthy air days in 30 yrs
- 6 days/yr
Risk factors via First Street. Map © Google.
Why this score? — see what drove the A- grade
The composite is a weighted blend of 9 inputs, each scored 0–100. Each bar is that input's sub-score; the figure is the points it added to the 100-point composite (weight × sub-score).
- Cash flow +30.0/30.0
- ARV discount +15.0/15.0
- 1% rule +10.0/10.0
- DSCR +10.0/10.0
- Schools +7.5/10.0
- Rent growth +2.5/5.0
- Livability +2.5/5.0
- Condition / age +2.5/5.0
- Appreciation +0.0/10.0
$685,000
🖨 Deal sheet (PDF) 📄 Offer letter ✓ Due diligence
Listing remarks MLS
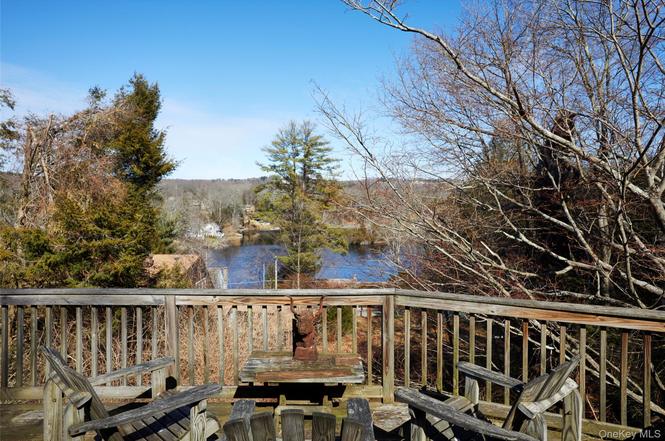
Charming Family Home In Great Lake Community. Beautifully Treed Lot With Lake And Beach Rights. Assoc. Fees. 3/4 Brs. Lovely Study. Orignial Fireplace. Large Lvg. Rm. Includes Lots 20 & 22.
Key facts
- Open floor plan
- Lake views
- Sliding glass doors
Tags
Property features AI
Finance
- HOA & community: Community association with annual fee of $300 covering common area maintenance
Exterior
- Parking: Driveway parking (total 2); Attached garage (1 car)
- Utilities: Water connected; Septic tank; Electricity connected; Private trash collection
- Home design: Single family residence; Three or more levels
- Construction: Vinyl siding construction; Block foundation
- Exterior features: Waterfront property; Vinyl siding
Interior
- Kitchen: Dishwasher; Refrigerator
- Bedrooms: Total of 9 rooms (bedrooms included) — multiple levels
- Flooring: Hardwood floors
- Bathrooms: Two full bathrooms; One half bathroom
- Heating & cooling: Oil heating; Central air conditioning; Living room fireplace (1)
- Interior features: Open floor plan; First-floor full bathroom; Deck; Unfinished basement; Pull-down attic stairs
- Laundry & utility: Washer; Dryer
Neighborhood map
What this means for you Summary
Snapshot
- This is a 3-bed/2.5-bath single-family listed at $685k.
Deal economics
- At list price, monthly cash flow is $5k ($56k/yr) — positive.
- The deal already cash-flows at list — no discount required.
- Meets the 1% rule at list price ($12k rent vs $685k).
- Recommended offer: $675k (1.5% below list) — sets the bar for market timing.
- Cap rate 14.4% vs local median 3.1% in West Mountain — top-decile yield for the area; either an underpriced asset or a hidden risk that comps aren't pricing in. Stress-test before assuming the spread holds.
Location & tenants
- Location reads: area grade A — affects rentability + tenant quality, not the cash-flow math above.
- Katonah-Lewisboro Union Free School District (suburban): math 75% / reading 82% proficiency, ranked #32 of 590 in NY (top 5%) — strong family-tenant draw, lease renewals of 3-5y typical; only 3% free/reduced lunch — higher-income household profile.
- Zoned schools: Increase Miller Elementary School (math 82% / reading 87%, grade A+, #93 of 2,108 statewide, top 6%, 489 students, 9% FRL); John Jay Middle School (math 58% / reading 79%, grade A, #94 of 729 statewide, top 13%, 662 students, 7% FRL); John Jay High School (math 98% / reading 82%, grade A+, #238 of 1,100 statewide, top 23%, 917 students, 9% FRL).
- Market conditions: 5 comparable units currently listed for rent nearby; rentals leasing fast (median 4d on market — plan ~1-2 weeks tenant-placement turnaround); 954 units permitted in Westchester County in 2024 (649 in 5+ unit buildings).
Forward outlook
- Local home prices are declining (-3.0%/yr); year-one equity from $5k of loan paydown is wiped out by about $21k of value loss. Plan a longer hold.
- Westchester County population projected at +10% by 2050 — modest demand growth; plan on rents tracking national, not racing it.
- At projected returns (-3.0% appreciation + 3.0% rent growth), your $192k cash investment doubles in ~5 years — after that, you're playing with house money.
Negotiation context
- It's been on market 30 days — a 2% lower offer ($675k) is reasonable based on typical stale-listing flexibility.
- 4 sale attempts since 27y ago with the ask held roughly flat each time — persistent listings suggest the price (not the market) is what's stuck; bring a comps-based counter.
- Current owner paid $345k; list at $685k implies a 99% gain — meaningful room to come down on a strong offer.
Risks & watch-outs
- Watch-outs: built in 1920 — expect roof / HVAC / electrical / plumbing capex.
- Climate carrying-cost: major wind risk, 27% chance of damaging wind over 30y — expect insurance premiums to compound above CPI over the hold.
Questions for the listing agent
- Built in 1920 — when were the roof, HVAC, electrical panel, plumbing, and water heater last replaced?
- What does the HOA fee cover, when was the last increase, and are there any pending special assessments or reserve-fund shortfalls?
- Is there a deadline driving the sale (1031 exchange, divorce, estate, relocation)? That informs how much negotiation room exists.
- What's the average days-on-market for RENTAL listings here right now (not sales)? A rising rental-DOM trend means longer vacancies and softer asking-rent achievability than the comps imply.
- What's the recent tenant-quality profile in this submarket — average credit score on applications, eviction rate, late-payment / NSF rate, and stable-employment percentage? A property-management company in the area should have these aggregated.
- How much new for-sale + rental construction is in the pipeline within 1–3 miles? Heavy new supply typically softens prices + rents 12–24 months out; constrained supply supports both.
Investment metrics
- 1% rule
- 1.76% ✓
- Cap rate
- 14.44%
- Cash-on-cash
- 29.11%
- DSCR
- 2.30
- GRM
- 4.7
CMA / ARV
- ARV (on-the-fly)
- $1,143,268
- Comps found
- 8
Show comp detail 8 sales within ~0.75 mi
| Address | Dist | Beds/Ba | Sqft | Sold | Price | $/sf | Match |
|---|---|---|---|---|---|---|---|
| 24 Indian Ln | 0.16mi | 3/3.0 | 2,025 (+9%) | 12mo | $1,375,000 | $679 | 66 |
| 135 Main St | 0.23mi | 3/3.0 | 1,993 (+7%) | 13mo | $785,000 | $394 | 65 |
| 39 Knapp Rd | 0.72mi | 2/3.0 (-1) | 1,955 (+5%) | 5mo | $1,265,000 | $647 | 47 |
| 29 Oscaleta Rd | 0.55mi | 3/2.0 | 2,076 (+12%) | 8mo | $1,275,000 | $614 | 46 |
| 21 Lake Shore Dr | 0.72mi | 2/3.0 (-1) | 1,940 (+4%) | 8mo | $1,325,000 | $683 | 46 |
| 45 Old Oscaleta Rd | 0.44mi | 3/2.0 | 1,660 (-11%) | 21mo | $965,000 | $581 | 42 |
| 7 Main St | 0.73mi | 3/2.5 | 2,116 (+14%) | 9mo | $999,000 | $472 | 35 |
| 167 Main St | 0.49mi | 4/2.5 (+1) | 2,120 (+14%) | 20mo | $955,000 | $450 | 33 |
Match score weights: distance 35% · size 25% · config 20% · recency 20%. Top-matched comps best support the ARV.
Projected returns pro-forma
-3.0% appreciation · 3.0% rent growth · sell at horizon
- IRR
- 23.5%
- Equity multiple
- 1.97×
- Total profit
- $185,648
- Equity at exit
- $102,136
- IRR
- 31.4%
- Equity multiple
- 3.84×
- Total profit
- $544,407
- Equity at exit
- $59,226
Cash invested: $191,800 (down + closing). Projections, not guarantees.
Landlord ↔ Tenant lean methodology
- Overall (STATE)
- 27 Tenant-Leaning
- State Connecticut
- 27 Tenant-Leaning · D+7
- County
- — inherits STATE
- City
- — inherits STATE
ZIP-level market 10590
- Home prices YoY
- -30.8%
- Price-to-rent
- 4.7×
Monthly cashflow live
- Estimated rent
- $12,077 medium interval (Pro) →
- Mortgage (P&I)
- −$3,592
- Tax from tax record
- −$985 /mo · $11,818/yr
- Insurance
- −$285
- HOA
- −$25
- Vacancy / Maint / Mgmt
- −$2,536
- Net cashflow
- $4,653
Break-even live
Sensitivity live
| Price | -10% $5,041 | -5% $4,847 | +0% $4,653 | +5% $4,459 | +10% $4,266 |
|---|---|---|---|---|---|
| Rent | -10% $3,699 | -5% $4,176 | +0% $4,653 | +5% $5,130 | +10% $5,607 |
| Rate | -1.0pp $4,998 | -0.5pp $4,828 | base $4,653 | +0.5pp $4,476 | +1.0pp $4,295 |
UW: 25.0% down · 7.5% · 30yr · 1.5% tax · 5.0% vac · 8.0% maint · 8.0% mgmt
Financing live
Cash to close
- Down payment
- $171,250
- Closing costs
- $20,550
- Reserves months
- —
- Total cash needed
- —
Loan-product check · same deal, 3 products live
Conventional
25% down · 7.5% · 30yr
- Down + closing
- —
- Monthly P&I
- —
- Monthly cashflow
- —
- DSCR
- —
- Eligible?
- —
Personal DTI + credit; lowest rate.
DSCR
20% down · 8.5% · 30yr
- Down + closing
- —
- Monthly P&I
- —
- Monthly cashflow
- —
- DSCR
- —
- Eligible?
- —
No personal income docs; deal must DSCR.
Hard money
10% down · 12.0% · 12mo
- Down + closing
- —
- Monthly P&I
- —
- Monthly cashflow
- —
- DSCR
- —
- Eligible?
- —
Short-term bridge; refi at stabilization.
Rent comps 5 comps
| Address | Beds | Baths | Sqft | Rent | $/sqft | DOM | Units | Dist |
|---|---|---|---|---|---|---|---|---|
| 68 Lake Shore Dr South Salem, NY | 4.0 | 2.5 | 2430 | $6,500 | $2.67 | 15d | 1 | 0.23mi |
| 57 Truesdale Lake Dr South Salem, NY | 3.0 | 2.5 | 1350 | $7,000 | $5.19 | 3d | 1 | 0.45mi |
| 49 Twin Lakes Rd South Salem, NY | 3.0 | 3.0 | 2435 | $14,000 | $5.75 | 3d | 1 | 0.99mi |
| 34 Twin Lakes Rd South Salem, NY | 3.0 | 2.0 | 1866 | $15,000 | $8.04 | 3d | 1 | 1.01mi |
| 24 Cove Rd South Salem, NY | 3.0 | 2.0 | 1600 | $18,000 | $11.25 | 3d | 1 | 1.33mi |
HOA detail
- Monthly dues
- $25 · $300/yr
Listing history 14 events
-
2026-04-11status Pending
-
2026-03-31price $685,000
-
2026-03-24price $699,000
-
2026-03-24price $705,000
-
2026-03-18price $718,000
-
2026-03-11$719,000 Active
-
2000-06-05soldstatus $345,000
-
2000-05-04soldstatus $345,000 194-char remark
Show marketing remark (194 chars)
Charming Family Home In Great Lake Community. Beautifully Treed Lot With Lake And Beach Rights. Assoc. Fees. 3/4 Brs. Lovely Study. Orignial Fireplace. Large Lvg. Rm. Includes Lots 20 & 22.
-
2000-03-14historical 194-char remark
Show marketing remark (194 chars)
Charming Family Home In Great Lake Community. Beautifully Treed Lot With Lake And Beach Rights. Assoc. Fees. 3/4 Brs. Lovely Study. Orignial Fireplace. Large Lvg. Rm. Includes Lots 20 & 22.
-
2000-03-14price $359,000 194-char remark
Show marketing remark (194 chars)
Charming Family Home In Great Lake Community. Beautifully Treed Lot With Lake And Beach Rights. Assoc. Fees. 3/4 Brs. Lovely Study. Orignial Fireplace. Large Lvg. Rm. Includes Lots 20 & 22.
-
2000-02-18historical
-
2000-01-18$345,000 194-char remark
Show marketing remark (194 chars)
Charming Family Home In Great Lake Community. Beautifully Treed Lot With Lake And Beach Rights. Assoc. Fees. 3/4 Brs. Lovely Study. Orignial Fireplace. Large Lvg. Rm. Includes Lots 20 & 22.
-
2000-01-18
Show marketing remark (194 chars)
Charming Family Home In Great Lake Community. Beautifully Treed Lot With Lake And Beach Rights. Assoc. Fees. 3/4 Brs. Lovely Study. Orignial Fireplace. Large Lvg. Rm. Includes Lots 20 & 22.
-
1999-10-06
ⓘ Source: listings_history table (triggers on properties + properties_extension) + one-shot
backfill from property_details.listing_events for pre-trigger history.
Tax reassessment forecast CT · Partial reset (capped growth)
- Current annual tax
- $11,818 · $985/mo
- Projected year-2 tax
- $13,238 · $1,103/mo
- Expected delta
- +$1,421/yr (+$118/mo · 12.0%)
ⓘ Screening estimate from a state-policy table — verify with the county assessor before closing.
Climate risk First Street
- Flood 1/10 Low FEMA zone X (unshaded) · 0% chance over 30 yrs
- Wildfire 3/10 Moderate
- Heat 4/10 Moderate 7 d/yr ≥98°F today · 17 d/yr by 30 yrs out
- Wind 6/10 Major 27% chance of damaging wind over 30 yrs
- Air quality 4/10 Moderate 3 unhealthy d/yr today · 6 by 30 yrs out
Nearby sold comps map
Loading sold comps map…
Walkable amenities ~0.75 mi
Loading nearby amenities…
Taxation est. · year 1
- Rental income
- $144,923
- − Mortgage interest
- −$38,371
- − Property taxes
- −$11,818
- − Insurance
- −$3,425
- − Repairs & maintenance
- −$11,594
- − Management
- −$11,594
- − HOA
- −$300
- − Depreciation
- −$19,927
- Taxable income
- $47,894
- Est. tax owed @ 24.0%
- −$11,495
- After-tax cash flow
- $44,345/yr
For passive investors: Depreciation is non-cash, so a rental often shows a tax loss while cash-flowing — sheltering income. Rental losses are passive: they offset passive income freely, and up to $25,000/yr can offset ordinary (W-2) income if you actively participate and your MAGI is under $100k (phasing out to $0 by $150k); unused losses carry forward. On sale, claimed depreciation is recaptured at up to 25%, and gains may owe capital-gains tax (a 1031 exchange can defer both). Figures are a year-1 estimate at your 24.0% rate — not tax advice; consult a CPA.
Schools (NCES district)
- District
- Katonah-Lewisboro Union Free School District
- NCES district ID
- 3616080
- Math proficiency
- 75% ▼ -8.00%
- Reading proficiency
- 82% ▲ 2.00%
- Median HH income
- $140,994
- Composite
- 75.09/100
- National rank
- #142
- State rank
- #32 of 590 in NY
Livability — West Mountain
No livability data for this city. (Only ~50 U.S. cities are tracked.)
Census & demographics
- Population (ZIP)
- 7,314
Population outlook (Westchester County) Hauer SSP2
- Today (2025)
- 1,028,035 people
- By 2030
- 1,051,636 · +2.3%
- By 2040
- 1,098,520 · +6.9%
- By 2050
- 1,136,044 · +10.5%
- By 2075
- 1,196,925 · +16.4%
- By 2100
- 1,175,147 · +14.3%
Race, ethnicity, and origin ACS 2023
- Neighborhood character
- Predominantly White (84%)
- Race & ethnicity
- White 84% Two or more races 8% Hispanic / Latino 6% Asian 4% Black 1%
- Hispanic origin (detail)
- Puerto Rican 3%
- Common ancestry
- Italian 4% Romanian 3% Scotch-Irish 2%
- Foreign-born
- 13% · Canada, South Korea, Jamaica
- Languages at home
- 90% English-only · Spanish 4% Other Indo-European 2% Korean 1%
Political lean MEDSL · Westchester
- 2024 margin
- Strong D (+26.3) · D 63.1% · R 36.9%
- 2008→2024 swing
- -1.3pp toward R · 2008: 27.6pp · 2024: 26.3pp
- All cycles
- 2024: D+26.3 2020: D+36.3 2016: D+32.8 2012: D+22.2 2008: D+27.6
Not yet ingested
- Civics
- —
Market trends
- HPI YoY
- ▼ -66.87%
- Current HPI
- 150.088
- Rent YoY
- —
- Metro
- —
- State GDP YoY
- ▲ 1.06%
- F500 in state
- 38
Industry mix (Fortune 500 HQ in CT)
| Industry | F500 HQs | Revenue |
|---|---|---|
| Industrial Machinery | 4 | $38B |
|
||
| Insurance | 3 | $71B |
|
||
| Financial Services | 2 | $25B |
|
||
| Transportation / Logistics | 2 | $18B |
|
||
| Healthcare | 1 | $247B |
|
||
| Telecommunications | 1 | $55B |
|
||
Price history
+98.6% since first listed14 events — show timeline
- 2026-04-11 Pending — OneKey® MLS as Distributed by MLS Grid
- 2026-03-31 Price Changed $685,000 OneKey® MLS as Distributed by MLS Grid
- 2026-03-24 Price Changed $699,000 OneKey® MLS as Distributed by MLS Grid
- 2026-03-24 Price Changed $705,000 OneKey® MLS as Distributed by MLS Grid
- 2026-03-18 Price Changed $718,000 OneKey® MLS as Distributed by MLS Grid
- 2026-03-11 Listed $719,000 OneKey® MLS as Distributed by MLS Grid
- 2000-06-05 Sold (Public Records) $345,000 Public Records
- 2000-05-04 Sold (MLS) $345,000 HGMLS
- 2000-03-14 Price Changed $359,000 HGMLS
- 2000-03-14 Delisted — HGMLS
- 2000-02-18 Delisted — HGMLS
- 2000-01-18 Listed — HGMLS
- 2000-01-18 Listed $345,000 HGMLS
- 1999-10-06 Listed — HGMLS
Property tax history
+6.3%/yrLatest (2025): $11,818 · +4.1% YoY. Source: county tax records.
Cash-flow waterfall
monthlySold comps — $/sqft
last 12 mo · ≤1 miLoading sold comps…