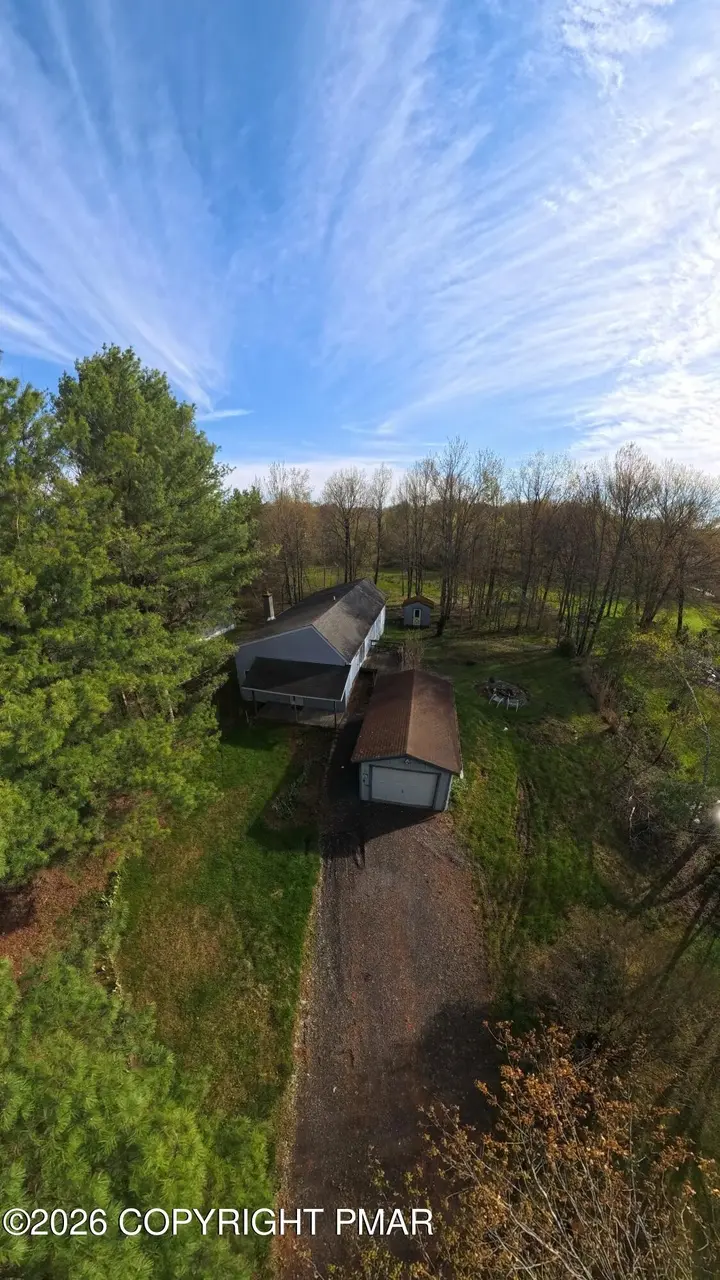
220 Cranberry Dr · Holiday Pocono, PA
Flood risk 1/10 · Minimal
- FEMA flood zone
- X (unshaded)
- Chance of flooding over 30 yrs
- 0.0%
- Est. flood insurance / yr
- $473 – $860
Fire risk 3/10 · Minor
- Est. fire insurance / yr
- $511 – $949
Heat risk 2/10 · Minimal
- Hot days now (above 89°F)
- 7 days/yr
- Hot days in 30 yrs
- 16 days/yr
Wind risk 3/10 · Minor
- Chance of severe wind over 30 yrs
- 6.0%
Air-quality risk 2/10 · Minimal
- Unhealthy air days now
- 1 days/yr
- Unhealthy air days in 30 yrs
- 1 days/yr
Risk factors via First Street. Map © Google.
Why this score? — see what drove the B- grade
The composite is a weighted blend of 9 inputs, each scored 0–100. Each bar is that input's sub-score; the figure is the points it added to the 100-point composite (weight × sub-score).
- Cash flow +23.6/30.0
- ARV discount +15.0/15.0
- DSCR +7.6/10.0
- 1% rule +6.4/10.0
- Appreciation +4.3/10.0
- Schools +4.0/10.0
- Livability +2.9/5.0
- Rent growth +2.5/5.0
- Condition / age +2.2/5.0
$299,000
🖨 Deal sheet (PDF) 📄 Offer letter ✓ Due diligence
Listing remarks
Investor opportunity in the Pocono Mountains. This 4 bedroom, 2 bathroom home offers over 2,200 square feet and is being sold as-is, making it the perfect opportunity to renovate and design exactly the way you want. Situated on over a half-acre lot in Greenwood Acres, this property has excellent potential as a short-term rental investment, vacation home, or full-time residence. The community features over 45 short-term rentals along with full-time residents and vacation homeowners, creating a strong investment environment. The property is connected to central sewer and serviced by well water. Enjoy easy access to beautiful Lake Sinca just down the hill, where you can fish, swim, and enjoy e
Key facts
- Vacation home
- Half-acre lot
- Lake sinca
Tags
Property features AI
Finance
- Other: Zoning: R2 (residential)
- HOA & community: Homeowners association with annual fee of $700 (about $58.33/month); Association amenities include security and a playground; Subdivision: Greenwood Acres
Exterior
- Parking: Total of 6 parking spaces; 1 garage space; Open parking available (6 spaces)
- Security: Community security (through homeowners association)
- Utilities: Well water; Public sewer; 200+ amp electric service
- Home design: Single family house; 2 stories; Faces west
- Construction: Block foundation; Asphalt roof; Year built not provided; House construction material not otherwise specified
- Exterior features: Asphalt roof; Deck; Storage; Paved road access; Road maintained by a road maintenance agreement
Interior
- Bedrooms: Total of 10 rooms (bedroom count not specified)
- Flooring: Carpet; Concrete; Dirt floor areas; Linoleum
- Bathrooms: 2 full bathrooms
- Heating & cooling: Baseboard heating; No central cooling
- Interior features: Unfurnished; Storage; Deck; Patio/porch features noted as 'See Remarks'
- Laundry & utility: Washer hookup in basement; Laundry area located in basement
Neighborhood map
What this means for you Summary
Snapshot
- This is a 4-bed/2.0-bath single-family listed at $299k. Condition is rated fair.
Deal economics
- At list price, monthly cash flow is $562 ($7k/yr) — positive.
- The deal already cash-flows at list — no discount required.
- Meets the 1% rule at list price ($3k rent vs $299k).
- Recommended offer: $295k (1.5% below list) — sets the bar for market timing.
- Cap rate 8.5% vs local median 1.1% in Holiday Pocono — top-decile yield for the area; either an underpriced asset or a hidden risk that comps aren't pricing in. Stress-test before assuming the spread holds.
Location & tenants
- Location reads 58/100 on livability (#1,558 in PA) — a working-class tenant base; expect higher turnover. Strengths: cost of living A+; Watch: health & safety D, schools F, amenities F.
- Pocono Mountain SD (rural): math 37% / reading 55% proficiency, ranked #245 of 539 in PA (top 46%) — families likely to look elsewhere, expect single-tenant / working-renter base with shorter leases.
- Market conditions: 247 active listings in the ZIP; 1 comparable units currently listed for rent nearby; 278 units permitted in Monroe County in 2024 (52 in 5+ unit buildings).
Forward outlook
- Local home prices are declining (-1.5%/yr); year-one equity from $2k of loan paydown is wiped out by about $4k of value loss. Plan a longer hold.
- Monroe County population projected at -11% by 2050 — secular population decline; favor cash flow + early exit over multi-decade hold.
- At projected returns (-1.5% appreciation + 3.0% rent growth), your $84k cash investment doubles in ~10 years — after that, you're playing with house money.
Negotiation context
- It's been on market 25 days — a 2% lower offer ($295k) is reasonable based on typical stale-listing flexibility.
Questions for the listing agent
- Have any recent inspections been done? Can we get a copy of the seller's disclosures and any deferred-maintenance estimates?
- What does the HOA fee cover, when was the last increase, and are there any pending special assessments or reserve-fund shortfalls?
- Is there a deadline driving the sale (1031 exchange, divorce, estate, relocation)? That informs how much negotiation room exists.
- Schools are F-rated, which usually means shorter tenancies and higher turnover. Who's the typical renter profile here, and what's been the actual vacancy rate?
- What's the average days-on-market for RENTAL listings here right now (not sales)? A rising rental-DOM trend means longer vacancies and softer asking-rent achievability than the comps imply.
- What's the recent tenant-quality profile in this submarket — average credit score on applications, eviction rate, late-payment / NSF rate, and stable-employment percentage? A property-management company in the area should have these aggregated.
- How much new for-sale + rental construction is in the pipeline within 1–3 miles? Heavy new supply typically softens prices + rents 12–24 months out; constrained supply supports both.
Investment metrics
- 1% rule
- 1.14% ✓
- Cap rate
- 8.55%
- Cash-on-cash
- 8.05%
- DSCR
- 1.36
- GRM
- 7.3
CMA / ARV
- ARV (on-the-fly)
- $374,000
- Comps found
- 11
Show comp detail 11 sales within ~0.75 mi
| Address | Dist | Beds/Ba | Sqft | Sold | Price | $/sf | Match |
|---|---|---|---|---|---|---|---|
| 142 Driftwood Dr | 0.12mi | 3/2.0 (-1) | 1,982 (-1%) | 4mo | $370,000 | $187 | 84 |
| 132 Woodbury Dr | 0.45mi | 4/2.5 | 2,100 (+5%) | 10mo | $378,000 | $180 | 60 |
| 122 Cranberry Dr | 0.48mi | 3/2.5 (-1) | 1,856 (-7%) | 3mo | $340,000 | $183 | 56 |
| 129 Birchwood Rd | 0.45mi | 3/2.5 (-1) | 2,100 (+5%) | 10mo | $349,000 | $166 | 56 |
| 132 Woodbury Dr | 0.45mi | 3/2.5 (-1) | 2,100 (+5%) | 10mo | $378,000 | $180 | 55 |
| 121 Lidio Rd | 0.44mi | 5/3.0 (+1) | 2,072 (+4%) | 17mo | $489,500 | $236 | 50 |
| 5266 Beechwood Rd | 0.61mi | 4/3.0 | 1,882 (-6%) | 10mo | $370,000 | $197 | 49 |
| 130 Cranberry Dr | 0.45mi | 3/2.5 (-1) | 1,804 (-10%) | 12mo | $370,000 | $205 | 46 |
| 108 Cranberry Dr | 0.54mi | 3/2.5 (-1) | 1,855 (-7%) | 21mo | $329,900 | $178 | 38 |
| 123 Elm Dr | 0.57mi | 5/3.0 (+1) | 2,267 (+13%) | 5mo | $425,000 | $187 | 38 |
| 106 Cranberry Dr | 0.57mi | 5/3.0 (+1) | 2,183 (+9%) | 19mo | $465,000 | $213 | 33 |
Match score weights: distance 35% · size 25% · config 20% · recency 20%. Top-matched comps best support the ARV.
Projected returns pro-forma
-1.47% appreciation · 3.0% rent growth · sell at horizon
- IRR
- 2.0%
- Equity multiple
- 1.08×
- Total profit
- $7,032
- Equity at exit
- $65,457
- IRR
- 9.1%
- Equity multiple
- 1.84×
- Total profit
- $70,525
- Equity at exit
- $63,161
Cash invested: $83,720 (down + closing). Projections, not guarantees.
Landlord ↔ Tenant lean methodology
- Overall (STATE)
- 62 Landlord-Friendly
- State Pennsylvania
- 62 Landlord-Friendly · EVEN
- County
- — inherits STATE
- City
- — inherits STATE
ZIP-level market 18347
- Home prices YoY
- -0.7%
- Active inventory
- 247
- Price-to-rent
- 7.3×
Monthly cashflow live
- Estimated rent
- $3,400 medium interval (Pro) →
- Mortgage (P&I)
- −$1,568
- Tax est. 1.5%
- −$374 /mo · $4,485/yr
- Insurance
- −$125
- HOA
- −$58
- Vacancy / Maint / Mgmt
- −$714
- Net cashflow
- $562
Break-even live
Sensitivity live
| Price | -10% $768 | -5% $665 | +0% $562 | +5% $458 | +10% $355 |
|---|---|---|---|---|---|
| Rent | -10% $293 | -5% $427 | +0% $562 | +5% $696 | +10% $830 |
| Rate | -1.0pp $712 | -0.5pp $638 | base $562 | +0.5pp $484 | +1.0pp $405 |
UW: 25.0% down · 7.5% · 30yr · 1.5% tax · 5.0% vac · 8.0% maint · 8.0% mgmt
Financing live
Cash to close
- Down payment
- $74,750
- Closing costs
- $8,970
- Reserves months
- —
- Total cash needed
- —
Loan-product check · same deal, 3 products live
Conventional
25% down · 7.5% · 30yr
- Down + closing
- —
- Monthly P&I
- —
- Monthly cashflow
- —
- DSCR
- —
- Eligible?
- —
Personal DTI + credit; lowest rate.
DSCR
20% down · 8.5% · 30yr
- Down + closing
- —
- Monthly P&I
- —
- Monthly cashflow
- —
- DSCR
- —
- Eligible?
- —
No personal income docs; deal must DSCR.
Hard money
10% down · 12.0% · 12mo
- Down + closing
- —
- Monthly P&I
- —
- Monthly cashflow
- —
- DSCR
- —
- Eligible?
- —
Short-term bridge; refi at stabilization.
Rent comps 1 comps
| Address | Beds | Baths | Sqft | Rent | $/sqft | DOM | Units | Dist |
|---|---|---|---|---|---|---|---|---|
| 49 Driftwood Dr Blakeslee, PA | 5.0 | 2.5 | 2603 | $3,400 | $1.31 | 44d | 1 | 0.54mi |
HOA detail
- Monthly dues
- $58 · $696/yr
- Likely covers
- watersewer
Listing history 16 events
-
2026-06-19days on market $299,000 Active 25 DOM
-
2026-06-18days on market $299,000 Active 24 DOM
-
2026-06-17days on market $299,000 Active 23 DOM
-
2026-06-16days on market $299,000 Active 22 DOM
-
2026-06-15days on market $299,000 Active 21 DOM
-
2026-06-14days on market $299,000 Active 19 DOM
-
2026-06-13days on market $299,000 Active 18 DOM
-
2026-06-10days on market $299,000 Active 16 DOM
-
2026-06-09days on market $299,000 Active 15 DOM
-
2026-06-08days on market $299,000 Active 14 DOM
-
2026-06-07days on market $299,000 Active 13 DOM
-
2026-06-02days on market $299,000 Active 8 DOM
-
2026-06-01days on market $299,000 Active 7 DOM
-
2026-05-31days on market $299,000 Active 6 DOM
-
2026-05-30days on market $299,000 Active 5 DOM
-
2026-05-23$299,000 Active
ⓘ Source: listings_history table (triggers on properties + properties_extension) + one-shot
backfill from property_details.listing_events for pre-trigger history.
Climate risk First Street
- Flood 1/10 Low FEMA zone X (unshaded) · 0% chance over 30 yrs
- Wildfire 3/10 Moderate
- Heat 2/10 Low 7 d/yr ≥89°F today · 16 d/yr by 30 yrs out
- Wind 3/10 Moderate 6% chance of damaging wind over 30 yrs
- Air quality 2/10 Low 1 unhealthy d/yr today · 1 by 30 yrs out
Nearby sold comps map
Loading sold comps map…
Walkable amenities ~0.75 mi
Loading nearby amenities…
Taxation est. · year 1
- Rental income
- $40,800
- − Mortgage interest
- −$16,749
- − Property taxes
- −$4,485
- − Insurance
- −$1,495
- − Repairs & maintenance
- −$3,264
- − Management
- −$3,264
- − HOA
- −$696
- − Depreciation
- −$8,698
- Taxable income
- $2,149
- Est. tax owed @ 24.0%
- −$516
- After-tax cash flow
- $6,224/yr
For passive investors: Depreciation is non-cash, so a rental often shows a tax loss while cash-flowing — sheltering income. Rental losses are passive: they offset passive income freely, and up to $25,000/yr can offset ordinary (W-2) income if you actively participate and your MAGI is under $100k (phasing out to $0 by $150k); unused losses carry forward. On sale, claimed depreciation is recaptured at up to 25%, and gains may owe capital-gains tax (a 1031 exchange can defer both). Figures are a year-1 estimate at your 24.0% rate — not tax advice; consult a CPA.
Condition & rehab AI · 13 photos
This property requires significant repairs and maintenance to improve its condition and value. Potential investors should consider a moderate renovation to bring it up to a good condition.
Repairs flagged
- Major roof — Signs of significant wear
- Major siding — Weathered and peeling
- Major HVAC unit — Exposed and in poor condition
- Major basement carpet — Worn and dirty
Value-add opportunities
- Both Paint interior walls — Fresh paint enhances curb appeal and interior aesthetics
- Both Landscaping and yard maintenance — A well-maintained yard improves curb appeal and property value
- Both HVAC service and replacement — A functional HVAC system ensures comfort and energy efficiency
Renovation cost estimate screening
| Repair item | Severity | Est. cost |
|---|---|---|
| roof · Signs of significant wear | Major | $15,000–50,000 |
| siding · Weathered and peeling | Major | $15,000–50,000 |
| HVAC unit · Exposed and in poor condition | Major | $15,000–50,000 |
| basement carpet · Worn and dirty | Major | $15,000–50,000 |
| Total estimated repair cost · 4 items | $60,000–200,000 |
Value-add ROI direction
- Both Paint interior walls — Fresh paint enhances curb appeal and interior aesthetics ↑
- Both Landscaping and yard maintenance — A well-maintained yard improves curb appeal and property value ↑
- Both HVAC service and replacement — A functional HVAC system ensures comfort and energy efficiency ↑
ⓘ Cost ranges are severity-bucket heuristics (US national rule-of-thumb). Get contractor quotes + a written scope before underwriting a rehab budget.
Schools (NCES district)
- District
- Pocono Mountain SD
- NCES district ID
- 4219500
- Math proficiency
- 37% ▼ -5.00%
- Reading proficiency
- 55% ▲ 1.00%
- Median HH income
- $55,317
- Composite
- 39.91/100
- National rank
- #3856
- State rank
- #245 of 539 in PA
Livability — Holiday Pocono
- Score
- 58/100
- State rank
- #1558
- US rank
- #20681
Category grades
Schools grade is shown separately in the Schools card above.
Census & demographics
- Population (ZIP)
- 3,535
Population outlook (Monroe County) Hauer SSP2
- Today (2025)
- 164,099 people
- By 2030
- 161,412 · -1.6%
- By 2040
- 154,616 · -5.8%
- By 2050
- 146,710 · -10.6%
- By 2075
- 140,830 · -14.2%
- By 2100
- 138,472 · -15.6%
Race, ethnicity, and origin ACS 2023
- Neighborhood character
- Predominantly White (87%)
- Race & ethnicity
- White 87% Hispanic / Latino 10% Black 2% Two or more races 2%
- Hispanic origin (detail)
- Mexican 3% Puerto Rican 5%
- Common ancestry
- Romanian 16% Lithuanian 2% Slovak 2%
- Foreign-born
- 3% · Canada, Jamaica
- Languages at home
- 88% English-only · Spanish 6% Other Indo-European 3% French/Haitian/Cajun 1%
Political lean MEDSL · Monroe
- 2024 margin
- Toss-up / Even · D 49.1% · R 49.9%
- 2008→2024 swing
- -17.1pp toward R · 2008: 16.3pp · 2024: -0.8pp
- All cycles
- 2024: R+0.8 2020: D+6.4 2016: D+0.3 2012: D+14.0 2008: D+16.3
Not yet ingested
- Civics
- —
Market trends
- HPI YoY
- ▼ -1.47%
- Current HPI
- 202.3693
- Rent YoY
- —
- Metro
- —
- State GDP YoY
- ▲ 1.68%
- F500 in state
- 34
Industry mix (Fortune 500 HQ in PA)
| Industry | F500 HQs | Revenue |
|---|---|---|
| Healthcare | 2 | $309B |
|
||
| Insurance | 2 | $27B |
|
||
| Telecommunications / Media | 1 | $124B |
|
||
| Industrial Distribution | 1 | $22B |
|
||
| Financial Services | 1 | $20B |
|
||
| Chemicals / Materials | 1 | $18B |
|
||
Price history
1 event — show timeline
- 2026-05-23 Listed $299,000 PMAR
Cash-flow waterfall
monthlySold comps — $/sqft
last 12 mo · ≤1 miLoading sold comps…