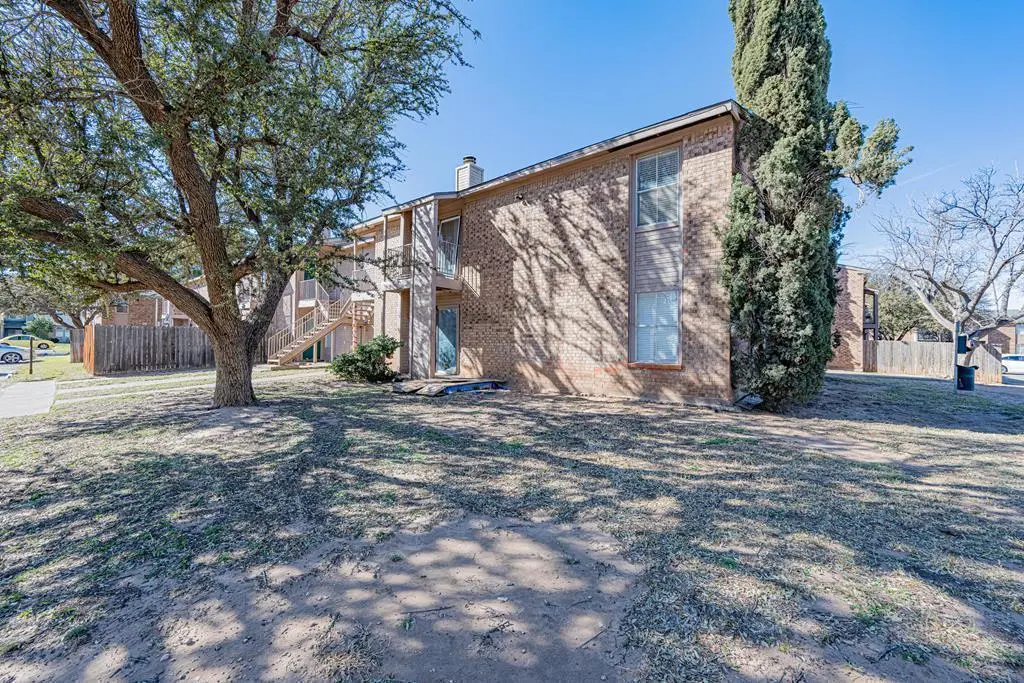
4700 Boulder Dr Unit 1106 · Midland, TX
Flood risk 6/10 · Moderate
- FEMA flood zone
- X
- Chance of flooding over 30 yrs
- 0.69%
- Est. flood insurance / yr
- $507 – $1,088
Fire risk 7/10 · Major
- Est. fire insurance / yr
- $1,222 – $2,270
Heat risk 6/10 · Moderate
- Hot days now (above 102°F)
- 7 days/yr
- Hot days in 30 yrs
- 22 days/yr
Wind risk 2/10 · Minimal
- Chance of severe wind over 30 yrs
- 3.0%
Air-quality risk 1/10 · Minimal
- Unhealthy air days now
- 0 days/yr
- Unhealthy air days in 30 yrs
- 0 days/yr
Risk factors via First Street. Map © Google.
Why this score? — see what drove the C- grade
The composite is a weighted blend of 9 inputs, each scored 0–100. Each bar is that input's sub-score; the figure is the points it added to the 100-point composite (weight × sub-score).
- Cash flow +17.0/30.0
- 1% rule +10.0/10.0
- ARV discount +7.5/15.0
- DSCR +5.3/10.0
- Livability +4.0/5.0
- Rent growth +3.6/5.0
- Schools +3.2/10.0
- Condition / age +2.5/5.0
- Appreciation +0.0/10.0
$99,000
🖨 Deal sheet (PDF) 📄 Offer letter ✓ Due diligence
Listing remarks MLS
Seller is ready to negotiate! This 2-bedroom, 2-bath condo on the 2nd floor is fully furnished for a seamless, move-in-ready experience. Enjoy updated flooring, a refreshed kitchen, and a functional layout designed for comfortable living. The south-east-facing orientation provides natural light throughout the day without the harsh heat of the West Texas sunset. Washer & dryer is included, making this an ideal low-maintenance home or investment opportunity.
Key facts
- Natural light
- Updated flooring
- Refreshed kitchen
Tags
Neighborhood map
What this means for you Summary
Snapshot
- This is a 2-bed/2.0-bath condo listed at $99k.
Deal economics
- At list price, monthly cash flow is $67 ($810/yr) — positive.
- The deal already cash-flows at list — no discount required.
- Meets the 1% rule at list price ($2k rent vs $99k).
- Recommended offer: $90k (9.0% below list) — sets the bar for market timing.
- Cap rate 7.1% vs local median 4.7% in Midland — top-decile yield for the area; either an underpriced asset or a hidden risk that comps aren't pricing in. Stress-test before assuming the spread holds.
Location & tenants
- Location reads 79/100 on livability (#57 in TX, #2,192 nationally) — a middle-class / working-renter tenant base. Strengths: employment A+, housing A+, health & safety A+; Watch: crime C-, commute D+, amenities D.
- Midland ISD (urban): math 34% / reading 36% proficiency, ranked #477 of 826 in TX (top 58%) — families likely to look elsewhere, expect single-tenant / working-renter base with shorter leases.
- Zoned schools: Parker El (math 42% / reading 36%, grade F, #1,651 of 4,322 statewide, top 39%, 567 students, 52% FRL); Alamo J H (math 23% / reading 32%, grade F, #1,156 of 1,662 statewide, top 71%, 865 students, 62% FRL); Legacy H S (math 37% / reading 3%, grade F, #1,397 of 1,632 statewide, top 87%, 2,504 students, 41% FRL) — zoned schools at 52% FRL track the district average.
- Market conditions: Rents rising fast (+4.5%/yr); 324 active listings in the ZIP; 18 comparable units currently listed for rent nearby; rentals at typical pace (median 15d on market — plan ~3-4 weeks tenant-placement turnaround); solid renter incomes; 1,504 units permitted in Midland County in 2024 (0 in 5+ unit buildings).
Forward outlook
- Local home prices are declining (-3.0%/yr); year-one equity from $684 of loan paydown is wiped out by about $3k of value loss. Plan a longer hold.
- Midland County population projected at +83% by 2050 — long-run rental-demand tailwind backs the buy-and-hold thesis.
Negotiation context
- It's been on market 115 days — a 9% lower offer ($90k) is reasonable based on typical stale-listing flexibility.
- 2 sale attempts; this cycle's ask has dropped $11k (10%) from the opening price — seller is motivated, your offer sets the floor, not the list.
Risks & watch-outs
- Watch-outs: HOA is 32% of rent.
- Climate carrying-cost: major flood risk; major wildfire risk; extreme-heat days projected 7→22/yr by 2055 (HVAC capex compounding) — expect insurance premiums to compound above CPI over the hold.
Questions for the listing agent
- It's been on market 115 days. Have you received any prior offers? Is the seller open to a 9% concession, seller financing, or rate buy-down credit?
- What does the HOA fee cover, when was the last increase, and are there any pending special assessments or reserve-fund shortfalls?
- Any open or pending special assessments — roof, HVAC, plumbing, elevator, façade? What's the per-unit balance and payoff schedule, and is the seller paying it off at close or rolling it to the buyer?
- Why hasn't it sold? Are there any deal-killer items the seller is aware of (foundation, flood, title, zoning, code violations)?
- Is there a deadline driving the sale (1031 exchange, divorce, estate, relocation)? That informs how much negotiation room exists.
- What's the average days-on-market for RENTAL listings here right now (not sales)? A rising rental-DOM trend means longer vacancies and softer asking-rent achievability than the comps imply.
- What's the recent tenant-quality profile in this submarket — average credit score on applications, eviction rate, late-payment / NSF rate, and stable-employment percentage? A property-management company in the area should have these aggregated.
- How much new apartment / multifamily construction is in the pipeline within 1–3 miles? Heavy new supply (>2% of stock underway) typically softens rents 12–24 months out; light construction supports rent growth.
Investment metrics
- 1% rule
- 1.53% ✓
- Cap rate
- 7.11%
- Cash-on-cash
- 2.92%
- DSCR
- 1.13
- GRM
- 5.5
CMA / ARV
No comps found within radius.
Projected returns pro-forma
-3.0% appreciation · 4.45% rent growth · sell at horizon
- IRR
- -8.8%
- Equity multiple
- 0.67×
- Total profit
- $-9,209
- Equity at exit
- $14,761
- IRR
- 3.7%
- Equity multiple
- 1.30×
- Total profit
- $8,183
- Equity at exit
- $8,560
Cash invested: $27,720 (down + closing). Projections, not guarantees.
Landlord ↔ Tenant lean methodology
- Overall (STATE)
- 87 Strongly Landlord-Friendly
- State Texas
- 87 Strongly Landlord-Friendly · R+5
- County
- — inherits STATE
- City
- — inherits STATE
ZIP-level market 79707
- Rents YoY
- 4.5%
- Active inventory
- 324
- Price-to-rent
- 5.5×
Monthly cashflow live
- Estimated rent
- $1,513 high interval (Pro) →
- Mortgage (P&I)
- −$519
- Tax from tax record
- −$78 /mo · $933/yr
- Insurance
- −$41
- HOA
- −$490
- Vacancy / Maint / Mgmt
- −$318
- Net cashflow
- $67
Break-even live
Sensitivity live
| Price | -10% $124 | -5% $95 | +0% $67 | +5% $39 | +10% $11 |
|---|---|---|---|---|---|
| Rent | -10% $-52 | -5% $8 | +0% $67 | +5% $127 | +10% $187 |
| Rate | -1.0pp $117 | -0.5pp $93 | base $67 | +0.5pp $42 | +1.0pp $16 |
UW: 25.0% down · 7.5% · 30yr · 1.5% tax · 5.0% vac · 8.0% maint · 8.0% mgmt
Financing live
Cash to close
- Down payment
- $24,750
- Closing costs
- $2,970
- Reserves months
- —
- Total cash needed
- —
Loan-product check · same deal, 3 products live
Conventional
25% down · 7.5% · 30yr
- Down + closing
- —
- Monthly P&I
- —
- Monthly cashflow
- —
- DSCR
- —
- Eligible?
- —
Personal DTI + credit; lowest rate.
DSCR
20% down · 8.5% · 30yr
- Down + closing
- —
- Monthly P&I
- —
- Monthly cashflow
- —
- DSCR
- —
- Eligible?
- —
No personal income docs; deal must DSCR.
Hard money
10% down · 12.0% · 12mo
- Down + closing
- —
- Monthly P&I
- —
- Monthly cashflow
- —
- DSCR
- —
- Eligible?
- —
Short-term bridge; refi at stabilization.
Rent comps 18 comps
| Address | Beds | Baths | Sqft | Rent | $/sqft | DOM | Units | Dist |
|---|---|---|---|---|---|---|---|---|
| 4700 Boulder Dr Midland, TX | 1.0–2.0 | 1.0–2.0 | 823 | $1,500 | $1.82 | 22d | 2 | 0.01mi |
| 3609 Caldera Blvd Midland, TX | 1.0–2.0 | 1.0–2.0 | 850 | $1,599 | $1.88 | 15d | 67 | 0.26mi |
| 4301 Raleigh Ct Midland, TX | 1.0–2.0 | 1.0–2.0 | 766 | $1,490 | $1.94 | 15d | 18 | 0.40mi |
| 3330 Caldera Blvd #141 Midland, TX | 1.0 | 1.0 | 621 | $1,100 | $1.77 | 45d | 1 | 0.56mi |
| 3316 Caldera Blvd #104 Midland, TX | 1.0 | 1.5 | 818 | $1,450 | $1.77 | 45d | 1 | 0.60mi |
| 3600 N Midland Dr Midland, TX | 1.0–2.0 | 1.0–2.0 | 900 | $1,425 | $1.58 | 15d | 9 | 0.81mi |
| 4415 Northcrest Dr Midland, TX | 1.0–2.0 | 1.0–2.0 | 804 | $1,594 | $1.98 | 15d | 17 | 0.83mi |
| 2818 West Loop 250 N Midland, TX | 1.0–3.0 | 1.0–2.0 | 1176 | $1,779 | $1.51 | 15d | 16 | 0.90mi |
| 2811 West Loop 250 N Midland, TX | 1.0–2.0 | 1.0–2.5 | 967 | $1,396 | $1.44 | 15d | 13 | 0.91mi |
| 4805 Briarwood Ave Midland, TX | 1.0–3.0 | 1.0–2.0 | 1028 | $1,860 | $1.81 | 15d | 18 | 0.96mi |
| 3417 N Midland Dr Midland, TX | 1.0–3.0 | 1.0–2.0 | 887 | $1,317 | $1.48 | 15d | 13 | 1.03mi |
| 2600 West Loop 250 N Midland, TX | 1.0–2.0 | 1.0–2.0 | 800 | $1,326 | $1.66 | 15d | 28 | 1.11mi |
| 3101 Midland Dr Midland, TX | 1.0–2.0 | 1.0–2.0 | 765 | $1,285 | $1.68 | 45d | 1 | 1.16mi |
| 2438 Whitmire Blvd Midland, TX | 1.0–2.0 | 1.0 | 800 | $1,275 | $1.59 | 45d | 1 | 1.27mi |
| 5200 Briarwood Ave Midland, TX | 1.0–2.0 | 1.0–2.0 | 893 | $2,124 | $2.38 | 15d | 24 | 1.33mi |
| 4715 W Wadley Ave Midland, TX | 1.0–2.0 | 1.0–2.5 | 872 | $1,514 | $1.74 | 15d | 10 | 1.39mi |
| 5244 West Loop 250 N Midland, TX | 1.0–2.0 | 1.0–2.0 | 791 | $1,749 | $2.21 | 15d | 34 | 1.44mi |
| 3200 Bromley Pl Midland, TX | 1.0–3.0 | 1.0–2.0 | 873 | $1,644 | $1.88 | 15d | 10 | 1.49mi |
HOA detail condo
- Monthly dues
- $490 · $5,880/yr
- Assessments
- None detected in remarks — confirm with the listing agent.
Listing history 20 events
-
2026-06-22days on market $99,000 Active 115 DOM
-
2026-06-19days on market $99,000 Active 113 DOM
-
2026-06-18days on market $99,000 Active 112 DOM
-
2026-06-17days on market $99,000 Active 111 DOM
-
2026-06-16days on market $99,000 Active 110 DOM
-
2026-06-15days on market $99,000 Active 109 DOM
-
2026-06-14days on market $99,000 Active 107 DOM
-
2026-06-13days on market $99,000 Active 106 DOM
-
2026-06-10days on market $99,000 Active 104 DOM
-
2026-06-09days on market $99,000 Active 103 DOM
-
2026-06-08days on market $99,000 Active 102 DOM
-
2026-06-07pricedays on market $99,000 Active 101 DOM
-
2026-06-03days on market $110,000 Active 97 DOM
-
2026-06-02days on market $110,000 Active 96 DOM
-
2026-06-01days on market $110,000 Active 95 DOM
-
2026-05-31days on market $110,000 Active 94 DOM
-
2026-05-30days on market $110,000 Active 93 DOM
-
2026-02-26$110,000 Active 466-char remark
Show marketing remark (459 chars)
Seller is ready to negotiate! This beautiful property is a fully furnished, move-in-ready 2-bedroom, 2-bath condo, updated throughout. Enjoy updated flooring, a refreshed kitchen, and a spacious, functional layout designed for comfortable living. The south-facing orientation provides natural light throughout the day without the harsh West Texas sunset heat. Washer and dryer are included, making this an ideal low-maintenance home or investment opportunity.
-
2026-02-26$110,000 Active 459-char remark
Show marketing remark (459 chars)
Seller is ready to negotiate! This beautiful property is a fully furnished, move-in-ready 2-bedroom, 2-bath condo, updated throughout. Enjoy updated flooring, a refreshed kitchen, and a spacious, functional layout designed for comfortable living. The south-facing orientation provides natural light throughout the day without the harsh West Texas sunset heat. Washer and dryer are included, making this an ideal low-maintenance home or investment opportunity.
-
2015-02-24soldstatus
ⓘ Source: listings_history table (triggers on properties + properties_extension) + one-shot
backfill from property_details.listing_events for pre-trigger history.
Tax reassessment forecast TX · Resets to sale price
- Current annual tax
- $933 · $78/mo
- Projected year-2 tax
- $1,812 · $151/mo
- Expected delta
- +$879/yr (+$73/mo · 94.2%)
ⓘ Screening estimate from a state-policy table — verify with the county assessor before closing.
Climate risk First Street
- Flood 6/10 Major FEMA zone X · 69% chance over 30 yrs
- Wildfire 7/10 Severe
- Heat 6/10 Major 7 d/yr ≥102°F today · 22 d/yr by 30 yrs out
- Wind 2/10 Low 3% chance of damaging wind over 30 yrs
- Air quality 1/10 Low 0 unhealthy d/yr today · 0 by 30 yrs out
Nearby sold comps map
Loading sold comps map…
Walkable amenities ~0.75 mi
Loading nearby amenities…
Taxation est. · year 1
- Rental income
- $18,162
- − Mortgage interest
- −$5,546
- − Property taxes
- −$933
- − Insurance
- −$495
- − Repairs & maintenance
- −$1,453
- − Management
- −$1,453
- − HOA
- −$5,880
- − Depreciation
- −$2,880
- Taxable loss
- −$478
- Est. tax savings @ 24.0%
- +$115
- After-tax cash flow
- $924/yr
For passive investors: Depreciation is non-cash, so a rental often shows a tax loss while cash-flowing — sheltering income. Rental losses are passive: they offset passive income freely, and up to $25,000/yr can offset ordinary (W-2) income if you actively participate and your MAGI is under $100k (phasing out to $0 by $150k); unused losses carry forward. On sale, claimed depreciation is recaptured at up to 25%, and gains may owe capital-gains tax (a 1031 exchange can defer both). Figures are a year-1 estimate at your 24.0% rate — not tax advice; consult a CPA.
Schools (NCES district)
- District
- Midland ISD
- NCES district ID
- 4830570
- Math proficiency
- 34% ▼ -7.00%
- Reading proficiency
- 36% ▬ 0.00%
- Median HH income
- $63,457
- Composite
- 31.63/100
- National rank
- #5938
- State rank
- #477 of 826 in TX
Livability — Midland
- Score
- 79/100
- State rank
- #57
- US rank
- #2192
Category grades
Schools grade is shown separately in the Schools card above.
Census & demographics
- Census place
- Midland, TX
- County
- Midland County · 168,494 people
- City population
- 168,494
- Metro
- Midland, TX
- Population (ZIP)
- 40,010
- Household income
- $99,886
- Rent vs Own
- Severe rent burden
- 1919.0
Population outlook (Midland County) Hauer SSP2
- Today (2025)
- 220,895 people
- By 2030
- 253,667 · +14.8%
- By 2040
- 325,498 · +47.4%
- By 2050
- 404,168 · +83.0%
- By 2075
- 609,802 · +176.1%
- By 2100
- 760,172 · +244.1%
Race, ethnicity, and origin ACS 2023
- Neighborhood character
- Diverse neighborhood (Simpson 0.58)
- Race & ethnicity
- White 56% Hispanic / Latino 31% Two or more races 11% Asian 5% Black 4%
- Hispanic origin (detail)
- Mexican 26% Cuban 1%
- Common ancestry
- Slovak 3% Lithuanian 2% Italian 1%
- Foreign-born
- 11% · Canada, China, Philippines
- Languages at home
- 79% English-only · Spanish 14% Other Asian/Pacific 2% Other Indo-European 1%
Political lean MEDSL · Midland
- 2024 margin
- Solid R (+60.5) · D 19.3% · R 79.8%
- 2008→2024 swing
- -3.3pp toward R · 2008: -57.3pp · 2024: -60.5pp
- All cycles
- 2024: R+60.5 2020: R+56.6 2016: R+55.2 2012: R+61.5 2008: R+57.3
Not yet ingested
- Civics
- —
Market trends
- HPI YoY
- ▼ -208.65%
- Current HPI
- 198.7489
- Rent YoY
- ▲ 4.45%
- Metro
- Midland, TX
- State GDP YoY
- ▲ 3.95%
- F500 in state
- 110
Industry mix (Fortune 500 HQ in TX)
| Industry | F500 HQs | Revenue |
|---|---|---|
| Energy | 16 | $1,198B |
|
||
| Technology | 5 | $198B |
|
||
| Engineering / Construction | 4 | $72B |
|
||
| Energy Services | 3 | $60B |
|
||
| Utilities | 3 | $41B |
|
||
| Healthcare | 2 | $330B |
|
||
Price history
+0.0% since first listed3 events — show timeline
- 2026-02-26 Listed $110,000 PBBOR
- 2026-02-26 Listed $110,000 ODMLS
- 2015-02-24 Sold (Public Records) — Public Records
Property tax history
-0.1%/yrLatest (2025): $933 · -5.2% YoY. Source: county tax records.
Cash-flow waterfall
monthlySold comps — $/sqft
last 12 mo · ≤1 miLoading sold comps…