209 NW Gilliland Rd · Warrington, FL
Flood risk 1/10 · Minimal
- FEMA flood zone
- X (unshaded)
- Chance of flooding over 30 yrs
- 0.0%
- Est. flood insurance / yr
- $507 – $1,088
Fire risk 3/10 · Minor
- Est. fire insurance / yr
- $947 – $1,759
Heat risk 10/10 · Severe
- Hot days now (above 105°F)
- 7 days/yr
- Hot days in 30 yrs
- 24 days/yr
Wind risk 9/10 · Severe
- Chance of severe wind over 30 yrs
- 99.0%
Air-quality risk 1/10 · Minimal
- Unhealthy air days now
- 0 days/yr
- Unhealthy air days in 30 yrs
- 0 days/yr
Risk factors via First Street. Map © Google.
Why this score? — see what drove the B- grade
The composite is a weighted blend of 9 inputs, each scored 0–100. Each bar is that input's sub-score; the figure is the points it added to the 100-point composite (weight × sub-score).
- Cash flow +30.0/30.0
- 1% rule +10.0/10.0
- DSCR +10.0/10.0
- ARV discount +7.5/15.0
- Schools +3.6/10.0
- Livability +3.2/5.0
- Rent growth +2.8/5.0
- Condition / age +2.5/5.0
- Appreciation +0.0/10.0
$110,000
🖨 Deal sheet (PDF) 📄 Offer letter ✓ Due diligence
Listing remarks
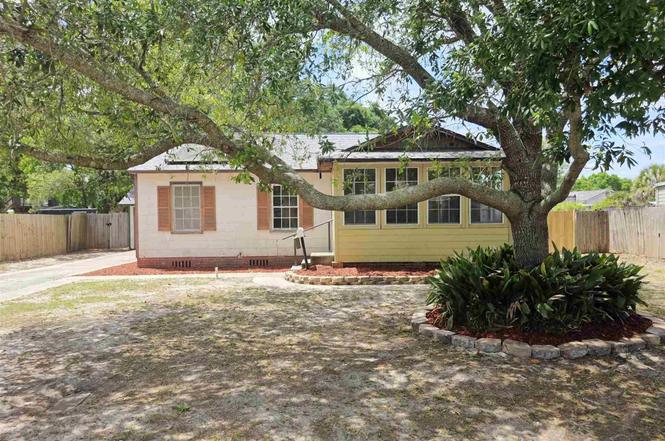
Located in Pensacola's Navy Point neighborhood, this 3 bedroom, 1 full bath cottage is ready for a new owner. Spacious living room and large eat-in kitchen are the heart of the home. French doors open to the back porch and fenced backyard. There is a detached 1 car garage and an additional storage shed. This popular neighborhood features a public boat launch and the scenic waterfront walking trails of Navy Point Park. Navy Point Park is one of Pensacola’s largest waterfront parks complete with a boat ramp, jogging path, playground, and access to Bayou Grande—perfect for boating, kayaking, and enjoying the outdoors. No HOA. Conveniently located just 4 miles from NAS Pensacola and
Key facts
- Jogging path
- Public boat launch
- Fenced backyard
Tags
Property features AI
Finance
- HOA & community: No association
Exterior
- Parking: Attached garage (1 covered/garage space); Front entrance parking
- Utilities: Public water; Septic tank sewer; Electric with circuit breakers
- Home design: Single-story home; Resale property; Not attached to another property; Paved, county-maintained road access
- Construction: Frame construction; Shingle roof; Off-grade foundation; Built as a one-level structure
- Exterior features: Covered porch; Back yard fencing; Yard building (outbuilding); Solar energy generation
Interior
- Kitchen: Pantry; Electric water heater (appliance noted)
- Bedrooms: Three bedrooms, all on the first floor
- Flooring: Hardwood
- Bathrooms: One full bathroom
- Heating & cooling: Central heating; Central air; Ceiling fans
- Interior features: Hardwood flooring; Kitchen/Dining combo; Pantry
- Laundry & utility: Indoor laundry with washer/dryer hookups
Neighborhood map
What this means for you Summary
Snapshot
- This is a 3-bed/1.0-bath single-family listed at $110k.
Deal economics
- At list price, monthly cash flow is $853 ($10k/yr) — positive.
- The deal already cash-flows at list — no discount required.
- Meets the 1% rule at list price ($2k rent vs $110k).
- Cap rate 15.6% vs local median 4.3% in Warrington — top-decile yield for the area; either an underpriced asset or a hidden risk that comps aren't pricing in. Stress-test before assuming the spread holds.
Location & tenants
- Location reads 65/100 on livability (#631 in FL) — a middle-class / working-renter tenant base. Strengths: cost of living A+, housing A+; Watch: amenities F, commute F, employment F.
- Escambia (suburban): math 40% / reading 45% proficiency, ranked #56 of 73 in FL (top 77%) — families likely to look elsewhere, expect single-tenant / working-renter base with shorter leases.
- Zoned schools: Navy Point Elementary School (math 27% / reading 37%, grade F, #1,797 of 2,144 statewide, top 86%, 430 students, 66% FRL); Jim C. Bailey Middle School (math 38% / reading 39%, grade F, #384 of 571 statewide, top 68%, 1,159 students, 57% FRL); Pensacola High School (math 29% / reading 50%, grade F, #304 of 667 statewide, top 47%, 1,229 students, 55% FRL) — zoned schools at 59% FRL track the district average.
- Market conditions: Rents rising (+1.2%/yr); 701 active listings in the ZIP; 17 comparable units currently listed for rent nearby; rentals at typical pace (median 26d on market — plan ~3-4 weeks tenant-placement turnaround); 1,479 units permitted in Escambia County in 2024 (0 in 5+ unit buildings).
- This rent runs 31% of the median local income ($74k/yr) — at the standard rent-burdened threshold; future hikes will face affordability resistance.
Forward outlook
- Local home prices are declining (-3.0%/yr); year-one equity from $761 of loan paydown is wiped out by about $3k of value loss. Plan a longer hold.
- Escambia County population projected at +13% by 2050 — modest demand growth; plan on rents tracking national, not racing it.
- At projected returns (-3.0% appreciation + 1.2% rent growth), your $31k cash investment doubles in ~4 years — after that, you're playing with house money.
Negotiation context
- Only 3 days on market — expect competitive offers; lowballing is unlikely to land.
- 3 sale attempts since 17y ago with the ask held roughly flat each time — persistent listings suggest the price (not the market) is what's stuck; bring a comps-based counter.
- Current owner paid $48k; list at $110k implies a 127% gain — meaningful room to come down on a strong offer.
Risks & watch-outs
- Watch-outs: built in 1943 — expect roof / HVAC / electrical / plumbing capex.
- Climate carrying-cost: severe wind risk, 99% chance of damaging wind over 30y; extreme-heat days projected 7→24/yr by 2055 (HVAC capex compounding) — expect insurance premiums to compound above CPI over the hold.
Questions for the listing agent
- Built in 1943 — when were the roof, HVAC, electrical panel, plumbing, and water heater last replaced?
- Is there a deadline driving the sale (1031 exchange, divorce, estate, relocation)? That informs how much negotiation room exists.
- Schools are D-rated, which usually means shorter tenancies and higher turnover. Who's the typical renter profile here, and what's been the actual vacancy rate?
- What's the average days-on-market for RENTAL listings here right now (not sales)? A rising rental-DOM trend means longer vacancies and softer asking-rent achievability than the comps imply.
- What's the recent tenant-quality profile in this submarket — average credit score on applications, eviction rate, late-payment / NSF rate, and stable-employment percentage? A property-management company in the area should have these aggregated.
- How much new for-sale + rental construction is in the pipeline within 1–3 miles? Heavy new supply typically softens prices + rents 12–24 months out; constrained supply supports both.
Investment metrics
- 1% rule
- 1.72% ✓
- Cap rate
- 15.60%
- Cash-on-cash
- 33.23%
- DSCR
- 2.48
- GRM
- 4.8
CMA / ARV
- ARV (on-the-fly)
- $248,430
- Comps found
- 12
Show comp detail 12 sales within ~0.75 mi
| Address | Dist | Beds/Ba | Sqft | Sold | Price | $/sf | Match |
|---|---|---|---|---|---|---|---|
| 121 NW Gilliland Rd | 0.05mi | 3/1.0 | 1,307 (+3%) | 8mo | $255,000 | $195 | 87 |
| 311 Flannan Rd | 0.25mi | 3/2.0 | 1,256 (-1%) | 2mo | $265,000 | $211 | 80 |
| 316 W Sunset Ave | 0.20mi | 3/1.0 | 1,200 (-6%) | 3mo | $100,000 | $83 | 78 |
| 219 Greve Rd | 0.39mi | 4/2.0 (+1) | 1,272 (-0%) | 1mo | $167,000 | $131 | 72 |
| 213 Bryant Rd | 0.42mi | 4/1.0 (+1) | 1,187 (-7%) | 4mo | $165,000 | $139 | 60 |
| 327 Gibbs Rd | 0.26mi | 2/2.0 (-1) | 1,382 (+8%) | 5mo | $299,000 | $216 | 60 |
| 648 Polk Ave | 0.32mi | 3/2.0 | 1,431 (+12%) | 4mo | $245,000 | $171 | 58 |
| 1002 Polk Ave | 0.58mi | 3/2.0 | 1,218 (-4%) | 7mo | $247,500 | $203 | 56 |
| 1261 Hawthorn Dr | 0.68mi | 4/2.0 (+1) | 1,264 (-1%) | 3mo | $206,000 | $163 | 56 |
| 1001 Decatur Ave | 0.74mi | 4/2.0 (+1) | 1,325 (+4%) | 3mo | $141,000 | $106 | 47 |
| 203 Baublits Dr | 0.56mi | 3/2.0 | 1,400 (+10%) | 7mo | $298,000 | $213 | 47 |
| 306 SE Kalash Rd | 0.62mi | 3/2.0 | 1,112 (-13%) | 5mo | $249,900 | $225 | 42 |
Match score weights: distance 35% · size 25% · config 20% · recency 20%. Top-matched comps best support the ARV.
Projected returns pro-forma
-3.0% appreciation · 1.22% rent growth · sell at horizon
- IRR
- 26.5%
- Equity multiple
- 2.08×
- Total profit
- $33,127
- Equity at exit
- $16,401
- IRR
- 33.1%
- Equity multiple
- 3.77×
- Total profit
- $85,438
- Equity at exit
- $9,511
Cash invested: $30,800 (down + closing). Projections, not guarantees.
Landlord ↔ Tenant lean methodology
- Overall (STATE)
- 87 Strongly Landlord-Friendly
- State Florida
- 87 Strongly Landlord-Friendly · R+3
- County
- — inherits STATE
- City
- — inherits STATE
ZIP-level market 32507
- Home prices YoY
- -4.6%
- Rents YoY
- 1.2%
- Active inventory
- 701
- Price-to-rent
- 4.8×
Monthly cashflow live
- Estimated rent
- $1,892 high interval (Pro) →
- Mortgage (P&I)
- −$577
- Tax from tax record
- −$19 /mo · $227/yr
- Insurance
- −$46
- HOA
- −$0
- Vacancy / Maint / Mgmt
- −$397
- Net cashflow
- $853
Break-even live
Sensitivity live
| Price | -10% $915 | -5% $884 | +0% $853 | +5% $696 | +10% $658 |
|---|---|---|---|---|---|
| Rent | -10% $704 | -5% $778 | +0% $853 | +5% $928 | +10% $1,002 |
| Rate | -1.0pp $908 | -0.5pp $881 | base $853 | +0.5pp $824 | +1.0pp $795 |
UW: 25.0% down · 7.5% · 30yr · 1.5% tax · 5.0% vac · 8.0% maint · 8.0% mgmt
Financing live
Cash to close
- Down payment
- $27,500
- Closing costs
- $3,300
- Reserves months
- —
- Total cash needed
- —
Loan-product check · same deal, 3 products live
Conventional
25% down · 7.5% · 30yr
- Down + closing
- —
- Monthly P&I
- —
- Monthly cashflow
- —
- DSCR
- —
- Eligible?
- —
Personal DTI + credit; lowest rate.
DSCR
20% down · 8.5% · 30yr
- Down + closing
- —
- Monthly P&I
- —
- Monthly cashflow
- —
- DSCR
- —
- Eligible?
- —
No personal income docs; deal must DSCR.
Hard money
10% down · 12.0% · 12mo
- Down + closing
- —
- Monthly P&I
- —
- Monthly cashflow
- —
- DSCR
- —
- Eligible?
- —
Short-term bridge; refi at stabilization.
Rent comps 17 comps
| Address | Beds | Baths | Sqft | Rent | $/sqft | DOM | Units | Dist |
|---|---|---|---|---|---|---|---|---|
| 300 Gibbs Rd Pensacola, FL | 3.0 | 2.5 | 1377 | $1,999 | $1.45 | 25d | 1 | 0.11mi |
| 103 NW Kalash Rd Pensacola, FL | 2.0 | 1.0 | 1250 | $1,400 | $1.12 | 25d | 1 | 0.28mi |
| 206 Berry Rd Pensacola, FL | 3.0 | 2.0 | 1488 | $2,000 | $1.34 | 25d | 1 | 0.31mi |
| 1306 Leeway Dr Pensacola, FL | 3.0 | 2.5 | 1537 | $1,800 | $1.17 | 25d | 1 | 0.31mi |
| 1306 Leeway Dr Pensacola, FL | 3.0 | 2.0 | 1550 | $1,750 | $1.13 | 16d | 1 | 0.31mi |
| 1308 Leeway Dr Pensacola, FL | 3.0 | 2.5 | 1537 | $1,950 | $1.27 | 25d | 1 | 0.31mi |
| 1401 Maritime Dr Pensacola, FL | 3.0 | 2.5 | 1553 | $1,750 | $1.13 | 16d | 1 | 0.32mi |
| 1405 Maritime Dr Pensacola, FL | 3.0 | 2.5 | 1537 | $1,800 | $1.17 | 25d | 1 | 0.32mi |
| 102 SE Kalash Rd Pensacola, FL | 4.0 | 2.0 | 1029 | $1,800 | $1.75 | 25d | 1 | 0.35mi |
| 727 Bremen Ave Pensacola, FL | 3.0 | 2.0 | 1512 | $1,650 | $1.09 | 23d | 1 | 0.82mi |
| 45 W Carver Dr Pensacola, FL | 3.0 | 1.0 | 940 | $1,325 | $1.41 | 25d | 1 | 1.01mi |
| 210 S 2nd St Pensacola, FL | 3.0 | 2.0 | 1232 | $1,900 | $1.54 | 25d | 1 | 1.01mi |
| 7 Mindoro Cir Pensacola, FL | 3.0 | 1.0 | 924 | $1,395 | $1.51 | 25d | 1 | 1.06mi |
| 99 S 3rd St Unit 3 Pensacola, FL | 2.0 | 1.5 | 900 | $1,259 | $1.40 | 25d | 1 | 1.09mi |
| 405 E Palmetto Ave Pensacola, FL | 2.0 | 1.0 | 900 | $1,800 | $2.00 | 25d | 1 | 1.20mi |
| 570 Quigley Rd Pensacola, FL | 3.0 | 2.0 | 1190 | $1,525 | $1.28 | 25d | 1 | 1.33mi |
| 1120 S Old Corry Field Rd Pensacola, FL | 3.0 | 1.0 | 1000 | $1,295 | $1.29 | 25d | 1 | 1.39mi |
Listing history 3 events
-
2026-06-21days on market $110,000 Active 3 DOM
-
2026-06-19remarks 687-char remark
-
2026-06-19$110,000 Active 1 DOM
ⓘ Source: listings_history table (triggers on properties + properties_extension) + one-shot
backfill from property_details.listing_events for pre-trigger history.
Tax reassessment forecast FL · Resets to sale price
- Current annual tax
- $227 · $19/mo
- Projected year-2 tax
- $913 · $76/mo
- Expected delta
- +$686/yr (+$57/mo · 302.6%)
ⓘ Screening estimate from a state-policy table — verify with the county assessor before closing.
Climate risk First Street
- Flood 1/10 Low FEMA zone X (unshaded) · 0% chance over 30 yrs
- Wildfire 3/10 Moderate
- Heat 10/10 Extreme 7 d/yr ≥105°F today · 24 d/yr by 30 yrs out
- Wind 9/10 Extreme 99% chance of damaging wind over 30 yrs
- Air quality 1/10 Low 0 unhealthy d/yr today · 0 by 30 yrs out
Nearby sold comps map
Loading sold comps map…
Walkable amenities ~0.75 mi
Loading nearby amenities…
Taxation est. · year 1
- Rental income
- $22,702
- − Mortgage interest
- −$6,162
- − Property taxes
- −$227
- − Insurance
- −$550
- − Repairs & maintenance
- −$1,816
- − Management
- −$1,816
- − Depreciation
- −$3,200
- Taxable income
- $8,931
- Est. tax owed @ 24.0%
- −$2,143
- After-tax cash flow
- $8,092/yr
For passive investors: Depreciation is non-cash, so a rental often shows a tax loss while cash-flowing — sheltering income. Rental losses are passive: they offset passive income freely, and up to $25,000/yr can offset ordinary (W-2) income if you actively participate and your MAGI is under $100k (phasing out to $0 by $150k); unused losses carry forward. On sale, claimed depreciation is recaptured at up to 25%, and gains may owe capital-gains tax (a 1031 exchange can defer both). Figures are a year-1 estimate at your 24.0% rate — not tax advice; consult a CPA.
Schools (NCES district)
- District
- Escambia
- NCES district ID
- 1200510
- Math proficiency
- 40% ▼ -9.00%
- Reading proficiency
- 45% ▼ -4.00%
- Median HH income
- $44,649
- Composite
- 36.04/100
- National rank
- #4773
- State rank
- #56 of 73 in FL
Livability — Warrington
- Score
- 65/100
- State rank
- #631
- US rank
- #12396
Category grades
Schools grade is shown separately in the Schools card above.
Census & demographics
- Census place
- Warrington, FL
- County
- Escambia County · 301,722 people
- Metro
- Pensacola-Ferry Pass-Brent, FL
- Population (ZIP)
- 32,226
- Household income
- $73,540
- Rent vs Own
- Severe rent burden
- 1175.0
Population outlook (Escambia County) Hauer SSP2
- Today (2025)
- 334,637 people
- By 2030
- 345,779 · +3.3%
- By 2040
- 364,828 · +9.0%
- By 2050
- 378,514 · +13.1%
- By 2075
- 403,220 · +20.5%
- By 2100
- 386,125 · +15.4%
Race, ethnicity, and origin ACS 2023
- Neighborhood character
- Predominantly White (73%)
- Race & ethnicity
- White 73% Black 10% Two or more races 10% Hispanic / Latino 7% Asian 2%
- Hispanic origin (detail)
- Mexican 3% Puerto Rican 2%
- Common ancestry
- Slovak 3% Lithuanian 2% Romanian 2%
- Foreign-born
- 5% · Canada, Vietnam
- Languages at home
- 92% English-only · Spanish 4% Other Asian/Pacific 1% French/Haitian/Cajun 1%
Political lean MEDSL · Escambia
- 2024 margin
- R (+19.5) · D 39.7% · R 59.2% · Other 1.1%
- 2008→2024 swing
- -0.2pp no change · 2008: -19.3pp · 2024: -19.5pp
- All cycles
- 2024: R+19.5 2020: R+15.1 2016: R+20.6 2012: R+20.6 2008: R+19.3
Not yet ingested
- Civics
- —
Market trends
- HPI YoY
- ▼ -26.23%
- Current HPI
- 548.03
- Rent YoY
- ▲ 1.22%
- Metro
- Pensacola-Ferry Pass-Brent, FL
- State GDP YoY
- ▲ 3.28%
- F500 in state
- 36
Industry mix (Fortune 500 HQ in FL)
| Industry | F500 HQs | Revenue |
|---|---|---|
| Industrial Technology | 2 | $29B |
|
||
| Insurance | 2 | $17B |
|
||
| Retail | 1 | $60B |
|
||
| Technology Distribution | 1 | $58B |
|
||
| Homebuilding | 1 | $35B |
|
||
| Technology Manufacturing | 1 | $35B |
|
||
Price history
+201.4% since first listed7 events — show timeline
- 2026-06-18 Listed $110,000 PARMLS
- 2026-03-20 Listing Removed — PARMLS
- 2026-03-01 Listed $223,000 PARMLS
- 2009-12-29 Listing Removed — PARMLS
- 2009-11-02 Listed $75,000 PARMLS
- 1998-05-05 Sold (Public Records) $48,500 Public Records
- 1993-10-01 Sold (Public Records) $36,500 Public Records
Property tax history
+9.8%/yrLatest (2025): $227 · +80.9% YoY. Source: county tax records.
Cash-flow waterfall
monthlySold comps — $/sqft
last 12 mo · ≤1 miLoading sold comps…