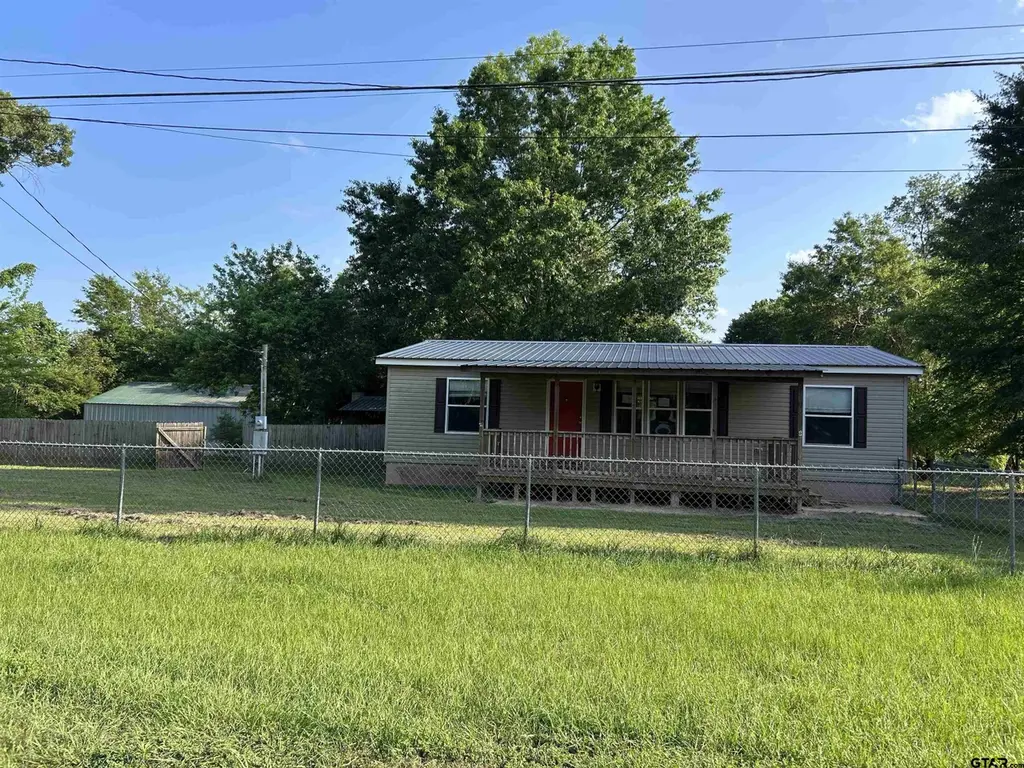
20634 Tomahawk Dr · Sunrise Shores, TX
Flood risk 1/10 · Minimal
- FEMA flood zone
- X (unshaded)
- Chance of flooding over 30 yrs
- 0.0%
- Est. flood insurance / yr
- $507 – $1,088
Fire risk 4/10 · Minor
- Est. fire insurance / yr
- $1,222 – $2,270
Heat risk 7/10 · Major
- Hot days now (above 109°F)
- 7 days/yr
- Hot days in 30 yrs
- 26 days/yr
Wind risk 6/10 · Moderate
- Chance of severe wind over 30 yrs
- 67.0%
Air-quality risk 1/10 · Minimal
- Unhealthy air days now
- 0 days/yr
- Unhealthy air days in 30 yrs
- 0 days/yr
Risk factors via First Street. Map © Google.
Why this score? — see what drove the B grade
The composite is a weighted blend of 9 inputs, each scored 0–100. Each bar is that input's sub-score; the figure is the points it added to the 100-point composite (weight × sub-score).
- Cash flow +26.4/30.0
- ARV discount +15.0/15.0
- 1% rule +9.9/10.0
- DSCR +9.0/10.0
- Schools +3.7/10.0
- Rent growth +2.5/5.0
- Livability +2.5/5.0
- Condition / age +2.5/5.0
- Appreciation +0.0/10.0
$100,500
🖨 Deal sheet (PDF) 📄 Offer letter ✓ Due diligence
Listing remarks MLS
Charming 3-bed, 2-bathroom home situated in close proximity to Lake Palestine. On over . 8 acres at the end of the street with no through traffic, as well as a 40' x 30' shop/barn and a 23' x 20' patio, this home allows for ample opportunities for outdoor recreation. This well-maintained home features comfortable bedrooms, spacious living areas, and a fully equipped kitchen. The backyard is a perfect space for hosting gatherings as the outdoor patio features a large fireplace with electricity already installed. With its convenient location, comfortable interior, and inviting outdoor spaces, 20634 Tomahawk Dr is a must-see for anyone looking for their next home.
Key facts
- Quiet street
- No through traffic
- Generous lot
Tags
Property features AI
Exterior
- Security: Smoke detector(s)
- Home design: Single family detached residence; 1 story
- Construction: Aluminum siding; Vinyl siding; Composition roof
- Exterior features: Deck; Porch; Chain link fencing; Lake frontage on Lake Palestine; Storage structure
Interior
- Kitchen: Electric oven; Electric range
- Bathrooms: 2 full bathrooms
- Heating & cooling: Central heating (electric); Central air; Ceiling fan(s)
- Interior features: Electric oven; Electric range; Ceiling fans; Central heating and air; Smoke detectors
Neighborhood map
What this means for you Summary
Snapshot
- This is a 3-bed/2.0-bath single-family listed at $100k.
Deal economics
- At list price, monthly cash flow is $264 ($3k/yr) — positive.
- The deal already cash-flows at list — no discount required.
- Meets the 1% rule at list price ($1k rent vs $100k).
- Recommended offer: $97k (3.0% below list) — sets the bar for market timing.
- Cap rate 9.4% vs local median 4.1% in Sunrise Shores — top-decile yield for the area; either an underpriced asset or a hidden risk that comps aren't pricing in. Stress-test before assuming the spread holds.
Location & tenants
- Location reads: area grade B — affects rentability + tenant quality, not the cash-flow math above.
- Brownsboro ISD (rural): math 42% / reading 46% proficiency, ranked #290 of 826 in TX (top 35%) — families likely to look elsewhere, expect single-tenant / working-renter base with shorter leases.
- Zoned schools: Chandler El (math 42% / reading 37%, grade F, #1,545 of 4,322 statewide, top 38%, 450 students, 74% FRL); Chandler Int (math 39% / reading 35%, grade F, #756 of 1,662 statewide, top 47%, 253 students, 70% FRL); Brownsboro H S (math 31% / reading 63%, grade D-, #591 of 1,632 statewide, top 38%, 757 students, 50% FRL).
- Market conditions: 228 active listings in the ZIP; 263 units permitted in Henderson County in 2024 (0 in 5+ unit buildings).
Forward outlook
- Local home prices are declining (-3.0%/yr); year-one equity from $695 of loan paydown is wiped out by about $3k of value loss. Plan a longer hold.
- At projected returns (-3.0% appreciation + 3.0% rent growth), your $28k cash investment doubles in ~10 years — after that, you're playing with house money.
Negotiation context
- It's been on market 45 days — a 3% lower offer ($97k) is reasonable based on typical stale-listing flexibility.
- 2 sale attempts since 3y ago; this cycle's ask has dropped $14k (13%) from the opening price — seller is motivated, your offer sets the floor, not the list.
Risks & watch-outs
- Watch-outs: property tax is 4.2% of price.
- Climate carrying-cost: major wind risk, 67% chance of damaging wind over 30y; extreme-heat days projected 7→26/yr by 2055 (HVAC capex compounding) — expect insurance premiums to compound above CPI over the hold.
Questions for the listing agent
- It's been on market 45 days. Have you received any prior offers? Is the seller open to a 3% concession, seller financing, or rate buy-down credit?
- Property tax is high relative to price — has the assessment been appealed recently, and will the sale trigger a re-assessment?
- Is there a deadline driving the sale (1031 exchange, divorce, estate, relocation)? That informs how much negotiation room exists.
- What's the average days-on-market for RENTAL listings here right now (not sales)? A rising rental-DOM trend means longer vacancies and softer asking-rent achievability than the comps imply.
- What's the recent tenant-quality profile in this submarket — average credit score on applications, eviction rate, late-payment / NSF rate, and stable-employment percentage? A property-management company in the area should have these aggregated.
- How much new for-sale + rental construction is in the pipeline within 1–3 miles? Heavy new supply typically softens prices + rents 12–24 months out; constrained supply supports both.
Investment metrics
- 1% rule
- 1.49% ✓
- Cap rate
- 9.44%
- Cash-on-cash
- 11.25%
- DSCR
- 1.50
- GRM
- 5.6
CMA / ARV
- ARV (median comp)
- $173,497
- List price
- $100,500
- Delta
- -42.07%
- Verdict
- UNDERPRICED
- Comps
- 4 within 1.0 mi
Show comp detail 1 sale within ~0.75 mi
| Address | Dist | Beds/Ba | Sqft | Sold | Price | $/sf | Match |
|---|---|---|---|---|---|---|---|
| 5132 Skyline Dr | 0.11mi | 3/2.5 | 1,500 (+14%) | 6mo | $195,000 | $130 | 65 |
Match score weights: distance 35% · size 25% · config 20% · recency 20%. Top-matched comps best support the ARV.
Projected returns pro-forma
-3.0% appreciation · 3.0% rent growth · sell at horizon
- IRR
- 0.6%
- Equity multiple
- 1.02×
- Total profit
- $672
- Equity at exit
- $14,985
- IRR
- 10.4%
- Equity multiple
- 1.81×
- Total profit
- $22,869
- Equity at exit
- $8,689
Cash invested: $28,140 (down + closing). Projections, not guarantees.
Landlord ↔ Tenant lean methodology
- Overall (STATE)
- 87 Strongly Landlord-Friendly
- State Texas
- 87 Strongly Landlord-Friendly · R+5
- County
- — inherits STATE
- City
- — inherits STATE
ZIP-level market 75758
- Home prices YoY
- -27.6%
- Active inventory
- 228
- Price-to-rent
- 5.6×
Monthly cashflow live
- Estimated rent
- $1,499 medium interval (Pro) →
- Mortgage (P&I)
- −$527
- Tax from tax record
- −$352 /mo · $4,223/yr
- Insurance
- −$42
- HOA
- −$0
- Vacancy / Maint / Mgmt
- −$315
- Net cashflow
- $264
Break-even live
Sensitivity live
| Price | -10% $321 | -5% $292 | +0% $264 | +5% $235 | +10% $207 |
|---|---|---|---|---|---|
| Rent | -10% $145 | -5% $204 | +0% $264 | +5% $323 | +10% $382 |
| Rate | -1.0pp $314 | -0.5pp $289 | base $264 | +0.5pp $238 | +1.0pp $211 |
UW: 25.0% down · 7.5% · 30yr · 1.5% tax · 5.0% vac · 8.0% maint · 8.0% mgmt
Financing live
Cash to close
- Down payment
- $25,125
- Closing costs
- $3,015
- Reserves months
- —
- Total cash needed
- —
Loan-product check · same deal, 3 products live
Conventional
25% down · 7.5% · 30yr
- Down + closing
- —
- Monthly P&I
- —
- Monthly cashflow
- —
- DSCR
- —
- Eligible?
- —
Personal DTI + credit; lowest rate.
DSCR
20% down · 8.5% · 30yr
- Down + closing
- —
- Monthly P&I
- —
- Monthly cashflow
- —
- DSCR
- —
- Eligible?
- —
No personal income docs; deal must DSCR.
Hard money
10% down · 12.0% · 12mo
- Down + closing
- —
- Monthly P&I
- —
- Monthly cashflow
- —
- DSCR
- —
- Eligible?
- —
Short-term bridge; refi at stabilization.
Listing history 23 events
-
2026-06-21days on market $100,500 Active 45 DOM
-
2026-06-19days on market $100,500 Active 43 DOM
-
2026-06-18days on market $100,500 Active 42 DOM
-
2026-06-17days on market $100,500 Active 41 DOM
-
2026-06-16days on market $100,500 Active 40 DOM
-
2026-06-15days on market $100,500 Active 39 DOM
-
2026-06-14days on market $100,500 Active 37 DOM
-
2026-06-13days on market $100,500 Active 36 DOM
-
2026-06-10pricedays on market $100,500 Active 34 DOM
-
2026-06-09days on market $115,000 Active 33 DOM
-
2026-06-08days on market $115,000 Active 32 DOM
-
2026-06-07days on market $115,000 Active 31 DOM
-
2026-06-02days on market $115,000 Active 26 DOM
-
2026-06-01days on market $115,000 Active 25 DOM
-
2026-05-31days on market $115,000 Active 24 DOM
-
2026-05-30days on market $115,000 Active 23 DOM
-
2026-05-07$115,000 Active 318-char remark
-
2024-02-14soldstatus
-
2023-04-05soldstatus 669-char remark
Show marketing remark (669 chars)
Charming 3-bed, 2-bathroom home situated in close proximity to Lake Palestine. On over . 8 acres at the end of the street with no through traffic, as well as a 40' x 30' shop/barn and a 23' x 20' patio, this home allows for ample opportunities for outdoor recreation. This well-maintained home features comfortable bedrooms, spacious living areas, and a fully equipped kitchen. The backyard is a perfect space for hosting gatherings as the outdoor patio features a large fireplace with electricity already installed. With its convenient location, comfortable interior, and inviting outdoor spaces, 20634 Tomahawk Dr is a must-see for anyone looking for their next home.
-
2023-04-03soldstatus
-
2023-02-13$205,000 669-char remark
Show marketing remark (669 chars)
Charming 3-bed, 2-bathroom home situated in close proximity to Lake Palestine. On over . 8 acres at the end of the street with no through traffic, as well as a 40' x 30' shop/barn and a 23' x 20' patio, this home allows for ample opportunities for outdoor recreation. This well-maintained home features comfortable bedrooms, spacious living areas, and a fully equipped kitchen. The backyard is a perfect space for hosting gatherings as the outdoor patio features a large fireplace with electricity already installed. With its convenient location, comfortable interior, and inviting outdoor spaces, 20634 Tomahawk Dr is a must-see for anyone looking for their next home.
-
2005-10-10soldstatus
-
1982-12-31soldstatus
ⓘ Source: listings_history table (triggers on properties + properties_extension) + one-shot
backfill from property_details.listing_events for pre-trigger history.
Tax reassessment forecast TX · Resets to sale price
- Current annual tax
- $4,223 · $352/mo
- Projected year-2 tax
- $4,223 · $352/mo
- Expected delta
- $0/yr ($0/mo · 0.0%)
ⓘ Screening estimate from a state-policy table — verify with the county assessor before closing.
Climate risk First Street
- Flood 1/10 Low FEMA zone X (unshaded) · 0% chance over 30 yrs
- Wildfire 4/10 Moderate
- Heat 7/10 Severe 7 d/yr ≥109°F today · 26 d/yr by 30 yrs out
- Wind 6/10 Major 67% chance of damaging wind over 30 yrs
- Air quality 1/10 Low 0 unhealthy d/yr today · 0 by 30 yrs out
Nearby sold comps map
Loading sold comps map…
Walkable amenities ~0.75 mi
Loading nearby amenities…
Taxation est. · year 1
- Rental income
- $17,993
- − Mortgage interest
- −$5,630
- − Property taxes
- −$4,223
- − Insurance
- −$502
- − Repairs & maintenance
- −$1,439
- − Management
- −$1,439
- − Depreciation
- −$2,924
- Taxable income
- $1,835
- Est. tax owed @ 24.0%
- −$440
- After-tax cash flow
- $2,724/yr
For passive investors: Depreciation is non-cash, so a rental often shows a tax loss while cash-flowing — sheltering income. Rental losses are passive: they offset passive income freely, and up to $25,000/yr can offset ordinary (W-2) income if you actively participate and your MAGI is under $100k (phasing out to $0 by $150k); unused losses carry forward. On sale, claimed depreciation is recaptured at up to 25%, and gains may owe capital-gains tax (a 1031 exchange can defer both). Figures are a year-1 estimate at your 24.0% rate — not tax advice; consult a CPA.
Schools (NCES district)
- District
- Brownsboro ISD
- NCES district ID
- 4811640
- Math proficiency
- 42% ▼ -5.00%
- Reading proficiency
- 46% ▬ 0.00%
- Median HH income
- $45,624
- Composite
- 37.38/100
- National rank
- #4429
- State rank
- #290 of 826 in TX
Livability — Sunrise Shores
No livability data for this city. (Only ~50 U.S. cities are tracked.)
Census & demographics
- Population (ZIP)
- 10,357
Population outlook (Henderson County) Hauer SSP2
- Today (2025)
- 80,471 people
- By 2030
- 80,608 · +0.2%
- By 2040
- 80,087 · -0.5%
- By 2050
- 78,208 · -2.8%
- By 2075
- 72,423 · -10.0%
- By 2100
- 61,012 · -24.2%
Race, ethnicity, and origin ACS 2023
- Neighborhood character
- Predominantly White (79%)
- Race & ethnicity
- White 79% Hispanic / Latino 16% Two or more races 9% Black 2%
- Hispanic origin (detail)
- Mexican 14%
- Common ancestry
- Slovak 3% Serbian 2% Romanian 1%
- Foreign-born
- 5% · Canada, Vietnam
- Languages at home
- 91% English-only · Spanish 8% Other Indo-European 1%
Political lean MEDSL · Henderson
- 2024 margin
- Solid R (+63.5) · D 18.0% · R 81.4%
- 2008→2024 swing
- -18.8pp toward R · 2008: -44.6pp · 2024: -63.5pp
- All cycles
- 2024: R+63.5 2020: R+60.2 2016: R+60.0 2012: R+54.8 2008: R+44.6
Not yet ingested
- Civics
- —
Market trends
- HPI YoY
- ▼ -73.16%
- Current HPI
- 192.0837
- Rent YoY
- —
- Metro
- —
- State GDP YoY
- ▲ 3.95%
- F500 in state
- 110
Industry mix (Fortune 500 HQ in TX)
| Industry | F500 HQs | Revenue |
|---|---|---|
| Energy | 16 | $1,198B |
|
||
| Technology | 5 | $198B |
|
||
| Engineering / Construction | 4 | $72B |
|
||
| Energy Services | 3 | $60B |
|
||
| Utilities | 3 | $41B |
|
||
| Healthcare | 2 | $330B |
|
||
Price history
-51.0% since first listed8 events — show timeline
- 2026-06-09 Price Changed $100,500 GTAR
- 2026-05-07 Listed $115,000 GTAR
- 2024-02-14 Sold (Public Records) — Public Records
- 2023-04-05 Sold (MLS) — GTAR
- 2023-04-03 Sold (Public Records) — Public Records
- 2023-02-13 Listed $205,000 GTAR
- 2005-10-10 Sold (Public Records) — Public Records
- 1982-12-31 Sold (Public Records) — Public Records
Property tax history
+8.3%/yrLatest (2025): $4,223 · +4.4% YoY. Source: county tax records.
Cash-flow waterfall
monthlySold comps — $/sqft
last 12 mo · ≤1 miLoading sold comps…