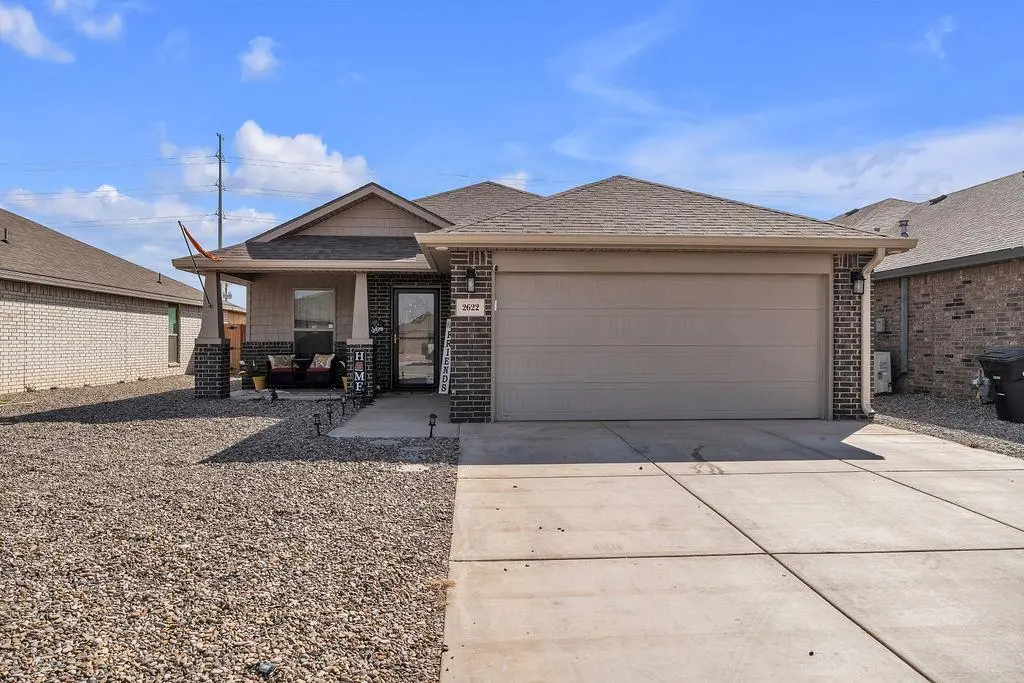
2622 Ranch Ave · Midland, TX
Flood risk 1/10 · Minimal
- FEMA flood zone
- —
- Chance of flooding over 30 yrs
- 0.0%
- Est. flood insurance / yr
- —
Fire risk 5/10 · Moderate
- Est. fire insurance / yr
- $1,222 – $2,270
Heat risk 6/10 · Moderate
- Hot days now (above 102°F)
- 7 days/yr
- Hot days in 30 yrs
- 22 days/yr
Wind risk 3/10 · Minor
- Chance of severe wind over 30 yrs
- 6.0%
Air-quality risk 1/10 · Minimal
- Unhealthy air days now
- 0 days/yr
- Unhealthy air days in 30 yrs
- 0 days/yr
Risk factors via First Street. Map © Google.
Why this score? — see what drove the D grade
The composite is a weighted blend of 9 inputs, each scored 0–100. Each bar is that input's sub-score; the figure is the points it added to the 100-point composite (weight × sub-score).
- Cash flow +12.2/30.0
- ARV discount +7.5/15.0
- Livability +4.0/5.0
- Condition / age +4.0/5.0
- DSCR +3.6/10.0
- 1% rule +3.3/10.0
- Schools +3.2/10.0
- Rent growth +3.1/5.0
- Appreciation +0.0/10.0
$297,000
🖨 Deal sheet (PDF) 📄 Offer letter ✓ Due diligence
Listing remarks
Step into this inviting 3-bedroom, 2-bath home built in 2021, where modern luxury meets everyday comfort. Thoughtfully designed with tile flooring throughout, elegant granite countertops, and high ceilings that enhance the warm, open feel. Enjoy easy living with a low-maintenance backyard and a beautifully xeriscaped front yard, perfect for relaxing and entertaining with minimal upkeep. This home is truly move-in ready and waiting for its new owner.
Key facts
- Tile flooring
- Granite countertops
- High ceilings
Tags
Property features AI
Exterior
- Parking: Detached or attached garage with 2 spaces
- Utilities: Public water; Public sewer
- Home design: Single family residence; Single-story
- Construction: Brick veneer exterior; Composition roof; Slab foundation; Built on 1 story
- Exterior features: Covered patio/porch; Wood fencing
Interior
- Flooring: Tile flooring
- Bathrooms: Two full bathrooms
- Heating & cooling: Central heating (natural gas); Central air conditioning; Ceiling fan(s)
- Interior features: Gas water heater; Tile flooring; Ceiling fans
Neighborhood map
What this means for you Summary
Snapshot
- This is a 3-bed/2.0-bath single-family listed at $297k. Condition is rated good.
Deal economics
- At list price, monthly cash flow is $-62 ($-744/yr) — negative.
- To cash-flow at today's rent, offer at most $286k (3.7% below list).
- To meet the 1% rule (rent ≥ 1% of price), the offer needs to be $248k (16.7% below list).
- Recommended offer: $248k (16.7% below list) — sets the bar for 1% rule.
- Cap rate 6.0% vs local median 4.7% in Midland — meaningfully above typical; check what's discounted (condition, days-on-market, listing class) to confirm the premium yield is real.
Location & tenants
- Location reads 79/100 on livability (#57 in TX, #2,192 nationally) — a middle-class / working-renter tenant base. Strengths: employment A+, housing A+, health & safety A+; Watch: crime C-, commute D+, amenities D.
- Midland ISD (urban): math 34% / reading 36% proficiency, ranked #477 of 826 in TX (top 58%) — families likely to look elsewhere, expect single-tenant / working-renter base with shorter leases.
- Zoned schools: General Tommy Franks El (math 43% / reading 46%, grade F, #1,155 of 4,322 statewide, top 29%, 825 students, 38% FRL); Goddard J H (math 23% / reading 32%, grade F, #1,156 of 1,662 statewide, top 71%, 1,024 students, 58% FRL, charter); Midland H S (math 37% / reading 7%, grade F, #1,366 of 1,632 statewide, top 84%, 2,492 students, 44% FRL) — zoned schools at 47% FRL track the district average.
- Market conditions: Rents rising (+2.6%/yr); 452 active listings in the ZIP; 29 comparable units currently listed for rent nearby; rentals at typical pace (median 23d on market — plan ~3-4 weeks tenant-placement turnaround); solid renter incomes; 1,504 units permitted in Midland County in 2024 (0 in 5+ unit buildings).
Forward outlook
- Local home prices are declining (-3.0%/yr); year-one equity from $2k of loan paydown is wiped out by about $9k of value loss. Plan a longer hold.
- Midland County population projected at +83% by 2050 — long-run rental-demand tailwind backs the buy-and-hold thesis.
Negotiation context
- It's been on market 29 days — a 2% lower offer ($293k) is reasonable based on typical stale-listing flexibility.
Risks & watch-outs
- Climate carrying-cost: moderate wildfire risk; extreme-heat days projected 7→22/yr by 2055 (HVAC capex compounding) — expect insurance premiums to compound above CPI over the hold.
Questions for the listing agent
- What do current leases actually rent for vs. the listed asking? Can we see a recent rent roll and the last 12 months of T-12 income?
- Is there a deadline driving the sale (1031 exchange, divorce, estate, relocation)? That informs how much negotiation room exists.
- The area grade is low — what's the realistic commute time and amenity access for the typical tenant pool here? Any planned neighborhood developments (good or bad) we should know about?
- What's the average days-on-market for RENTAL listings here right now (not sales)? A rising rental-DOM trend means longer vacancies and softer asking-rent achievability than the comps imply.
- What's the recent tenant-quality profile in this submarket — average credit score on applications, eviction rate, late-payment / NSF rate, and stable-employment percentage? A property-management company in the area should have these aggregated.
- How much new for-sale + rental construction is in the pipeline within 1–3 miles? Heavy new supply typically softens prices + rents 12–24 months out; constrained supply supports both.
Investment metrics
- 1% rule
- 0.83% ✗
- Cap rate
- 6.04%
- Cash-on-cash
- -0.90%
- DSCR
- 0.96
- GRM
- 10.0
CMA / ARV
No comps found within radius.
Projected returns pro-forma
-3.0% appreciation · 2.56% rent growth · sell at horizon
- IRR
- -18.3%
- Equity multiple
- 0.36×
- Total profit
- $-53,153
- Equity at exit
- $44,284
- IRR
- -11.4%
- Equity multiple
- 0.33×
- Total profit
- $-55,746
- Equity at exit
- $25,679
Cash invested: $83,160 (down + closing). Projections, not guarantees.
Landlord ↔ Tenant lean methodology
- Overall (STATE)
- 87 Strongly Landlord-Friendly
- State Texas
- 87 Strongly Landlord-Friendly · R+5
- County
- — inherits STATE
- City
- — inherits STATE
ZIP-level market 79705
- Rents YoY
- 2.6%
- Active inventory
- 452
- Price-to-rent
- 10.0×
Monthly cashflow live
- Estimated rent
- $2,475 high interval (Pro) →
- Mortgage (P&I)
- −$1,558
- Tax from tax record
- −$336 /mo · $4,034/yr
- Insurance
- −$124
- HOA
- −$0
- Vacancy / Maint / Mgmt
- −$520
- Net cashflow
- $-62
Break-even live
Sensitivity live
| Price | -10% $106 | -5% $22 | +0% $-62 | +5% $-146 | +10% $-230 |
|---|---|---|---|---|---|
| Rent | -10% $-258 | -5% $-160 | +0% $-62 | +5% $36 | +10% $133 |
| Rate | -1.0pp $88 | -0.5pp $13 | base $-62 | +0.5pp $-139 | +1.0pp $-217 |
UW: 25.0% down · 7.5% · 30yr · 1.5% tax · 5.0% vac · 8.0% maint · 8.0% mgmt
Financing live
Cash to close
- Down payment
- $74,250
- Closing costs
- $8,910
- Reserves months
- —
- Total cash needed
- —
Loan-product check · same deal, 3 products live
Conventional
25% down · 7.5% · 30yr
- Down + closing
- —
- Monthly P&I
- —
- Monthly cashflow
- —
- DSCR
- —
- Eligible?
- —
Personal DTI + credit; lowest rate.
DSCR
20% down · 8.5% · 30yr
- Down + closing
- —
- Monthly P&I
- —
- Monthly cashflow
- —
- DSCR
- —
- Eligible?
- —
No personal income docs; deal must DSCR.
Hard money
10% down · 12.0% · 12mo
- Down + closing
- —
- Monthly P&I
- —
- Monthly cashflow
- —
- DSCR
- —
- Eligible?
- —
Short-term bridge; refi at stabilization.
Rent comps 29 comps
| Address | Beds | Baths | Sqft | Rent | $/sqft | DOM | Units | Dist |
|---|---|---|---|---|---|---|---|---|
| 2703 Ranch Ave Midland, TX | 3.0 | 2.0 | 1658 | $2,350 | $1.42 | 23d | 1 | 0.04mi |
| 2702 Southwest St Midland, TX | 3.0 | 2.0 | 1844 | $2,500 | $1.36 | 45d | 1 | 0.15mi |
| 2409 Husk St Unit 1 Midland, TX | 3.0 | 2.0 | 1800 | $3,000 | $1.67 | 15d | 1 | 0.38mi |
| 6220 Kingsville St Midland, TX | 3.0 | 2.0 | 1312 | $2,400 | $1.83 | 15d | 1 | 0.51mi |
| 6109 Buckthorn Dr Midland, TX | 4.0 | 2.0 | 1655 | $2,900 | $1.75 | 23d | 1 | 0.62mi |
| 2908 Yellowhouse Ave Midland, TX | 3.0 | 2.0 | 1515 | $2,650 | $1.75 | 23d | 1 | 0.66mi |
| 2716 River Bend Rd Midland, TX | 3.0 | 2.0 | 1517 | $2,600 | $1.71 | 45d | 1 | 0.71mi |
| 5917 Praline St Midland, TX | 3.0 | 2.0 | 1251 | $2,500 | $2.00 | 23d | 1 | 0.73mi |
| 5920 Woodpecker Way Midland, TX | 3.0 | 2.0 | 1669 | $3,800 | $2.28 | 45d | 1 | 0.75mi |
| 2808 Lighthouse Rd Midland, TX | 3.0 | 2.0 | 1168 | $2,300 | $1.97 | 45d | 1 | 0.75mi |
| 6333 Poppy Dr Midland, TX | 3.0 | 2.0 | 1350 | $2,500 | $1.85 | 23d | 1 | 0.75mi |
| 6812 Brush Dr Midland, TX | 3.0 | 2.0 | 1450 | $2,500 | $1.72 | 15d | 1 | 0.78mi |
| 2912 Pitchfork Rd Midland, TX | 3.0 | 2.0 | 1119 | $2,100 | $1.88 | 23d | 1 | 0.79mi |
| 2808 Longfellow Rd Midland, TX | 3.0 | 2.0 | 1422 | $2,400 | $1.69 | 23d | 1 | 0.79mi |
| 6809 Brush Dr Midland, TX | 3.0 | 2.0 | 1466 | $2,500 | $1.71 | 15d | 1 | 0.80mi |
| 2944 Hidalgo Ave Midland, TX | 3.0 | 2.0 | 1689 | $3,800 | $2.25 | 45d | 1 | 0.84mi |
| 6011 Purtis Creek Dr Midland, TX | 4.0 | 2.0 | 1722 | $2,900 | $1.68 | 45d | 1 | 0.85mi |
| 5817 Settler Ave Midland, TX | 3.0 | 2.0 | 1421 | $2,600 | $1.83 | 45d | 1 | 0.88mi |
| 6105 Poppy Dr Midland, TX | 3.0 | 2.0 | 1421 | $2,700 | $1.90 | 45d | 1 | 0.91mi |
| 1708 Rattler Ln Midland, TX | 3.0 | 2.0 | 1694 | $2,550 | $1.51 | 45d | 1 | 0.91mi |
| 1704 Rattler Ln Midland, TX | 3.0 | 2.0 | 1498 | $2,500 | $1.67 | 23d | 1 | 0.93mi |
| 1621 Revolution Dr Midland, TX | 3.0 | 2.0 | 1504 | $2,500 | $1.66 | 45d | 1 | 0.96mi |
| 1508 Rattler Ln Midland, TX | 3.0 | 2.0 | 1578 | $2,250 | $1.43 | 15d | 1 | 1.08mi |
| 6706 Yellow Rose Ct Midland, TX | 3.0 | 2.0 | 1819 | $2,800 | $1.54 | 45d | 1 | 1.20mi |
| 1310 Wrangler Ln Midland, TX | 3.0 | 2.0 | 1387 | $2,400 | $1.73 | 23d | 1 | 1.21mi |
| 1315 Yellow Rose Ct Midland, TX | 3.0 | 2.0 | 1600 | $2,600 | $1.62 | 15d | 1 | 1.23mi |
| 6717 Brand Ln Midland, TX | 3.0 | 2.0 | 1500 | $2,400 | $1.60 | 23d | 1 | 1.29mi |
| 6309 Ojibwa Midland, TX | 3.0 | 2.0 | 1300 | $2,150 | $1.65 | 23d | 1 | 1.44mi |
| 1513 San Miguel Ct Midland, TX | 3.0 | 2.0 | 1853 | $2,400 | $1.30 | 15d | 1 | 1.46mi |
Listing history 24 events
-
2026-06-22days on market $297,000 Active 29 DOM
-
2026-06-19days on market $297,000 Active 27 DOM
-
2026-06-18days on market $297,000 Active 26 DOM
-
2026-06-17days on market $297,000 Active 25 DOM
-
2026-06-16days on market $297,000 Active 24 DOM
-
2026-06-15days on market $297,000 Active 23 DOM
-
2026-06-14days on market $297,000 Active 21 DOM
-
2026-06-13days on market $297,000 Active 20 DOM
-
2026-06-10days on market $297,000 Active 18 DOM
-
2026-06-09days on market $297,000 Active 17 DOM
-
2026-06-09price $297,000 Active 16 DOM
-
2026-06-08days on market $299,000 Active 16 DOM
-
2026-06-07days on market $299,000 Active 15 DOM
-
2026-06-03days on market $299,000 Active 11 DOM
-
2026-06-02days on market $299,000 Active 10 DOM
-
2026-06-01days on market $299,000 Active 9 DOM
-
2026-05-31days on market $299,000 Active 8 DOM
-
2026-05-30days on market $299,000 Active 7 DOM
-
2026-05-23$299,000 Active
-
2026-02-23price $299,000
-
2025-05-14soldstatus
-
2025-04-15price $280,000
-
2025-04-01price $285,000
-
2023-08-28soldstatus
ⓘ Source: listings_history table (triggers on properties + properties_extension) + one-shot
backfill from property_details.listing_events for pre-trigger history.
Tax reassessment forecast TX · Resets to sale price
- Current annual tax
- $4,034 · $336/mo
- Projected year-2 tax
- $5,435 · $453/mo
- Expected delta
- +$1,401/yr (+$117/mo · 34.7%)
ⓘ Screening estimate from a state-policy table — verify with the county assessor before closing.
Climate risk First Street
- Flood 1/10 Low 0% chance over 30 yrs
- Wildfire 5/10 Major
- Heat 6/10 Major 7 d/yr ≥102°F today · 22 d/yr by 30 yrs out
- Wind 3/10 Moderate 6% chance of damaging wind over 30 yrs
- Air quality 1/10 Low 0 unhealthy d/yr today · 0 by 30 yrs out
Nearby sold comps map
Loading sold comps map…
Walkable amenities ~0.75 mi
Loading nearby amenities…
Taxation est. · year 1
- Rental income
- $29,702
- − Mortgage interest
- −$16,637
- − Property taxes
- −$4,034
- − Insurance
- −$1,485
- − Repairs & maintenance
- −$2,376
- − Management
- −$2,376
- − Depreciation
- −$8,640
- Taxable loss
- −$5,846
- Est. tax savings @ 24.0%
- +$1,403
- After-tax cash flow
- $659/yr
For passive investors: Depreciation is non-cash, so a rental often shows a tax loss while cash-flowing — sheltering income. Rental losses are passive: they offset passive income freely, and up to $25,000/yr can offset ordinary (W-2) income if you actively participate and your MAGI is under $100k (phasing out to $0 by $150k); unused losses carry forward. On sale, claimed depreciation is recaptured at up to 25%, and gains may owe capital-gains tax (a 1031 exchange can defer both). Figures are a year-1 estimate at your 24.0% rate — not tax advice; consult a CPA.
Condition & rehab AI · 12 photos
This 2021-built home is move-in ready with modern amenities and a low-maintenance design, making it an excellent investment opportunity.
Value-add opportunities
- Both Paint exterior trim — Enhances curb appeal and value
- Both Clean gutters — Improves drainage and reduces maintenance costs
Renovation cost estimate screening
Value-add ROI direction
- Both Paint exterior trim — Enhances curb appeal and value ↑
- Both Clean gutters — Improves drainage and reduces maintenance costs ↑
ⓘ Cost ranges are severity-bucket heuristics (US national rule-of-thumb). Get contractor quotes + a written scope before underwriting a rehab budget.
Schools (NCES district)
- District
- Midland ISD
- NCES district ID
- 4830570
- Math proficiency
- 34% ▼ -7.00%
- Reading proficiency
- 36% ▬ 0.00%
- Median HH income
- $63,457
- Composite
- 31.63/100
- National rank
- #5938
- State rank
- #477 of 826 in TX
Livability — Midland
- Score
- 79/100
- State rank
- #57
- US rank
- #2192
Category grades
Schools grade is shown separately in the Schools card above.
Census & demographics
- Census place
- Midland, TX
- County
- Midland County · 168,494 people
- City population
- 168,494
- Metro
- Midland, TX
- Population (ZIP)
- 46,653
- Household income
- $105,310
- Rent vs Own
- Severe rent burden
- 1557.0
Population outlook (Midland County) Hauer SSP2
- Today (2025)
- 220,895 people
- By 2030
- 253,667 · +14.8%
- By 2040
- 325,498 · +47.4%
- By 2050
- 404,168 · +83.0%
- By 2075
- 609,802 · +176.1%
- By 2100
- 760,172 · +244.1%
Race, ethnicity, and origin ACS 2023
- Neighborhood character
- Diverse neighborhood (Simpson 0.60)
- Race & ethnicity
- White 46% Hispanic / Latino 43% Two or more races 20% Black 8%
- Hispanic origin (detail)
- Mexican 35%
- Common ancestry
- Slovak 1% Lithuanian 1% Serbian 1%
- Foreign-born
- 10% · Canada, Jamaica
- Languages at home
- 72% English-only · Spanish 24% Arabic 1%
Political lean MEDSL · Midland
- 2024 margin
- Solid R (+60.5) · D 19.3% · R 79.8%
- 2008→2024 swing
- -3.3pp toward R · 2008: -57.3pp · 2024: -60.5pp
- All cycles
- 2024: R+60.5 2020: R+56.6 2016: R+55.2 2012: R+61.5 2008: R+57.3
Not yet ingested
- Civics
- —
Market trends
- HPI YoY
- ▼ -300.44%
- Current HPI
- 207.2904
- Rent YoY
- ▲ 2.56%
- Metro
- Midland, TX
- State GDP YoY
- ▲ 3.95%
- F500 in state
- 110
Industry mix (Fortune 500 HQ in TX)
| Industry | F500 HQs | Revenue |
|---|---|---|
| Energy | 16 | $1,198B |
|
||
| Technology | 5 | $198B |
|
||
| Engineering / Construction | 4 | $72B |
|
||
| Energy Services | 3 | $60B |
|
||
| Utilities | 3 | $41B |
|
||
| Healthcare | 2 | $330B |
|
||
Price history
+4.9% since first listed6 events — show timeline
- 2026-05-23 Listed $299,000 PBBOR
- 2026-02-23 Price Changed $299,000 PBBOR
- 2025-05-14 Sold (Public Records) — Public Records
- 2025-04-15 Price Changed $280,000 PBBOR
- 2025-04-01 Price Changed $285,000 PBBOR
- 2023-08-28 Sold (Public Records) — Public Records
Property tax history
+3.1%/yrLatest (2025): $4,034 · -4.3% YoY. Source: county tax records.
Cash-flow waterfall
monthlySold comps — $/sqft
last 12 mo · ≤1 miLoading sold comps…