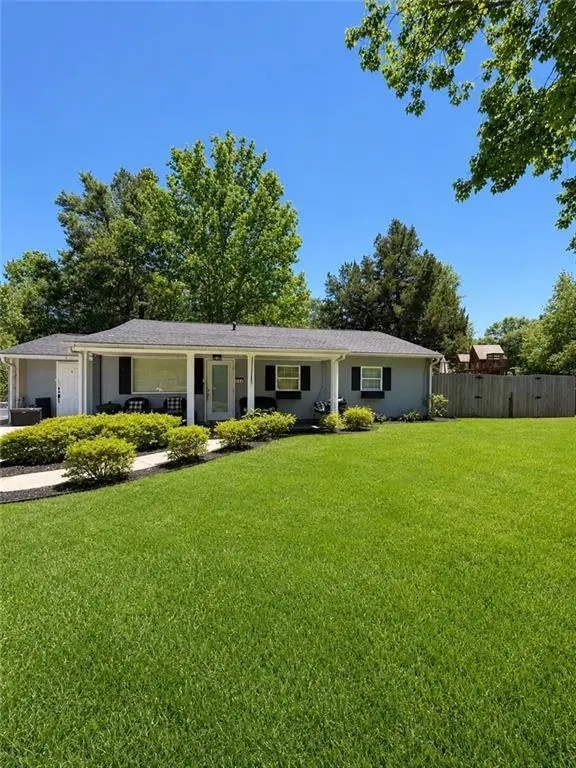
301 Evergreen Hl · Mobile, AL
Flood risk 1/10 · Minimal
- FEMA flood zone
- X (unshaded)
- Chance of flooding over 30 yrs
- 0.0%
- Est. flood insurance / yr
- $507 – $1,088
Fire risk 1/10 · Minimal
- Est. fire insurance / yr
- $916 – $1,700
Heat risk 9/10 · Severe
- Hot days now (above 105°F)
- 7 days/yr
- Hot days in 30 yrs
- 21 days/yr
Wind risk 9/10 · Severe
- Chance of severe wind over 30 yrs
- 99.0%
Air-quality risk 1/10 · Minimal
- Unhealthy air days now
- 0 days/yr
- Unhealthy air days in 30 yrs
- 0 days/yr
Risk factors via First Street. Map © Google.
Why this score? — see what drove the C- grade
The composite is a weighted blend of 9 inputs, each scored 0–100. Each bar is that input's sub-score; the figure is the points it added to the 100-point composite (weight × sub-score).
- Cash flow +20.9/30.0
- ARV discount +6.7/15.0
- DSCR +6.6/10.0
- 1% rule +4.3/10.0
- Livability +3.8/5.0
- Rent growth +3.3/5.0
- Condition / age +2.5/5.0
- Schools +2.3/10.0
- Appreciation +0.0/10.0
$139,500
🖨 Deal sheet (PDF) 📄 Offer letter ✓ Due diligence
Listing remarks
Come see this lovely home that is awaiting a new family! Great starter home! This home has some much potential and sits on a corner lot and is fenced in. Deck located to enjoy summertime with family and friends. This is one that you do not want to miss. No carpet in the house and special features in the bathrooms for those relaxing moments. Move in condition! Motivated seller! Buyer to verify all information deemed important during the due diligence period. Please use caution when accessing the back deck. There are loose deck planks present that may pose a safety hazard until repairs are completed. Must contact the listing agent for appointments.
Key facts
- Fenced in
- No carpet
- Deck
Tags
Property features AI
Finance
- Other: No land lease; Other structures on property; Subdivision: Berkshire Hills
Exterior
- Parking: Driveway with space for 1 vehicle
- Utilities: Cable available; Electricity available (110V and 220V); Phone available; Public sewer; Public water
- Home design: Single family residence; Residential property; Built in 1995; Shingle roof; Slab foundation; Wood frame windows; View available
- Construction: Other construction materials
- Exterior features: Back yard fencing; Corner lot; Other exterior features; No pool; spa/bath features noted
Interior
- Kitchen: Electric cooktop; Electric oven; Electric range; Microwave; Refrigerator; Pantry
- Bedrooms: 3 bedrooms
- Flooring: Ceramic tile flooring
- Bathrooms: 2 full bathrooms
- Heating & cooling: Electric heating; Central air conditioning; Ceiling fan(s)
- Interior features: Open floorplan between dining and living areas; Pantry; View to family room; Other interior features
Neighborhood map
What this means for you Summary
Snapshot
- This is a 3-bed/2.0-bath single-family listed at $140k.
Deal economics
- At list price, monthly cash flow is $193 ($2k/yr) — positive.
- The deal already cash-flows at list — no discount required.
- To meet the 1% rule (rent ≥ 1% of price), the offer needs to be $129k (7.3% below list).
- Recommended offer: $129k (7.3% below list) — sets the bar for 1% rule.
- Cap rate 8.0% vs local median 4.9% in Mobile — top-decile yield for the area; either an underpriced asset or a hidden risk that comps aren't pricing in. Stress-test before assuming the spread holds.
Location & tenants
- Location reads 75/100 on livability (#20 in AL, #4,262 nationally) — a middle-class / working-renter tenant base. Strengths: commute A+, cost of living A+, housing A+; Watch: crime F, employment D-.
- Mobile County (urban): math 15% / reading 39% proficiency, ranked #81 of 129 in AL (top 63%) — low school quality limits family demand, transient renter base, plan for 1-2y turnover; 67% free/reduced lunch — lower-income household profile, screen leases tightly.
- Zoned schools: Elizabeth Fonde Elementary School (math 6% / reading 26%, grade F, #502 of 627 statewide, top 80%, 725 students, 87% FRL); Denton Magnet School of Technology (math 26% / reading 69%, grade C-, #32 of 257 statewide, top 12%, 314 students, 94% FRL); Wp Davidson High School (math 36% / reading 41%, grade F, #37 of 305 statewide, top 12%, 1,535 students, 61% FRL).
- Market conditions: Rents rising (+3.1%/yr); 145 active listings in the ZIP; 25 comparable units currently listed for rent nearby; rentals at typical pace (median 15d on market — plan ~3-4 weeks tenant-placement turnaround); 1,678 units permitted in Mobile County in 2024 (264 in 5+ unit buildings).
- This rent runs 31% of the median local income ($50k/yr) — at the standard rent-burdened threshold; future hikes will face affordability resistance.
Forward outlook
- Local home prices are declining (-3.0%/yr); year-one equity from $964 of loan paydown is wiped out by about $4k of value loss. Plan a longer hold.
- Mobile County population projected to shrink 8% by 2050 — rents likely to lag national; underwrite the cash flow, not the appreciation.
Negotiation context
- It's been on market 37 days — a 3% lower offer ($135k) is reasonable based on typical stale-listing flexibility.
- 3 sale attempts with the ask held roughly flat each time — persistent listings suggest the price (not the market) is what's stuck; bring a comps-based counter.
- Current owner paid $78k; list at $140k implies a 78% gain — meaningful room to come down on a strong offer.
Risks & watch-outs
- Climate carrying-cost: severe wind risk, 99% chance of damaging wind over 30y; extreme-heat days projected 7→21/yr by 2055 (HVAC capex compounding) — expect insurance premiums to compound above CPI over the hold.
Questions for the listing agent
- It's been on market 37 days. Have you received any prior offers? Is the seller open to a 7% concession, seller financing, or rate buy-down credit?
- Is there a deadline driving the sale (1031 exchange, divorce, estate, relocation)? That informs how much negotiation room exists.
- Schools are D-rated, which usually means shorter tenancies and higher turnover. Who's the typical renter profile here, and what's been the actual vacancy rate?
- Crime grade is F in this area — have there been break-ins, vandalism, or insurance claims at this property in the last 3 years? What carrier currently insures it and at what premium?
- What's the average days-on-market for RENTAL listings here right now (not sales)? A rising rental-DOM trend means longer vacancies and softer asking-rent achievability than the comps imply.
- What's the recent tenant-quality profile in this submarket — average credit score on applications, eviction rate, late-payment / NSF rate, and stable-employment percentage? A property-management company in the area should have these aggregated.
- How much new for-sale + rental construction is in the pipeline within 1–3 miles? Heavy new supply typically softens prices + rents 12–24 months out; constrained supply supports both.
Investment metrics
- 1% rule
- 0.93% ✗
- Cap rate
- 7.95%
- Cash-on-cash
- 5.92%
- DSCR
- 1.26
- GRM
- 9.0
CMA / ARV
- ARV (median comp)
- $137,009
- List price
- $139,500
- Delta
- 1.82%
- Verdict
- FAIR
- Comps
- 20 within 1.0 mi
Show comp detail 12 sales within ~0.75 mi
| Address | Dist | Beds/Ba | Sqft | Sold | Price | $/sf | Match |
|---|---|---|---|---|---|---|---|
| 407 Laborde Dr | 0.42mi | 3/2.0 | 1,225 (+2%) | 2mo | $184,000 | $150 | 76 |
| 4126 Springdale Rd | 0.09mi | 3/2.0 | 1,380 (+15%) | 3mo | $169,000 | $122 | 68 |
| 4129 Springdale Rd | 0.07mi | 2/1.0 (-1) | 1,044 (-13%) | 1mo | $139,000 | $133 | 65 |
| 552 Tamworth Ct | 0.44mi | 3/1.0 | 1,135 (-5%) | 3mo | $159,500 | $141 | 64 |
| 1618 Catalina Dr | 0.67mi | 3/1.5 | 1,196 (-0%) | 3mo | $120,000 | $100 | 64 |
| 5100 Ridgedale Rd | 0.22mi | 3/1.0 | 1,358 (+13%) | 4mo | $132,000 | $97 | 61 |
| 4057 Gaylark Rd N | 0.44mi | 3/1.0 | 1,080 (-10%) | 2mo | $140,000 | $130 | 57 |
| 661 Raines Dr | 0.74mi | 3/1.5 | 1,134 (-6%) | 1mo | $122,000 | $108 | 53 |
| 4017 Meadow Wood Curv | 0.51mi | 3/1.0 | 1,080 (-10%) | 3mo | $139,900 | $130 | 53 |
| 4001 Sunnyvale Ln S | 0.60mi | 3/1.0 | 1,080 (-10%) | 3mo | $117,000 | $108 | 49 |
| 4275 Raines Dr | 0.74mi | 3/1.0 | 1,107 (-8%) | 2mo | $172,000 | $155 | 47 |
| 618 Wesley Ln E | 0.63mi | 3/1.0 | 1,045 (-13%) | 6mo | $135,000 | $129 | 40 |
Match score weights: distance 35% · size 25% · config 20% · recency 20%. Top-matched comps best support the ARV.
Projected returns pro-forma
-3.0% appreciation · 3.07% rent growth · sell at horizon
- IRR
- -7.1%
- Equity multiple
- 0.74×
- Total profit
- $-10,299
- Equity at exit
- $20,800
- IRR
- 2.5%
- Equity multiple
- 1.18×
- Total profit
- $6,959
- Equity at exit
- $12,061
Cash invested: $39,060 (down + closing). Projections, not guarantees.
Landlord ↔ Tenant lean methodology
- Overall (STATE)
- 90 Strongly Landlord-Friendly
- State Alabama
- 90 Strongly Landlord-Friendly · R+15
- County
- — inherits STATE
- City
- — inherits STATE
ZIP-level market 36609
- Rents YoY
- 3.1%
- Active inventory
- 145
- Price-to-rent
- 9.0×
Monthly cashflow live
- Estimated rent
- $1,293 high interval (Pro) →
- Mortgage (P&I)
- −$732
- Tax from tax record
- −$39 /mo · $465/yr
- Insurance
- −$58
- HOA
- −$0
- Vacancy / Maint / Mgmt
- −$271
- Net cashflow
- $193
Break-even live
Sensitivity live
| Price | -10% $272 | -5% $232 | +0% $193 | +5% $153 | +10% $114 |
|---|---|---|---|---|---|
| Rent | -10% $91 | -5% $142 | +0% $193 | +5% $244 | +10% $295 |
| Rate | -1.0pp $263 | -0.5pp $228 | base $193 | +0.5pp $157 | +1.0pp $120 |
UW: 25.0% down · 7.5% · 30yr · 1.5% tax · 5.0% vac · 8.0% maint · 8.0% mgmt
Financing live
Cash to close
- Down payment
- $34,875
- Closing costs
- $4,185
- Reserves months
- —
- Total cash needed
- —
Loan-product check · same deal, 3 products live
Conventional
25% down · 7.5% · 30yr
- Down + closing
- —
- Monthly P&I
- —
- Monthly cashflow
- —
- DSCR
- —
- Eligible?
- —
Personal DTI + credit; lowest rate.
DSCR
20% down · 8.5% · 30yr
- Down + closing
- —
- Monthly P&I
- —
- Monthly cashflow
- —
- DSCR
- —
- Eligible?
- —
No personal income docs; deal must DSCR.
Hard money
10% down · 12.0% · 12mo
- Down + closing
- —
- Monthly P&I
- —
- Monthly cashflow
- —
- DSCR
- —
- Eligible?
- —
Short-term bridge; refi at stabilization.
Rent comps 25 comps
| Address | Beds | Baths | Sqft | Rent | $/sqft | DOM | Units | Dist |
|---|---|---|---|---|---|---|---|---|
| 4118 Seabreeze Rd N Mobile, AL | 3.0 | 1.0 | 1088 | $1,100 | $1.01 | 45d | 1 | 0.11mi |
| 5155 Ridgedale Rd Mobile, AL | 3.0 | 1.5 | 1263 | $1,400 | $1.11 | 15d | 1 | 0.29mi |
| 833 S University Blvd Mobile, AL | 1.0–2.0 | 1.0–2.0 | 855 | $1,190 | $1.39 | 15d | 12 | 0.31mi |
| 550 Tamworth Ct Mobile, AL | 3.0 | 1.0 | 1000 | $1,295 | $1.29 | 45d | 1 | 0.42mi |
| 552 Tamworth Ct Mobile, AL | 3.0 | 1.0 | 1100 | $1,450 | $1.32 | 45d | 1 | 0.44mi |
| 4057 Gaylark Rd N Mobile, AL | 3.0 | 1.0 | 1080 | $1,275 | $1.18 | 22d | 1 | 0.45mi |
| 701 S University Blvd Mobile, AL | 2.0 | 1.0 | 692 | $1,093 | $1.58 | 22d | 10 | 0.56mi |
| 4161 Rebecca Rd Mobile, AL | 3.0 | 1.0 | 1214 | $1,500 | $1.24 | 15d | 1 | 0.57mi |
| 654 Ynestra Dr Mobile, AL | 3.0 | 1.5 | 1134 | $1,300 | $1.15 | 15d | 1 | 0.70mi |
| 4077 Lancewood Dr S Mobile, AL | 4.0 | 1.0 | 1283 | $1,600 | $1.25 | 45d | 1 | 0.76mi |
| 900 Downtowner Blvd Mobile, AL | 1.0–3.0 | 1.0–2.5 | 1029 | $1,449 | $1.41 | 15d | 32 | 0.81mi |
| 4213 Malibar Dr Mobile, AL | 3.0 | 1.0 | 1100 | $1,458 | $1.33 | 22d | 1 | 0.83mi |
| 4242 Marmora Dr Mobile, AL | 3.0 | 1.5 | 1053 | $1,500 | $1.42 | 45d | 1 | 0.87mi |
| 3800 Michael Blvd Mobile, AL | 1.0–2.0 | 1.0–2.0 | 854 | $942 | $1.10 | 15d | 15 | 0.87mi |
| 506 Seville Dr Mobile, AL | 3.0 | 1.5 | 1200 | $1,350 | $1.12 | 15d | 1 | 0.96mi |
| 651 Azalea Rd Mobile, AL | 2.0–3.0 | 1.0–1.5 | 890 | $1,232 | $1.38 | 45d | 1 | 0.96mi |
| 5900 Grelot Rd Mobile, AL | 2.0 | 2.0–2.5 | 1259 | $1,600 | $1.27 | 15d | 2 | 1.17mi |
| 561 Village Green Dr E Mobile, AL | 2.0 | 1.0 | 880 | $1,000 | $1.14 | 15d | 4 | 1.18mi |
| 4670 Rosewood Dr Mobile, AL | 3.0 | 2.0 | 1192 | $1,200 | $1.01 | 15d | 1 | 1.24mi |
| 1651 Knollwood Dr Mobile, AL | 1.0–2.0 | 1.0–2.0 | 835 | $1,247 | $1.49 | 15d | 16 | 1.27mi |
| 3993 Cottage Hill Rd Mobile, AL | 2.0 | 1.5 | 1150 | $895 | $0.78 | 45d | 1 | 1.29mi |
| 3920 Berwyn Dr S Mobile, AL | 1.0–3.0 | 1.0–2.0 | 1427 | $1,700 | $1.19 | 15d | 34 | 1.32mi |
| 3600 Michael Blvd Mobile, AL | 2.0 | 1.5 | 750 | $949 | $1.27 | 15d | 3 | 1.43mi |
| 1030 Montlimar Dr Mobile, AL | 1.0–3.0 | 1.0–2.0 | 997 | $1,509 | $1.51 | 15d | 17 | 1.45mi |
| 6075 Grelot Rd Mobile, AL | 2.0 | 1.0 | 1050 | $1,215 | $1.16 | 15d | 1 | 1.46mi |
Listing history 18 events
-
2026-06-21days on market $139,500 Active 37 DOM
-
2026-06-18days on market $139,500 Active 34 DOM
-
2026-06-18remarks 654-char remark
-
2026-06-15days on market $139,500 Active 33 DOM
-
2026-06-14days on market $139,500 Active 31 DOM
-
2026-06-13days on market $139,500 Active 30 DOM
-
2026-06-10days on market $139,500 Active 28 DOM
-
2026-06-09days on market $139,500 Active 27 DOM
-
2026-06-08days on market $139,500 Active 26 DOM
-
2026-06-07days on market $139,500 Active 25 DOM
-
2026-06-05days on market $139,500 Active 22 DOM
-
2026-06-03days on market $139,500 Active 21 DOM
-
2026-06-02days on market $139,500 Active 20 DOM
-
2026-06-01days on market $139,500 Active 19 DOM
-
2026-05-31days on market $139,500 Active 18 DOM
-
2026-05-30days on market $139,500 Active 17 DOM
-
2026-05-07$139,500 Active 650-char remark
-
2008-05-02soldstatus $78,294
ⓘ Source: listings_history table (triggers on properties + properties_extension) + one-shot
backfill from property_details.listing_events for pre-trigger history.
Tax reassessment forecast AL · Resets to sale price
- Current annual tax
- $465 · $39/mo
- Projected year-2 tax
- $572 · $48/mo
- Expected delta
- +$107/yr (+$9/mo · 23.0%)
ⓘ Screening estimate from a state-policy table — verify with the county assessor before closing.
Climate risk First Street
- Flood 1/10 Low FEMA zone X (unshaded) · 0% chance over 30 yrs
- Wildfire 1/10 Low
- Heat 9/10 Extreme 7 d/yr ≥105°F today · 21 d/yr by 30 yrs out
- Wind 9/10 Extreme 99% chance of damaging wind over 30 yrs
- Air quality 1/10 Low 0 unhealthy d/yr today · 0 by 30 yrs out
Nearby sold comps map
Loading sold comps map…
Walkable amenities ~0.75 mi
Loading nearby amenities…
Taxation est. · year 1
- Rental income
- $15,512
- − Mortgage interest
- −$7,814
- − Property taxes
- −$465
- − Insurance
- −$698
- − Repairs & maintenance
- −$1,241
- − Management
- −$1,241
- − Depreciation
- −$4,058
- Taxable loss
- −$5
- Est. tax savings @ 24.0%
- +$1
- After-tax cash flow
- $2,315/yr
For passive investors: Depreciation is non-cash, so a rental often shows a tax loss while cash-flowing — sheltering income. Rental losses are passive: they offset passive income freely, and up to $25,000/yr can offset ordinary (W-2) income if you actively participate and your MAGI is under $100k (phasing out to $0 by $150k); unused losses carry forward. On sale, claimed depreciation is recaptured at up to 25%, and gains may owe capital-gains tax (a 1031 exchange can defer both). Figures are a year-1 estimate at your 24.0% rate — not tax advice; consult a CPA.
Schools (NCES district)
- District
- Mobile County
- NCES district ID
- 0102370
- Math proficiency
- 15% ▼ -28.00%
- Reading proficiency
- 39% ▬ 0.00%
- Median HH income
- $42,455
- Composite
- 22.9/100
- National rank
- #8002
- State rank
- #81 of 129 in AL
Livability — Mobile
- Score
- 75/100
- State rank
- #20
- US rank
- #4262
Category grades
Schools grade is shown separately in the Schools card above.
Census & demographics
- Census place
- Mobile, AL
- County
- Mobile County · 246,577 people
- City population
- 205,729
- Metro
- Mobile, AL
- Population (ZIP)
- 23,820
- Household income
- $49,830
- Rent vs Own
- Severe rent burden
- 1379.0
Population outlook (Mobile County) Hauer SSP2
- Today (2025)
- 415,303 people
- By 2030
- 411,755 · -0.9%
- By 2040
- 399,670 · -3.8%
- By 2050
- 382,616 · -7.9%
- By 2075
- 337,353 · -18.8%
- By 2100
- 283,391 · -31.8%
Race, ethnicity, and origin ACS 2023
- Neighborhood character
- Diverse neighborhood (Simpson 0.62)
- Race & ethnicity
- Black 44% White 42% Two or more races 6% Hispanic / Latino 5% Asian 5%
- Common ancestry
- Lithuanian 3% Slovak 2% Italian 2%
- Foreign-born
- 6% · Canada, Vietnam, China
- Languages at home
- 93% English-only · Spanish 2% Vietnamese 2% Other Indo-European 1%
Political lean MEDSL · Mobile
- 2024 margin
- R (+16.4) · D 41.3% · R 57.7%
- 2008→2024 swing
- -7.7pp toward R · 2008: -8.7pp · 2024: -16.4pp
- All cycles
- 2024: R+16.4 2020: R+11.9 2016: R+13.9 2012: R+9.3 2008: R+8.7
Not yet ingested
- Civics
- —
Market trends
- HPI YoY
- ▼ -124.06%
- Current HPI
- 200.0811
- Rent YoY
- ▲ 3.07%
- Metro
- Mobile, AL
- State GDP YoY
- ▲ 2.94%
- F500 in state
- 4
Industry mix (Fortune 500 HQ in AL)
| Industry | F500 HQs | Revenue |
|---|---|---|
| Financial Services | 1 | $8B |
|
||
| Healthcare | 1 | $5B |
|
||
Price history
+78.2% since first listed7 events — show timeline
- 2026-06-18 Relisted — GCMLS AL
- 2026-06-15 Delisted — GCMLS AL
- 2026-05-27 Relisted — GCMLS AL
- 2026-05-21 Pending — GCMLS AL
- 2026-05-21 Contingent — GCMLS AL
- 2026-05-07 Listed $139,500 GCMLS AL
- 2008-05-02 Sold (Public Records) $78,294 Public Records
Property tax history
+5.1%/yrLatest (2025): $465 · +7.6% YoY. Source: county tax records.
Cash-flow waterfall
monthlySold comps — $/sqft
last 12 mo · ≤1 miLoading sold comps…