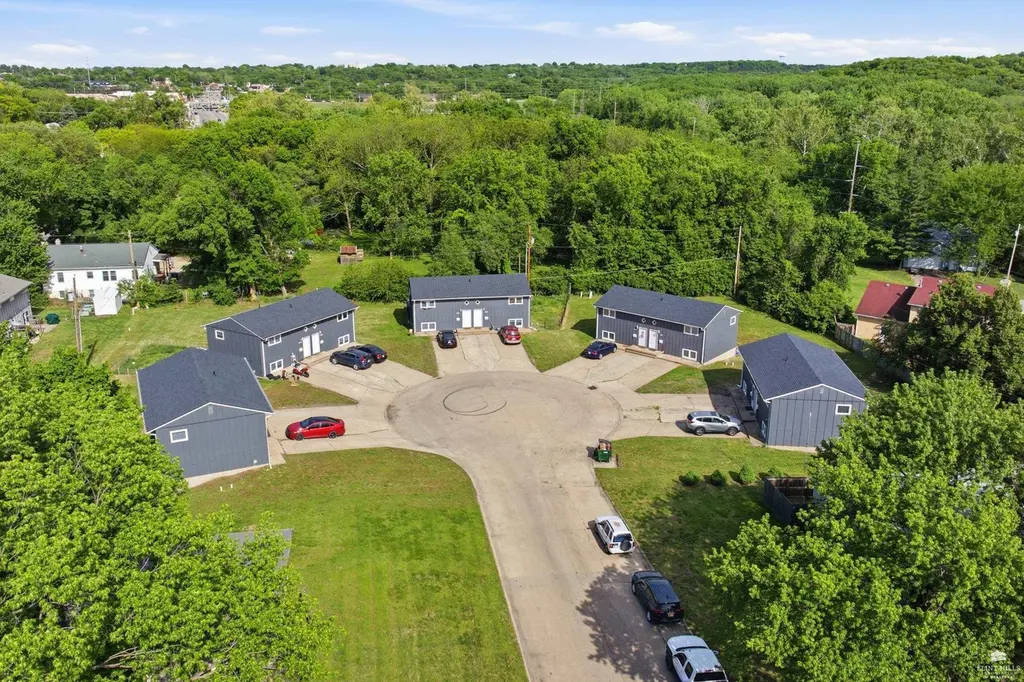
 Duplex
3311-3313 Fairman Cir · Manhattan, KS
Flood risk 1/10 · Minimal
- FEMA flood zone
- X (unshaded)
- Chance of flooding over 30 yrs
- 0.0%
- Est. flood insurance / yr
- $473 – $860
Fire risk 4/10 · Minor
- Est. fire insurance / yr
- $1,154 – $2,142
Heat risk 4/10 · Minor
- Hot days now (above 108°F)
- 7 days/yr
- Hot days in 30 yrs
- 16 days/yr
Wind risk 2/10 · Minimal
- Chance of severe wind over 30 yrs
- —
Air-quality risk 2/10 · Minimal
- Unhealthy air days now
- 2 days/yr
- Unhealthy air days in 30 yrs
- 2 days/yr
Risk factors via First Street. Map © Google.
Why this score? — see what drove the D grade
The composite is a weighted blend of 9 inputs, each scored 0–100. Each bar is that input's sub-score; the figure is the points it added to the 100-point composite (weight × sub-score).
- Cash flow +14.1/30.0
- ARV discount +7.5/15.0
- DSCR +4.3/10.0
- Livability +4.2/5.0
- Schools +3.6/10.0
- 1% rule +3.4/10.0
- Rent growth +3.2/5.0
- Condition / age +2.5/5.0
- Appreciation +0.0/10.0
$350,000
🖨 Deal sheet 📄 Offer letter ✓ Due diligence
Multi-family units
County records classify this as Multi-Family (2-4 Unit). Listing-text estimate: 2 units. confirmed
Key facts
- Exterior paint
- New roofs
- New carpet
Tags
Property features AI
Finance
- Financial info: Actual rent: $1,050 for one 3-bedroom unit; Actual rent: $900 for the other 3-bedroom unit
- HOA & community: Community park; Trails
Exterior
- Parking: Paved parking pad
- Security: No security features listed
- Utilities: Public water; Public sewer
- Home design: Duplex (both sides); Residential income property
- Construction: No construction details provided
- Exterior features: Patio; Located on a cul-de-sac; Wooded lot; Concrete road access; Pets allowed
Interior
- Kitchen: No kitchen appliance details provided
- Bedrooms: Two 3-bedroom units
- Flooring: Tile
- Bathrooms: Two full bathrooms (unit 1); Two full bathrooms (unit 2); Two half bathrooms total
- Heating & cooling: Central air conditioning; Electric heating; Natural gas heating
- Interior features: Finished walk-out basement; Tile flooring; Ceiling fans
- Laundry & utility: No laundry or utility appliance details provided
Neighborhood map
What this means for you Summary
Snapshot
- This is a 2 × 3-bed/?-bath units multifamily listed at $350k.
Deal economics
- At list price, monthly cash flow is $53 ($635/yr) — positive. Per door: $26/mo.
- The deal already cash-flows at list — no discount required.
- To meet the 1% rule (rent ≥ 1% of price), the offer needs to be $295k (15.6% below list).
- Recommended offer: $295k (15.6% below list) — sets the bar for 1% rule.
Location & tenants
- Location reads 83/100 on livability (#6 in KS, #979 nationally) — a professional / high-income tenant draw. Strengths: amenities A+, commute A+, cost of living A+; Watch: crime C-, employment C-.
- Manhattan-Ogden (urban): math 39% / reading 46% proficiency, ranked #26 of 169 in KS (top 15%) — families likely to look elsewhere, expect single-tenant / working-renter base with shorter leases.
- Market conditions: Rents rising (+3.0%/yr); 189 active listings in the ZIP; solid renter incomes; 132 units permitted in Riley County in 2024 (35 in 5+ unit buildings).
- This rent runs 36% of the median local income ($98k/yr) — at the standard rent-burdened threshold; future hikes will face affordability resistance.
Forward outlook
- Local home prices are declining (-3.0%/yr); year-one equity from $2k of loan paydown is wiped out by about $10k of value loss. Plan a longer hold.
- Riley County population projected at +30% by 2050 — long-run rental-demand tailwind backs the buy-and-hold thesis.
Negotiation context
- It's been on market 37 days — a 3% lower offer ($340k) is reasonable based on typical stale-listing flexibility.
Questions for the listing agent
- It's been on market 37 days. Have you received any prior offers? Is the seller open to a 16% concession, seller financing, or rate buy-down credit?
- Can we see the unit-by-unit rent roll, current vacancy, and any below-market leases? What's the average tenancy length?
- What capital expenditures (roof, boiler, parking lot, exteriors) have been made in the last 5 years, and what's planned in the next 2?
- Built in 1970 — when were the roof, HVAC, electrical panel, plumbing, and water heater last replaced?
- Is there a deadline driving the sale (1031 exchange, divorce, estate, relocation)? That informs how much negotiation room exists.
- The area grade is low — what's the realistic commute time and amenity access for the typical tenant pool here? Any planned neighborhood developments (good or bad) we should know about?
- What's the average days-on-market for RENTAL listings here right now (not sales)? A rising rental-DOM trend means longer vacancies and softer asking-rent achievability than the comps imply.
- What's the recent tenant-quality profile in this submarket — average credit score on applications, eviction rate, late-payment / NSF rate, and stable-employment percentage? A property-management company in the area should have these aggregated.
- How much new apartment / multifamily construction is in the pipeline within 1–3 miles? Heavy new supply (>2% of stock underway) typically softens rents 12–24 months out; light construction supports rent growth.
Investment metrics
- 1% rule
- 0.84% ✗
- Cap rate
- 6.47%
- Cash-on-cash
- 0.65%
- DSCR
- 1.03
- GRM
- 9.9
CMA / ARV
No comps found within radius.
Projected returns pro-forma
-3.0% appreciation · 2.98% rent growth · sell at horizon
- IRR
- -15.3%
- Equity multiple
- 0.45×
- Total profit
- $-53,445
- Equity at exit
- $52,186
- IRR
- -6.8%
- Equity multiple
- 0.57×
- Total profit
- $-42,608
- Equity at exit
- $30,262
Cash invested: $98,000 (down + closing). Projections, not guarantees.
Landlord ↔ Tenant lean methodology
- Overall (STATE)
- 83 Strongly Landlord-Friendly
- State Kansas
- 83 Strongly Landlord-Friendly · R+10
- County
- — inherits STATE
- City
- — inherits STATE
ZIP-level market 66503
- Rents YoY
- 3.0%
- Active inventory
- 189
- Price-to-rent
- 19.8×
Monthly cashflow live
- Estimated rent
- $2,953 medium interval (Pro) →
- Mortgage (P&I)
- −$1,835
- Tax from tax record
- −$299 /mo · $3,584/yr
- Insurance
- −$146
- HOA
- −$0
- Vacancy / Maint / Mgmt
- −$620
- Net cashflow
- $53
Break-even live
2-unit breakdown (identical units grouped — click to expand)
| Units | Beds | Baths | Est. rent |
|---|---|---|---|
| 2× units | 3 | — | $2,952 |
| #1 | 3 | — | $1,476 |
| #2 | 3 | — | $1,476 |
| Total (2 units) | $2,953 | ||
UW: 25.0% down · 7.5% · 30yr · 1.5% tax · 5.0% vac · 8.0% maint · 8.0% mgmt
Financing live
Cash to close
- Down payment
- $87,500
- Closing costs
- $10,500
- Reserves months
- —
- Total cash needed
- —
Loan-product check · same deal, 3 products live
Conventional
25% down · 7.5% · 30yr
- Down + closing
- —
- Monthly P&I
- —
- Monthly cashflow
- —
- DSCR
- —
- Eligible?
- —
Personal DTI + credit; lowest rate.
DSCR
20% down · 8.5% · 30yr
- Down + closing
- —
- Monthly P&I
- —
- Monthly cashflow
- —
- DSCR
- —
- Eligible?
- —
No personal income docs; deal must DSCR.
Hard money
10% down · 12.0% · 12mo
- Down + closing
- —
- Monthly P&I
- —
- Monthly cashflow
- —
- DSCR
- —
- Eligible?
- —
Short-term bridge; refi at stabilization.
Listing history 18 events
-
2026-06-19days on market $350,000 Active 37 DOM
-
2026-06-18days on market $350,000 Active 36 DOM
-
2026-06-17days on market $350,000 Active 35 DOM
-
2026-06-16days on market $350,000 Active 34 DOM
-
2026-06-15days on market $350,000 Active 33 DOM
-
2026-06-14days on market $350,000 Active 31 DOM
-
2026-06-13days on market $350,000 Active 30 DOM
-
2026-06-10days on market $350,000 Active 28 DOM
-
2026-06-09days on market $350,000 Active 27 DOM
-
2026-06-08days on market $350,000 Active 26 DOM
-
2026-06-07days on market $350,000 Active 25 DOM
-
2026-06-03days on market $350,000 Active 21 DOM
-
2026-06-02days on market $350,000 Active 20 DOM
-
2026-06-01days on market $350,000 Active 19 DOM
-
2026-05-31days on market $350,000 Active 18 DOM
-
2026-05-30days on market $350,000 Active 17 DOM
-
2026-05-12$350,000 Active
-
2008-05-01soldstatus $635,037
ⓘ Source: listings_history table (triggers on properties + properties_extension) + one-shot
backfill from property_details.listing_events for pre-trigger history.
Tax reassessment forecast KS · Resets to sale price
- Current annual tax
- $3,584 · $299/mo
- Projected year-2 tax
- $4,935 · $411/mo
- Expected delta
- +$1,351/yr (+$113/mo · 37.7%)
ⓘ Screening estimate from a state-policy table — verify with the county assessor before closing.
Climate risk First Street
- Flood 1/10 Low FEMA zone X (unshaded) · 0% chance over 30 yrs
- Wildfire 4/10 Moderate
- Heat 4/10 Moderate 7 d/yr ≥108°F today · 16 d/yr by 30 yrs out
- Wind 2/10 Low
- Air quality 2/10 Low 2 unhealthy d/yr today · 2 by 30 yrs out
Nearby sold comps map
Loading sold comps map…
Walkable amenities ~0.75 mi
Loading nearby amenities…
Taxation est. · year 1
- Rental income
- $35,436
- − Mortgage interest
- −$19,605
- − Property taxes
- −$3,584
- − Insurance
- −$1,750
- − Repairs & maintenance
- −$2,835
- − Management
- −$2,835
- − Depreciation
- −$10,182
- Taxable loss
- −$5,355
- Est. tax savings @ 24.0%
- +$1,285
- After-tax cash flow
- $1,920/yr
For passive investors: Depreciation is non-cash, so a rental often shows a tax loss while cash-flowing — sheltering income. Rental losses are passive: they offset passive income freely, and up to $25,000/yr can offset ordinary (W-2) income if you actively participate and your MAGI is under $100k (phasing out to $0 by $150k); unused losses carry forward. On sale, claimed depreciation is recaptured at up to 25%, and gains may owe capital-gains tax (a 1031 exchange can defer both). Figures are a year-1 estimate at your 24.0% rate — not tax advice; consult a CPA.
Schools (NCES district)
- District
- Manhattan-Ogden
- NCES district ID
- 2009180
- Math proficiency
- 39% ▼ -1.00%
- Reading proficiency
- 46% ▲ 1.00%
- Median HH income
- $44,001
- Composite
- 35.97/100
- National rank
- #4795
- State rank
- #26 of 169 in KS
Livability — Manhattan
- Score
- 83/100
- State rank
- #6
- US rank
- #979
Category grades
Schools grade is shown separately in the Schools card above.
Census & demographics
- Census place
- Manhattan, KS
- County
- Riley County · 62,662 people
- City population
- 60,966
- Metro
- Manhattan, KS
- Population (ZIP)
- 17,273
- Household income
- $97,846
- Rent vs Own
- Severe rent burden
- 421.0
Population outlook (Riley County) Hauer SSP2
- Today (2025)
- 83,656 people
- By 2030
- 89,075 · +6.5%
- By 2040
- 99,100 · +18.5%
- By 2050
- 109,146 · +30.5%
- By 2075
- 134,178 · +60.4%
- By 2100
- 153,653 · +83.7%
Race, ethnicity, and origin ACS 2023
- Neighborhood character
- Predominantly White (74%)
- Race & ethnicity
- White 74% Hispanic / Latino 8% Two or more races 8% Black 5% Asian 5% Pacific Islander 1%
- Hispanic origin (detail)
- Mexican 4%
- Common ancestry
- Lithuanian 2% Italian 2% Portuguese 2%
- Foreign-born
- 6% · China, Canada, South Korea
- Languages at home
- 90% English-only · Spanish 4% Chinese 2% Korean 1%
Political lean MEDSL · Riley
- 2024 margin
- Toss-up / Even · D 49.6% · R 47.8% · Other 2.5%
- 2008→2024 swing
- +8.8pp toward D · 2008: -7.0pp · 2024: 1.8pp
- All cycles
- 2024: D+1.8 2020: D+3.2 2016: R+4.5 2012: R+12.7 2008: R+7.0
Not yet ingested
- Civics
- —
Market trends
- HPI YoY
- ▼ -214.01%
- Current HPI
- 141.8067
- Rent YoY
- ▲ 2.98%
- Metro
- Manhattan, KS
- State GDP YoY
- —
- F500 in state
- 0
Price history
-44.9% since first listed2 events — show timeline
- 2026-05-12 Listed $350,000 FHAOR as distributed by MLS GRID
- 2008-05-01 Sold (Public Records) $635,037 Public Records
Property tax history
+5.5%/yrLatest (2025): $3,584 · +32.7% YoY. Source: county tax records.
Cash-flow waterfall
monthlySold comps — $/sqft
last 12 mo · ≤1 miLoading sold comps…