2840 Patricia Ln #104 · Garland, TX
Flood risk No data
- FEMA flood zone
- —
- Chance of flooding over 30 yrs
- —
- Est. flood insurance / yr
- —
Fire risk No data
- Est. fire insurance / yr
- —
Heat risk No data
- Hot days now (above threshold)
- —
- Hot days in 30 yrs
- —
Wind risk No data
- Chance of severe wind over 30 yrs
- —
Air-quality risk No data
- Unhealthy air days now
- —
- Unhealthy air days in 30 yrs
- —
Risk factors via First Street. Map © Google.
Why this score? — see what drove the D grade
The composite is a weighted blend of 9 inputs, each scored 0–100. Each bar is that input's sub-score; the figure is the points it added to the 100-point composite (weight × sub-score).
- Cash flow +11.3/30.0
- ARV discount +7.5/15.0
- 1% rule +6.7/10.0
- Livability +3.7/5.0
- DSCR +3.3/10.0
- Rent growth +3.3/5.0
- Schools +2.9/10.0
- Condition / age +2.5/5.0
- Appreciation +0.0/10.0
$125,000
🖨 Deal sheet (PDF) 📄 Offer letter ✓ Due diligence
Listing remarks
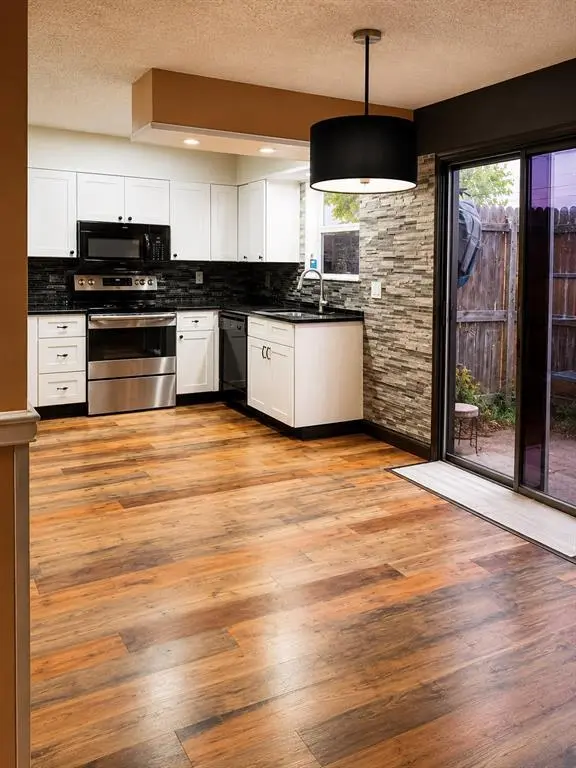
This 2-bedroom, 2-bath first-floor end-unit condo offers a practical layout and a convenient location in Garland. Featuring a comfortable living area, functional kitchen with modern appliances, and two full bathrooms, this home is ideal for buyers looking for an affordable option with easy access to everyday conveniences. The end-unit location provides additional privacy and natural light, while the first-floor access adds convenience with no stairs to climb. Located near shopping, dining, and major highways, commuting to Downtown Dallas and surrounding areas is simple and convenient. Whether you're looking for a starter home, investment property, or low-maintenance living, this condo offer
Key facts
- Easy access
- End unit
- Natural light
Tags
Property features AI
Finance
- Other: Property type: Residential condominium; Property is attached; Possession at closing/funding
- Financial info: Listing accepts cash and conventional financing
- HOA & community: Mandatory association; Monthly association fee of $312; Association covers grounds maintenance and management fees; HOA managed by Texas Homeowners Association
Exterior
- Parking: Common/community parking structure
- Security: No specific security features provided
- Utilities: Cable available; Electricity available; Not in a municipal utility district
- Home design: Condominium (attached); One story; Built in 1980; Subdivision: English Estates
- Construction: Brick construction; Slab foundation
- Exterior features: Condominium/townhome lot setting; All-weather road access
Interior
- Kitchen: Dishwasher; Disposal; Refrigerator; Eat-in kitchen with pantry
- Bedrooms: Two bedrooms (both on the main level)
- Flooring: No flooring information provided
- Bathrooms: Two full bathrooms
- Heating & cooling: Central heating; Central air; Ceiling fan(s)
- Interior features: Cable TV available; Chandelier; Decorative lighting; Eat-in kitchen; Paneling; Pantry; Five total rooms; One living area; One dining area; One-level layout
- Laundry & utility: No specific laundry details provided
Neighborhood map
What this means for you Summary
Snapshot
- This is a 2-bed/1.0-bath condo listed at $125k.
Deal economics
- At list price, monthly cash flow is $-45 ($-538/yr) — negative.
- To cash-flow at today's rent, offer at most $117k (6.3% below list).
- Meets the 1% rule at list price ($1k rent vs $125k).
- Recommended offer: $117k (6.3% below list) — sets the bar for cash-flow.
- Cap rate 5.9% vs local median 3.5% in Garland — top-decile yield for the area; either an underpriced asset or a hidden risk that comps aren't pricing in. Stress-test before assuming the spread holds.
Location & tenants
- Location reads 74/100 on livability (#165 in TX, #4,447 nationally) — a middle-class / working-renter tenant base. Strengths: commute A+, housing A+, cost of living A-; Watch: amenities C-, health & safety F.
- Garland ISD (suburban): math 27% / reading 37% proficiency, ranked #553 of 826 in TX (top 67%) — families likely to look elsewhere, expect single-tenant / working-renter base with shorter leases.
- Zoned schools: Daugherty El (math 22% / reading 29%, grade F, #2,982 of 4,322 statewide, top 70%, 810 students, 94% FRL); B G Hudson Middle (math 33% / reading 42%, grade F, #736 of 1,662 statewide, top 45%, 1,207 students, 50% FRL); Sachse H S (math 46% / reading 53%, grade D, #509 of 1,632 statewide, top 34%, 2,997 students, 43% FRL).
- Market conditions: Rents rising (+3.4%/yr); 102 active listings in the ZIP; 27 comparable units currently listed for rent nearby; rentals at typical pace (median 27d on market — plan ~3-4 weeks tenant-placement turnaround); 41% of comp listings sitting > 30 days — soft ceiling on asking rent; 12,577 units permitted in Dallas County in 2024 (6,829 in 5+ unit buildings).
Forward outlook
- Local home prices are declining (-3.0%/yr); year-one equity from $864 of loan paydown is wiped out by about $4k of value loss. Plan a longer hold.
- Dallas County population projected at +35% by 2050 — long-run rental-demand tailwind backs the buy-and-hold thesis.
Negotiation context
- It's been on market 29 days — a 2% lower offer ($123k) is reasonable based on typical stale-listing flexibility.
- 4 sale attempts since 4y ago; this cycle's ask has dropped $10k (7%) from the opening price — seller is motivated, your offer sets the floor, not the list.
Risks & watch-outs
- Watch-outs: HOA is 21% of rent.
Questions for the listing agent
- What do current leases actually rent for vs. the listed asking? Can we see a recent rent roll and the last 12 months of T-12 income?
- What does the HOA fee cover, when was the last increase, and are there any pending special assessments or reserve-fund shortfalls?
- Any open or pending special assessments — roof, HVAC, plumbing, elevator, façade? What's the per-unit balance and payoff schedule, and is the seller paying it off at close or rolling it to the buyer?
- Is there a deadline driving the sale (1031 exchange, divorce, estate, relocation)? That informs how much negotiation room exists.
- Schools are D-rated, which usually means shorter tenancies and higher turnover. Who's the typical renter profile here, and what's been the actual vacancy rate?
- The area grade is low — what's the realistic commute time and amenity access for the typical tenant pool here? Any planned neighborhood developments (good or bad) we should know about?
- What's the average days-on-market for RENTAL listings here right now (not sales)? A rising rental-DOM trend means longer vacancies and softer asking-rent achievability than the comps imply.
- What's the recent tenant-quality profile in this submarket — average credit score on applications, eviction rate, late-payment / NSF rate, and stable-employment percentage? A property-management company in the area should have these aggregated.
- How much new apartment / multifamily construction is in the pipeline within 1–3 miles? Heavy new supply (>2% of stock underway) typically softens rents 12–24 months out; light construction supports rent growth.
Investment metrics
- 1% rule
- 1.17% ✓
- Cap rate
- 5.86%
- Cash-on-cash
- -1.54%
- DSCR
- 0.93
- GRM
- 7.1
CMA / ARV
No comps found within radius.
Projected returns pro-forma
-3.0% appreciation · 3.38% rent growth · sell at horizon
- IRR
- -18.0%
- Equity multiple
- 0.36×
- Total profit
- $-22,323
- Equity at exit
- $18,638
- IRR
- -8.9%
- Equity multiple
- 0.43×
- Total profit
- $-19,879
- Equity at exit
- $10,808
Cash invested: $35,000 (down + closing). Projections, not guarantees.
Landlord ↔ Tenant lean methodology
- Overall (STATE)
- 87 Strongly Landlord-Friendly
- State Texas
- 87 Strongly Landlord-Friendly · R+5
- County
- — inherits STATE
- City
- — inherits STATE
ZIP-level market 75041
- Home prices YoY
- -31.0%
- Rents YoY
- 3.4%
- Active inventory
- 102
- Price-to-rent
- 7.1×
Monthly cashflow live
- Estimated rent
- $1,458 high interval (Pro) →
- Mortgage (P&I)
- −$656
- Tax from tax record
- −$177 /mo · $2,129/yr
- Insurance
- −$52
- HOA
- −$312
- Vacancy / Maint / Mgmt
- −$306
- Net cashflow
- $-45
Break-even live
Sensitivity live
| Price | -10% $26 | -5% $-9 | +0% $-45 | +5% $-80 | +10% $-116 |
|---|---|---|---|---|---|
| Rent | -10% $-160 | -5% $-102 | +0% $-45 | +5% $13 | +10% $70 |
| Rate | -1.0pp $18 | -0.5pp $-13 | base $-45 | +0.5pp $-77 | +1.0pp $-110 |
UW: 25.0% down · 7.5% · 30yr · 1.5% tax · 5.0% vac · 8.0% maint · 8.0% mgmt
Financing live
Cash to close
- Down payment
- $31,250
- Closing costs
- $3,750
- Reserves months
- —
- Total cash needed
- —
Loan-product check · same deal, 3 products live
Conventional
25% down · 7.5% · 30yr
- Down + closing
- —
- Monthly P&I
- —
- Monthly cashflow
- —
- DSCR
- —
- Eligible?
- —
Personal DTI + credit; lowest rate.
DSCR
20% down · 8.5% · 30yr
- Down + closing
- —
- Monthly P&I
- —
- Monthly cashflow
- —
- DSCR
- —
- Eligible?
- —
No personal income docs; deal must DSCR.
Hard money
10% down · 12.0% · 12mo
- Down + closing
- —
- Monthly P&I
- —
- Monthly cashflow
- —
- DSCR
- —
- Eligible?
- —
Short-term bridge; refi at stabilization.
Rent comps 27 comps
| Address | Beds | Baths | Sqft | Rent | $/sqft | DOM | Units | Dist |
|---|---|---|---|---|---|---|---|---|
| 2826 Wimbledon Ct Unit D Garland, TX | 2.0 | 1.5 | 1040 | $1,175 | $1.13 | 23d | 1 | 0.07mi |
| 2822 Wimbledon Ct Unit C Garland, TX | 2.0 | 1.5 | 1040 | $1,200 | $1.15 | 26d | 1 | 0.08mi |
| 2813 Wimbledon Ct Unit D Garland, TX | 2.0 | 1.5 | 1040 | $1,350 | $1.30 | 45d | 1 | 0.11mi |
| 2717 Patricia Ln Unit B Garland, TX | 2.0 | 1.0 | 700 | $1,550 | $2.21 | 26d | 1 | 0.11mi |
| 2717 Patricia Ln Garland, TX | 2.0 | 1.0 | 700 | $1,550 | $2.21 | 45d | 1 | 0.12mi |
| 2713 Wimbledon Ct Unit D Garland, TX | 2.0 | 2.0 | 1040 | $1,295 | $1.25 | 17d | 1 | 0.14mi |
| 2710 Wimbledon Ct Apt B Garland, TX | 2.0 | 1.5 | 1040 | $1,350 | $1.30 | 26d | 1 | 0.14mi |
| 2802 Wimbledon Ct Apt D Garland, TX | 2.0 | 1.5 | 1040 | $1,150 | $1.11 | 17d | 1 | 0.15mi |
| 2802 Wimbledon Ct Garland, TX | 2.0 | 2.0 | 1040 | $1,300 | $1.25 | 45d | 1 | 0.15mi |
| 2718 Wimbledon Ct Unit C Garland, TX | 2.0 | 1.5 | 1040 | $1,350 | $1.30 | 1d | 1 | 0.17mi |
| 3033 Ballinger Dr Garland, TX | 2.0 | 1.0 | 768 | $1,600 | $2.08 | 26d | 1 | 0.25mi |
| 2233 Huskey St Garland, TX | 3.0 | 2.0 | 1040 | $2,195 | $2.11 | 45d | 1 | 0.28mi |
| 1713 Kirkwood Dr Garland, TX | 3.0 | 2.0 | 971 | $1,745 | $1.80 | 10d | 1 | 0.37mi |
| 1939 Cranford Dr #102 Garland, TX | 2.0 | 1.0 | 900 | $1,250 | $1.39 | 45d | 1 | 0.37mi |
| 1935 Cranford Dr Unit 104 Garland, TX | 2.0 | 2.0 | 900 | $1,295 | $1.44 | 45d | 1 | 0.39mi |
| 1935 Cranford Dr Unit 1935-104 Garland, TX | 2.0 | 2.0 | 900 | $1,350 | $1.50 | 45d | 1 | 0.39mi |
| 1935 Cranford Dr Unit 1939-102 Garland, TX | 2.0 | 1.0 | 900 | $1,250 | $1.39 | 45d | 1 | 0.39mi |
| 2848 Beasley Dr Garland, TX | 3.0 | 1.0 | 1014 | $1,625 | $1.60 | 21d | 1 | 0.43mi |
| 2848 Beasley Dr Garland, TX | 3.0 | 1.0 | 1014 | $1,625 | $1.60 | 26d | 1 | 0.43mi |
| 1821 Randolph Dr Garland, TX | 2.0 | 1.0 | 847 | $1,395 | $1.65 | 45d | 1 | 0.51mi |
| 1201 Winifred Dr Garland, TX | 1.0 | 1.0 | 688 | $1,049 | $1.52 | 45d | 2 | 0.90mi |
| 2121 S Glenbrook Dr Garland, TX | 1.0–2.0 | 1.0–2.0 | 1012 | $1,550 | $1.53 | 4d | 6 | 1.01mi |
| 724 W Miller Rd Garland, TX | 1.0 | 1.0 | 700 | $1,285 | $1.84 | 5d | 1 | 1.33mi |
| 1702 Edgefield Dr Garland, TX | 2.0 | 1.0–2.0 | 626 | $1,470 | $2.35 | 0d | 63 | 1.33mi |
| 1540 Edgefield Dr Garland, TX | 1.0–2.0 | 1.0–2.0 | 775 | $1,740 | $2.25 | 1d | 23 | 1.38mi |
| 1222 S Shiloh Rd Unit S-102 Garland, TX | 2.0 | 1.0 | 920 | $1,200 | $1.30 | 45d | 1 | 1.40mi |
| 1425 Cedarcrest Dr Garland, TX | 2.0 | 1.0 | 1064 | $1,650 | $1.55 | 26d | 1 | 1.43mi |
HOA detail condo
- Monthly dues
- $312 · $3,744/yr
- Assessments
- None detected in remarks — confirm with the listing agent.
Listing history 26 events
-
2026-06-17days on market $125,000 Active 29 DOM
-
2026-06-16days on market $125,000 Active 28 DOM
-
2026-06-15days on market $125,000 Active 27 DOM
-
2026-06-13days on market $125,000 Active 25 DOM
-
2026-06-09days on market $125,000 Active 21 DOM
-
2026-06-08days on market $125,000 Active 20 DOM
-
2026-06-07days on market $125,000 Active 19 DOM
-
2026-06-04days on market $125,000 Active 16 DOM
-
2026-06-03days on market $125,000 Active 15 DOM
-
2026-06-02days on market $125,000 Active 14 DOM
-
2026-06-01pricedays on market $125,000 Active 13 DOM
-
2026-05-31days on market $135,000 Active 12 DOM
-
2026-05-19$135,000 Active
-
2025-11-30historical
-
2025-07-08price $143,000
-
2025-06-23price $134,000
-
2025-06-14price $143,000
-
2025-05-26$169,000 Active
-
2024-10-31historical
-
2024-05-04$100,000 Active
-
2022-09-07soldstatus
-
2022-08-29soldstatus Closed
-
2022-07-07status Pending
-
2022-06-23$87,895 Active
-
1993-04-23soldstatus
-
1992-03-24soldstatus
ⓘ Source: listings_history table (triggers on properties + properties_extension) + one-shot
backfill from property_details.listing_events for pre-trigger history.
Tax reassessment forecast TX · Resets to sale price
- Current annual tax
- $2,129 · $177/mo
- Projected year-2 tax
- $2,288 · $191/mo
- Expected delta
- +$159/yr (+$13/mo · 7.5%)
ⓘ Screening estimate from a state-policy table — verify with the county assessor before closing.
Nearby sold comps map
Loading sold comps map…
Walkable amenities ~0.75 mi
Loading nearby amenities…
Taxation est. · year 1
- Rental income
- $17,501
- − Mortgage interest
- −$7,002
- − Property taxes
- −$2,129
- − Insurance
- −$625
- − Repairs & maintenance
- −$1,400
- − Management
- −$1,400
- − HOA
- −$3,744
- − Depreciation
- −$3,636
- Taxable loss
- −$2,435
- Est. tax savings @ 24.0%
- +$584
- After-tax cash flow
- $47/yr
For passive investors: Depreciation is non-cash, so a rental often shows a tax loss while cash-flowing — sheltering income. Rental losses are passive: they offset passive income freely, and up to $25,000/yr can offset ordinary (W-2) income if you actively participate and your MAGI is under $100k (phasing out to $0 by $150k); unused losses carry forward. On sale, claimed depreciation is recaptured at up to 25%, and gains may owe capital-gains tax (a 1031 exchange can defer both). Figures are a year-1 estimate at your 24.0% rate — not tax advice; consult a CPA.
Schools (NCES district)
- District
- Garland ISD
- NCES district ID
- 4820340
- Math proficiency
- 27% ▼ -23.00%
- Reading proficiency
- 37% ▼ -10.00%
- Median HH income
- $58,392
- Composite
- 28.63/100
- National rank
- #6706
- State rank
- #553 of 826 in TX
Livability — Garland
- Score
- 74/100
- State rank
- #165
- US rank
- #4447
Category grades
Schools grade is shown separately in the Schools card above.
Census & demographics
- Census place
- Garland, TX
- County
- Dallas County · 2,612,404 people
- City population
- 246,342
- Metro
- Dallas-Fort Worth-Arlington, TX
- Population (ZIP)
- 32,943
- Household income
- $70,308
- Rent vs Own
- Severe rent burden
- 910.0
Population outlook (Dallas County) Hauer SSP2
- Today (2025)
- 2,979,839 people
- By 2030
- 3,191,823 · +7.1%
- By 2040
- 3,619,611 · +21.5%
- By 2050
- 4,026,915 · +35.1%
- By 2075
- 4,957,073 · +66.4%
- By 2100
- 5,508,725 · +84.9%
Race, ethnicity, and origin ACS 2023
- Neighborhood character
- Predominantly Hispanic (70%)
- Race & ethnicity
- Hispanic / Latino 70% Two or more races 39% White 20% Black 6% Asian 2% Native American 1%
- Hispanic origin (detail)
- Mexican 53%
- Common ancestry
- Slovak 1% Lithuanian 1% Serbian 1%
- Foreign-born
- 34% · Canada, Jamaica, Vietnam
- Languages at home
- 33% English-only · Spanish 63% Vietnamese 1% Other Asian/Pacific 1%
Political lean MEDSL · Dallas
- 2024 margin
- Strong D (+22.2) · D 60.2% · R 38.0% · Other 1.8%
- 2008→2024 swing
- +6.9pp toward D · 2008: 15.3pp · 2024: 22.2pp
- All cycles
- 2024: D+22.2 2020: D+31.6 2016: D+26.2 2012: D+15.4 2008: D+15.3
Not yet ingested
- Civics
- —
Market trends
- HPI YoY
- ▼ -145.65%
- Current HPI
- 324.7929
- Rent YoY
- ▲ 3.38%
- Metro
- Dallas-Fort Worth-Arlington, TX
- State GDP YoY
- ▲ 3.95%
- F500 in state
- 110
Industry mix (Fortune 500 HQ in TX)
| Industry | F500 HQs | Revenue |
|---|---|---|
| Energy | 16 | $1,198B |
|
||
| Technology | 5 | $198B |
|
||
| Engineering / Construction | 4 | $72B |
|
||
| Energy Services | 3 | $60B |
|
||
| Utilities | 3 | $41B |
|
||
| Healthcare | 2 | $330B |
|
||
Price history
+53.6% since first listed14 events — show timeline
- 2026-05-19 Listed $135,000 NTREIS
- 2025-11-30 Listing Removed — NTREIS
- 2025-07-08 Price Changed $143,000 NTREIS
- 2025-06-23 Price Changed $134,000 NTREIS
- 2025-06-14 Price Changed $143,000 NTREIS
- 2025-05-26 Listed $169,000 NTREIS
- 2024-10-31 Listing Removed — NTREIS
- 2024-05-04 Listed $100,000 NTREIS
- 2022-09-07 Sold (Public Records) — Public Records
- 2022-08-29 Sold (MLS) — NTREIS
- 2022-07-07 Pending — NTREIS
- 2022-06-23 Listed $87,895 NTREIS
- 1993-04-23 Sold (Public Records) — Public Records
- 1992-03-24 Sold (Public Records) — Public Records
Property tax history
+6.8%/yrLatest (2025): $2,129 · +5.3% YoY. Source: county tax records.
Cash-flow waterfall
monthlySold comps — $/sqft
last 12 mo · ≤1 miLoading sold comps…