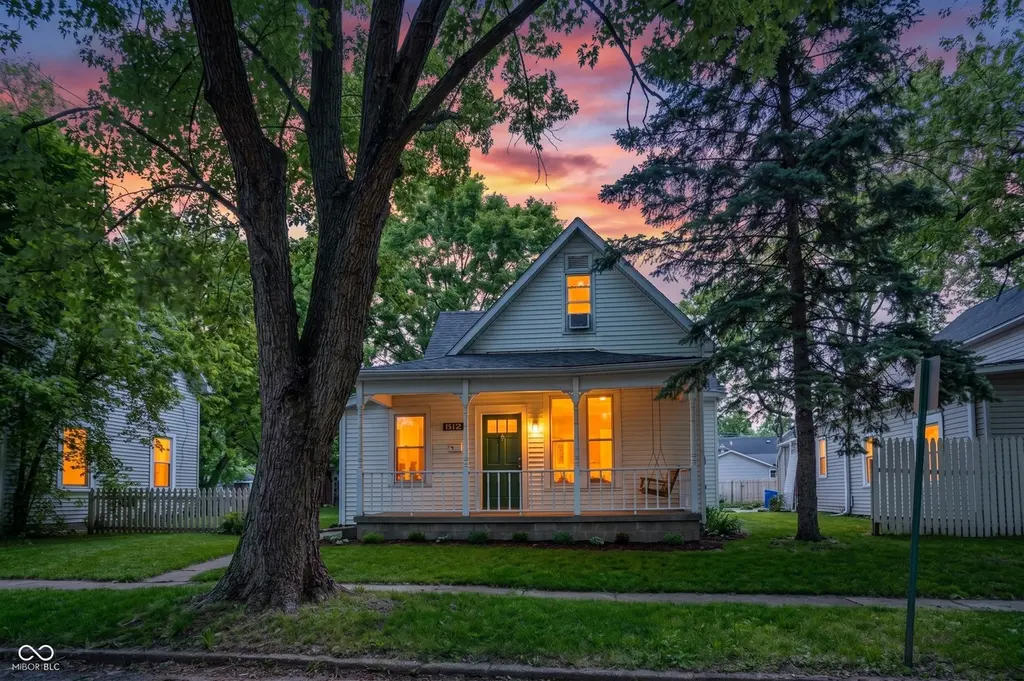
812 Chestnut St · Anderson, IN
Flood risk 1/10 · Minimal
- FEMA flood zone
- X (unshaded)
- Chance of flooding over 30 yrs
- 0.0%
- Est. flood insurance / yr
- $507 – $1,088
Fire risk 1/10 · Minimal
- Est. fire insurance / yr
- $717 – $1,331
Heat risk 3/10 · Minor
- Hot days now (above 100°F)
- 7 days/yr
- Hot days in 30 yrs
- 18 days/yr
Wind risk 2/10 · Minimal
- Chance of severe wind over 30 yrs
- 0.0%
Air-quality risk 3/10 · Minor
- Unhealthy air days now
- 2 days/yr
- Unhealthy air days in 30 yrs
- 3 days/yr
Risk factors via First Street. Map © Google.
Why this score? — see what drove the B+ grade
The composite is a weighted blend of 9 inputs, each scored 0–100. Each bar is that input's sub-score; the figure is the points it added to the 100-point composite (weight × sub-score).
- Cash flow +30.0/30.0
- ARV discount +15.0/15.0
- 1% rule +10.0/10.0
- DSCR +10.0/10.0
- Rent growth +3.0/5.0
- Livability +3.0/5.0
- Condition / age +2.5/5.0
- Schools +1.6/10.0
- Appreciation +0.0/10.0
$76,000
🖨 Deal sheet 📄 Offer letter ✓ Due diligence
Listing remarks MLS
Location. Price. Opportunity. Just a 5-minute walk (2-minute drive) to Anderson University, this 3-bedroom, 2-bath home puts you in one of Anderson's most walkable and desirable corridors. Priced at $125,000, this is a rare chance for a first-time buyer to step into ownership and start building equity instead of paying rent. Homes with three bedrooms and two full baths - this close to campus - do not come to market often at this price. Minutes from downtown Anderson's shopping, dining, and entertainment, and convenient to Ascension St. Vincent Anderson, the location supports both everyday living and long-term value. Inside, the practical layout offers flexibility for guests, a home office, or shared living, with two full bathrooms providing added comfort. The manageable lot keeps maintenance simple while giving you space to personalize. Walkable to campus. Affordable entry point. Future flexibility built in. Homes in this price range near Anderson University move quickly - schedule your showing today.
Key facts
- Manageable lot
- Walkable to campus
- Two full bathrooms
Tags
Neighborhood map
What this means for you Summary
Snapshot
- This is a 3-bed/1.0-bath single-family listed at $76k.
Deal economics
- At list price, monthly cash flow is $374 ($4k/yr) — positive.
- The deal already cash-flows at list — no discount required.
- Meets the 1% rule at list price ($1k rent vs $76k).
- Recommended offer: $71k (6.0% below list) — sets the bar for market timing.
- Cap rate 12.2% vs local median 6.5% in Anderson — top-decile yield for the area; either an underpriced asset or a hidden risk that comps aren't pricing in. Stress-test before assuming the spread holds.
Location & tenants
- Location reads 60/100 on livability (#521 in IN) — a middle-class / working-renter tenant base. Strengths: cost of living A+, housing A+; Watch: schools F, crime D-, amenities F.
- Anderson Community School Corporation (urban): math 15% / reading 23% proficiency, ranked #280 of 301 in IN (top 93%) — low school quality limits family demand, transient renter base, plan for 1-2y turnover; 70% free/reduced lunch — lower-income household profile, screen leases tightly.
- Market conditions: Rents rising (+1.8%/yr); 159 active listings in the ZIP; 19 comparable units currently listed for rent nearby; rentals at typical pace (median 24d on market — plan ~3-4 weeks tenant-placement turnaround); 184 units permitted in Madison County in 2024 (0 in 5+ unit buildings).
Forward outlook
- Local home prices are declining (-3.0%/yr); year-one equity from $525 of loan paydown is wiped out by about $2k of value loss. Plan a longer hold.
- Madison County population projected at -14% by 2050 — secular population decline; favor cash flow + early exit over multi-decade hold.
- At projected returns (-3.0% appreciation + 1.8% rent growth), your $21k cash investment doubles in ~7 years — after that, you're playing with house money.
Negotiation context
- It's been on market 82 days — a 6% lower offer ($71k) is reasonable based on typical stale-listing flexibility.
- 6 sale attempts since 15y ago; this cycle's ask has dropped $49k (39%) from the opening price — seller is motivated, your offer sets the floor, not the list.
Risks & watch-outs
- Watch-outs: built in 1899 — expect roof / HVAC / electrical / plumbing capex.
Questions for the listing agent
- It's been on market 82 days. Have you received any prior offers? Is the seller open to a 6% concession, seller financing, or rate buy-down credit?
- Built in 1899 — when were the roof, HVAC, electrical panel, plumbing, and water heater last replaced?
- Why hasn't it sold? Are there any deal-killer items the seller is aware of (foundation, flood, title, zoning, code violations)?
- Is there a deadline driving the sale (1031 exchange, divorce, estate, relocation)? That informs how much negotiation room exists.
- Schools are F-rated, which usually means shorter tenancies and higher turnover. Who's the typical renter profile here, and what's been the actual vacancy rate?
- Crime grade is D in this area — have there been break-ins, vandalism, or insurance claims at this property in the last 3 years? What carrier currently insures it and at what premium?
- What's the average days-on-market for RENTAL listings here right now (not sales)? A rising rental-DOM trend means longer vacancies and softer asking-rent achievability than the comps imply.
- What's the recent tenant-quality profile in this submarket — average credit score on applications, eviction rate, late-payment / NSF rate, and stable-employment percentage? A property-management company in the area should have these aggregated.
- How much new for-sale + rental construction is in the pipeline within 1–3 miles? Heavy new supply typically softens prices + rents 12–24 months out; constrained supply supports both.
Investment metrics
- 1% rule
- 1.55% ✓
- Cap rate
- 12.20%
- Cash-on-cash
- 21.11%
- DSCR
- 1.94
- GRM
- 5.4
CMA / ARV
- ARV (median comp)
- $130,129
- List price
- $76,000
- Delta
- -41.60%
- Verdict
- UNDERPRICED
- Comps
- 20 within 1.0 mi
Show comp detail 12 sales within ~0.75 mi
| Address | Dist | Beds/Ba | Sqft | Sold | Price | $/sf | Match |
|---|---|---|---|---|---|---|---|
| 1300 E 7th St | 0.12mi | 2/1.0 (-1) | 1,242 (-4%) | 3mo | $160,000 | $129 | 81 |
| 913 Cottage Ave | 0.21mi | 2/1.0 (-1) | 1,288 (+0%) | 4mo | $28,765 | $22 | 81 |
| 1612 E 7th St | 0.35mi | 3/2.0 | 1,359 (+6%) | 6mo | $192,000 | $141 | 65 |
| 1009 Chestnut St | 0.16mi | 2/1.0 (-1) | 1,416 (+10%) | 9mo | $115,000 | $81 | 64 |
| 503 Central Ave | 0.39mi | 2/2.0 (-1) | 1,346 (+5%) | 3mo | $110,000 | $82 | 63 |
| 916 Alhambra Dr | 0.53mi | 3/1.0 | 1,199 (-7%) | 3mo | $155,000 | $129 | 61 |
| 803 Cottage Ave | 0.20mi | 3/2.0 | 1,479 (+15%) | 2mo | $104,000 | $70 | 60 |
| 1708 Falls Ct | 0.57mi | 2/2.0 (-1) | 1,312 (+2%) | 4mo | $160,000 | $122 | 58 |
| 1525 Home Ave | 0.51mi | 2/1.0 (-1) | 1,209 (-6%) | 5mo | $137,000 | $113 | 57 |
| 2216 E 6th St | 0.72mi | 2/1.0 (-1) | 1,337 (+4%) | 7mo | $115,000 | $86 | 50 |
| 1822 E 6th St | 0.48mi | 2/1.0 (-1) | 1,159 (-10%) | 12mo | $136,000 | $117 | 46 |
| 1611 Johnson Ave | 0.53mi | 2/1.0 (-1) | 1,104 (-14%) | 2mo | $25,000 | $23 | 45 |
Match score weights: distance 35% · size 25% · config 20% · recency 20%. Top-matched comps best support the ARV.
Projected returns pro-forma
-3.0% appreciation · 1.82% rent growth · sell at horizon
- IRR
- 12.2%
- Equity multiple
- 1.48×
- Total profit
- $10,188
- Equity at exit
- $11,332
- IRR
- 20.2%
- Equity multiple
- 2.61×
- Total profit
- $34,194
- Equity at exit
- $6,571
Cash invested: $21,280 (down + closing). Projections, not guarantees.
Landlord ↔ Tenant lean methodology
- Overall (STATE)
- 90 Strongly Landlord-Friendly
- State Indiana
- 90 Strongly Landlord-Friendly · R+11
- County
- — inherits STATE
- City
- — inherits STATE
ZIP-level market 46012
- Home prices YoY
- -18.6%
- Rents YoY
- 1.8%
- Active inventory
- 159
- Price-to-rent
- 5.4×
Monthly cashflow live
- Estimated rent
- $1,176 high interval (Pro) →
- Mortgage (P&I)
- −$399
- Tax from tax record
- −$124 /mo · $1,491/yr
- Insurance
- −$32
- HOA
- −$0
- Vacancy / Maint / Mgmt
- −$247
- Net cashflow
- $374
Break-even live
UW: 25.0% down · 7.5% · 30yr · 1.5% tax · 5.0% vac · 8.0% maint · 8.0% mgmt
Financing live
Cash to close
- Down payment
- $19,000
- Closing costs
- $2,280
- Reserves months
- —
- Total cash needed
- —
Loan-product check · same deal, 3 products live
Conventional
25% down · 7.5% · 30yr
- Down + closing
- —
- Monthly P&I
- —
- Monthly cashflow
- —
- DSCR
- —
- Eligible?
- —
Personal DTI + credit; lowest rate.
DSCR
20% down · 8.5% · 30yr
- Down + closing
- —
- Monthly P&I
- —
- Monthly cashflow
- —
- DSCR
- —
- Eligible?
- —
No personal income docs; deal must DSCR.
Hard money
10% down · 12.0% · 12mo
- Down + closing
- —
- Monthly P&I
- —
- Monthly cashflow
- —
- DSCR
- —
- Eligible?
- —
Short-term bridge; refi at stabilization.
Rent comps 19 comps
| Address | Beds | Baths | Sqft | Rent | $/sqft | DOM | Units | Dist |
|---|---|---|---|---|---|---|---|---|
| 1023 E 8th St Unit 3 Anderson, IN | 2.0 | 1.5 | 1200 | $1,175 | $0.98 | 7d | 1 | 0.06mi |
| 706 University Blvd Anderson, IN | 2.0 | 1.0 | 1250 | $1,050 | $0.84 | 1d | 1 | 0.45mi |
| 1829 E 8th St Anderson, IN | 1.0–3.0 | 1.0 | 810 | $1,250 | $1.54 | 23d | 9 | 0.49mi |
| 1045 Alhambra Dr Unit 6 Anderson, IN | 2.0 | 1.5 | 900 | $975 | $1.08 | 23d | 1 | 0.54mi |
| 530 Alhambra Dr Anderson, IN | 1.0–2.0 | 1.0 | 879 | $1,100 | $1.25 | 43d | 1 | 0.58mi |
| 219 E 13th St Anderson, IN | 3.0 | 1.0 | 882 | $1,000 | $1.13 | 3d | 1 | 0.68mi |
| 1726-1728 Walnut St Anderson, IN | 2.0 | 2.0 | 900 | $995 | $1.11 | 1d | 1 | 0.77mi |
| 2023 McKinley St Anderson, IN | 2.0 | 1.0 | 1500 | $950 | $0.63 | 43d | 1 | 0.85mi |
| 120 W 10th St Anderson, IN | 1.0–3.0 | 1.0 | 1066 | $1,150 | $1.08 | 1d | 1 | 0.88mi |
| 2505 E 10th St Anderson, IN | 1.0–2.0 | 1.0 | 850 | $949 | $1.12 | 43d | 2 | 0.96mi |
| 2111 Central Ave Anderson, IN | 3.0 | 1.0 | 1026 | $1,250 | $1.22 | 43d | 1 | 1.10mi |
| 510 W 5th St Anderson, IN | 3.0 | 1.5 | 1617 | $995 | $0.62 | 43d | 1 | 1.15mi |
| 506 W 2nd St Anderson, IN | 3.0 | 1.0 | 964 | $1,095 | $1.14 | 23d | 1 | 1.18mi |
| 229 W 19th St Anderson, IN | 3.0 | 1.0 | 1200 | $1,000 | $0.83 | 43d | 1 | 1.23mi |
| 820 W 7th St Apt A Anderson, IN | 2.0 | 2.0 | 1400 | $1,200 | $0.86 | 23d | 1 | 1.30mi |
| 535 Woodlawn Dr Anderson, IN | 4.0 | 1.5 | 1128 | $1,295 | $1.15 | 23d | 1 | 1.31mi |
| 1318 E 28th St Anderson, IN | 3.0 | 1.0 | 1280 | $1,300 | $1.02 | 11d | 1 | 1.35mi |
| 921 W 9th St Anderson, IN | 3.0 | 2.0 | 1611 | $1,375 | $0.85 | 23d | 1 | 1.38mi |
| 2625 Main St Anderson, IN | 2.0 | 1.0 | 988 | $895 | $0.91 | 23d | 1 | 1.45mi |
Listing history 15 events
-
2026-06-02price $76,000 Pending 82 DOM
-
2026-05-11status Pending 1016-char remark
Show marketing remark (1016 chars)
Location. Price. Opportunity. Just a 5-minute walk (2-minute drive) to Anderson University, this 3-bedroom, 2-bath home puts you in one of Anderson's most walkable and desirable corridors. Priced at $125,000, this is a rare chance for a first-time buyer to step into ownership and start building equity instead of paying rent. Homes with three bedrooms and two full baths - this close to campus - do not come to market often at this price. Minutes from downtown Anderson's shopping, dining, and entertainment, and convenient to Ascension St. Vincent Anderson, the location supports both everyday living and long-term value. Inside, the practical layout offers flexibility for guests, a home office, or shared living, with two full bathrooms providing added comfort. The manageable lot keeps maintenance simple while giving you space to personalize. Walkable to campus. Affordable entry point. Future flexibility built in. Homes in this price range near Anderson University move quickly - schedule your showing today.
-
2026-05-11price $106,000 1016-char remark
Show marketing remark (1016 chars)
Location. Price. Opportunity. Just a 5-minute walk (2-minute drive) to Anderson University, this 3-bedroom, 2-bath home puts you in one of Anderson's most walkable and desirable corridors. Priced at $125,000, this is a rare chance for a first-time buyer to step into ownership and start building equity instead of paying rent. Homes with three bedrooms and two full baths - this close to campus - do not come to market often at this price. Minutes from downtown Anderson's shopping, dining, and entertainment, and convenient to Ascension St. Vincent Anderson, the location supports both everyday living and long-term value. Inside, the practical layout offers flexibility for guests, a home office, or shared living, with two full bathrooms providing added comfort. The manageable lot keeps maintenance simple while giving you space to personalize. Walkable to campus. Affordable entry point. Future flexibility built in. Homes in this price range near Anderson University move quickly - schedule your showing today.
-
2026-05-04price $114,900 1016-char remark
Show marketing remark (1016 chars)
Location. Price. Opportunity. Just a 5-minute walk (2-minute drive) to Anderson University, this 3-bedroom, 2-bath home puts you in one of Anderson's most walkable and desirable corridors. Priced at $125,000, this is a rare chance for a first-time buyer to step into ownership and start building equity instead of paying rent. Homes with three bedrooms and two full baths - this close to campus - do not come to market often at this price. Minutes from downtown Anderson's shopping, dining, and entertainment, and convenient to Ascension St. Vincent Anderson, the location supports both everyday living and long-term value. Inside, the practical layout offers flexibility for guests, a home office, or shared living, with two full bathrooms providing added comfort. The manageable lot keeps maintenance simple while giving you space to personalize. Walkable to campus. Affordable entry point. Future flexibility built in. Homes in this price range near Anderson University move quickly - schedule your showing today.
-
2026-02-16$125,000 Active 1016-char remark
Show marketing remark (1016 chars)
Location. Price. Opportunity. Just a 5-minute walk (2-minute drive) to Anderson University, this 3-bedroom, 2-bath home puts you in one of Anderson's most walkable and desirable corridors. Priced at $125,000, this is a rare chance for a first-time buyer to step into ownership and start building equity instead of paying rent. Homes with three bedrooms and two full baths - this close to campus - do not come to market often at this price. Minutes from downtown Anderson's shopping, dining, and entertainment, and convenient to Ascension St. Vincent Anderson, the location supports both everyday living and long-term value. Inside, the practical layout offers flexibility for guests, a home office, or shared living, with two full bathrooms providing added comfort. The manageable lot keeps maintenance simple while giving you space to personalize. Walkable to campus. Affordable entry point. Future flexibility built in. Homes in this price range near Anderson University move quickly - schedule your showing today.
-
2022-11-06status Active
-
2022-09-20status Pending
-
2022-07-29$125,000 Active
-
2015-12-03historical
-
2015-09-28price $32,500
-
2015-06-23$35,000 Active
-
2012-12-08historical
-
2012-06-08$48,000
-
2011-07-12historical
-
2011-01-11$54,900
ⓘ Source: listings_history table (triggers on properties + properties_extension) + one-shot
backfill from property_details.listing_events for pre-trigger history.
Tax reassessment forecast IN · Partial reset (capped growth)
- Current annual tax
- $1,491 · $124/mo
- Projected year-2 tax
- $1,491 · $124/mo
- Expected delta
- $0/yr ($0/mo · 0.0%)
ⓘ Screening estimate from a state-policy table — verify with the county assessor before closing.
Climate risk First Street
- Flood 1/10 Low FEMA zone X (unshaded) · 0% chance over 30 yrs
- Wildfire 1/10 Low
- Heat 3/10 Moderate 7 d/yr ≥100°F today · 18 d/yr by 30 yrs out
- Wind 2/10 Low 0% chance of damaging wind over 30 yrs
- Air quality 3/10 Moderate 2 unhealthy d/yr today · 3 by 30 yrs out
Nearby sold comps map
Loading sold comps map…
Walkable amenities ~0.75 mi
Loading nearby amenities…
Taxation est. · year 1
- Rental income
- $14,110
- − Mortgage interest
- −$4,257
- − Property taxes
- −$1,491
- − Insurance
- −$380
- − Repairs & maintenance
- −$1,129
- − Management
- −$1,129
- − Depreciation
- −$2,211
- Taxable income
- $3,513
- Est. tax owed @ 24.0%
- −$843
- After-tax cash flow
- $3,650/yr
For passive investors: Depreciation is non-cash, so a rental often shows a tax loss while cash-flowing — sheltering income. Rental losses are passive: they offset passive income freely, and up to $25,000/yr can offset ordinary (W-2) income if you actively participate and your MAGI is under $100k (phasing out to $0 by $150k); unused losses carry forward. On sale, claimed depreciation is recaptured at up to 25%, and gains may owe capital-gains tax (a 1031 exchange can defer both). Figures are a year-1 estimate at your 24.0% rate — not tax advice; consult a CPA.
Schools (NCES district)
- District
- Anderson Community School Corporation
- NCES district ID
- 1800150
- Math proficiency
- 15% ▼ -14.00%
- Reading proficiency
- 23% ▼ -7.00%
- Median HH income
- $38,208
- Composite
- 15.93/100
- National rank
- #9250
- State rank
- #280 of 301 in IN
Livability — Anderson
- Score
- 60/100
- State rank
- #521
- US rank
- #18709
Category grades
Schools grade is shown separately in the Schools card above.
Census & demographics
- Census place
- Anderson, IN
- County
- Madison County · 69,445 people
- City population
- 57,762
- Metro
- Indianapolis-Carmel-Anderson, IN
- Population (ZIP)
- 20,855
- Household income
- $58,041
- Rent vs Own
- Severe rent burden
- 987.0
Population outlook (Madison County) Hauer SSP2
- Today (2025)
- 125,800 people
- By 2030
- 122,640 · -2.5%
- By 2040
- 115,420 · -8.3%
- By 2050
- 108,148 · -14.0%
- By 2075
- 91,838 · -27.0%
- By 2100
- 75,670 · -39.8%
Race, ethnicity, and origin ACS 2023
- Neighborhood character
- Predominantly White (85%)
- Race & ethnicity
- White 85% Hispanic / Latino 5% Two or more races 4% Black 4%
- Hispanic origin (detail)
- Mexican 4%
- Common ancestry
- Slovak 3% Serbian 2% Italian 1%
- Foreign-born
- 2% · Canada, Vietnam
- Languages at home
- 96% English-only · Spanish 3%
Political lean MEDSL · Madison
- 2024 margin
- Strong R (+26.9) · D 35.6% · R 62.5% · Other 1.9%
- 2008→2024 swing
- -33.5pp toward R · 2008: 6.5pp · 2024: -26.9pp
- All cycles
- 2024: R+26.9 2020: R+22.6 2016: R+25.7 2012: R+4.5 2008: D+6.5
Not yet ingested
- Civics
- —
Market trends
- HPI YoY
- ▼ -61.16%
- Current HPI
- 266.9819
- Rent YoY
- ▲ 1.82%
- Metro
- Indianapolis-Carmel-Anderson, IN
- State GDP YoY
- ▲ 2.90%
- F500 in state
- 18
Industry mix (Fortune 500 HQ in IN)
| Industry | F500 HQs | Revenue |
|---|---|---|
| Industrial Machinery | 2 | $37B |
|
||
| Healthcare | 1 | $177B |
|
||
| Pharmaceuticals | 1 | $45B |
|
||
| Metals / Steel | 1 | $18B |
|
||
| Agriculture | 1 | $17B |
|
||
| Packaging | 1 | $12B |
|
||
Price history
+93.1% since first listed14 events — show timeline
- 2026-05-11 Pending — MIBOR as Distributed by MLS Grid
- 2026-05-11 Price Changed $106,000 MIBOR as Distributed by MLS Grid
- 2026-05-04 Price Changed $114,900 MIBOR as Distributed by MLS Grid
- 2026-02-16 Listed $125,000 MIBOR as Distributed by MLS Grid
- 2022-11-06 Relisted — MIBOR as Distributed by MLS Grid
- 2022-09-20 Pending — MIBOR as Distributed by MLS Grid
- 2022-07-29 Listed $125,000 MIBOR as Distributed by MLS Grid
- 2015-12-03 Listing Removed — MIBOR as Distributed by MLS Grid
- 2015-09-28 Price Changed $32,500 MIBOR as Distributed by MLS Grid
- 2015-06-23 Listed $35,000 MIBOR as Distributed by MLS Grid
- 2012-12-08 Listing Removed — MIBOR as Distributed by MLS Grid
- 2012-06-08 Listed $48,000 MIBOR as Distributed by MLS Grid
- 2011-07-12 Listing Removed — MIBOR as Distributed by MLS Grid
- 2011-01-11 Listed $54,900 MIBOR as Distributed by MLS Grid
Property tax history
+5.1%/yrLatest (2024): $1,491 · +8.7% YoY. Source: county tax records.
Cash-flow waterfall
monthlySold comps — $/sqft
last 12 mo · ≤1 miLoading sold comps…