 🏷️ Likely Rental
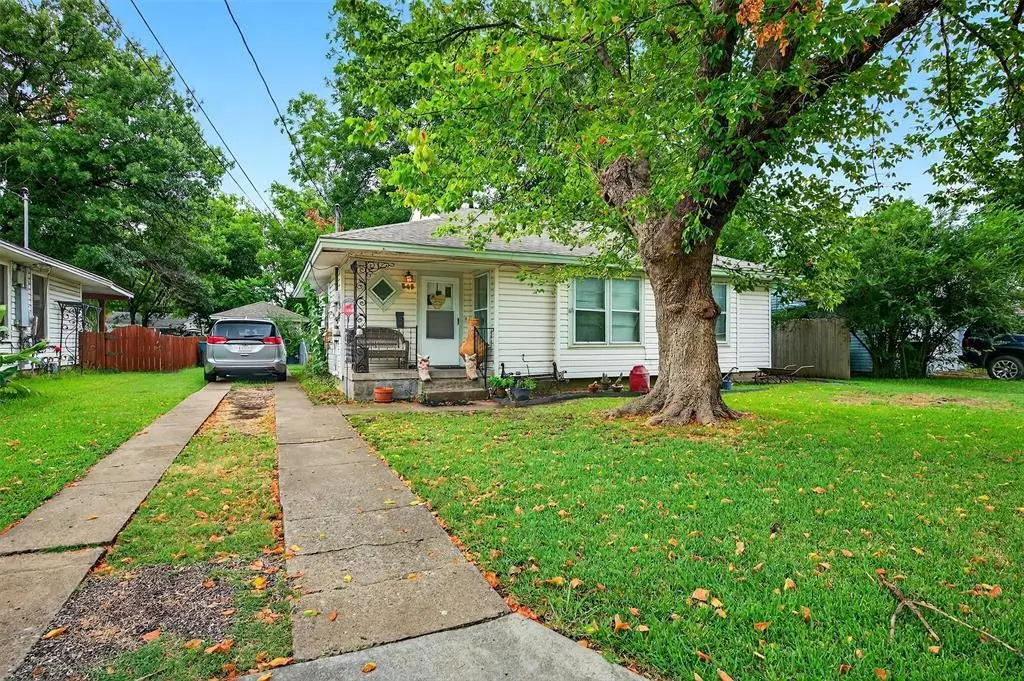
545 N Wharton St · Sherman, TX
Flood risk 4/10 · Minor
- FEMA flood zone
- X (unshaded)
- Chance of flooding over 30 yrs
- 0.22%
- Est. flood insurance / yr
- $507 – $1,088
Fire risk 6/10 · Moderate
- Est. fire insurance / yr
- $1,222 – $2,270
Heat risk 6/10 · Moderate
- Hot days now (above 108°F)
- 7 days/yr
- Hot days in 30 yrs
- 22 days/yr
Wind risk 4/10 · Minor
- Chance of severe wind over 30 yrs
- 23.0%
Air-quality risk 3/10 · Minor
- Unhealthy air days now
- 2 days/yr
- Unhealthy air days in 30 yrs
- 3 days/yr
Risk factors via First Street. Map © Google.
Why this score? — see what drove the C- grade
The composite is a weighted blend of 9 inputs, each scored 0–100. Each bar is that input's sub-score; the figure is the points it added to the 100-point composite (weight × sub-score).
- Cash flow +17.2/30.0
- ARV discount +15.0/15.0
- 1% rule +5.5/10.0
- DSCR +5.3/10.0
- Livability +3.1/5.0
- Schools +2.9/10.0
- Condition / age +2.5/5.0
- Rent growth +1.9/5.0
- Appreciation +0.0/10.0
$140,000
🖨 Deal sheet 📄 Offer letter ✓ Due diligence
Listing remarks MLS
Welcome to 545 N. Wharton! This charming 3-bedroom, 1-bath home is located on a peaceful street, perfect for families or those seeking a serene environment. Would make great investment property with rental income. Enjoy a spacious backyard — ideal for gardening, entertaining, or simply relaxing. A great opportunity in a quiet neighborhood with mature trees! Roof replaced in 2023. Foundation repaired July 2025. Tenant occupied on month-to-month basis.
Key facts
- Spacious backyard
- Foundation repaired
- Quiet neighborhood
Tags
Neighborhood map
What this means for you Summary
Snapshot
- This is a 3-bed/1.0-bath single-family listed at $140k.
Deal economics
- At list price, monthly cash flow is $99 ($1k/yr) — positive.
- The deal already cash-flows at list — no discount required.
- Meets the 1% rule at list price ($1k rent vs $140k).
- Recommended offer: $127k (9.0% below list) — sets the bar for market timing.
- Cap rate 7.1% vs local median 3.7% in Sherman — top-decile yield for the area; either an underpriced asset or a hidden risk that comps aren't pricing in. Stress-test before assuming the spread holds.
Location & tenants
- Location reads 61/100 on livability (#1,027 in TX) — a middle-class / working-renter tenant base. Strengths: cost of living A+, housing A+; Watch: crime C-, employment C-, schools D-.
- Sherman ISD (urban): math 31% / reading 37% proficiency, ranked #546 of 826 in TX (top 66%) — families likely to look elsewhere, expect single-tenant / working-renter base with shorter leases.
- Market conditions: Rents soft (-2.4%/yr); 636 active listings in the ZIP; 40 comparable units currently listed for rent nearby; rentals lingering (median 44d on market — plan ~5-8 weeks vacancy on turnover, expect pricing pressure); 60% of comp listings sitting > 30 days — soft ceiling on asking rent; 2,272 units permitted in Grayson County in 2024 (750 in 5+ unit buildings).
Forward outlook
- Local home prices are declining (-3.0%/yr); year-one equity from $968 of loan paydown is wiped out by about $4k of value loss. Plan a longer hold.
- Grayson County population projected at +12% by 2050 — modest demand growth; plan on rents tracking national, not racing it.
Negotiation context
- It's been on market 101 days — a 9% lower offer ($127k) is reasonable based on typical stale-listing flexibility.
- 4 sale attempts since 2y ago; this cycle's ask has dropped $20k (12%) from the opening price — seller is motivated, your offer sets the floor, not the list.
Risks & watch-outs
- Watch-outs: built in 1920 — expect roof / HVAC / electrical / plumbing capex.
- Climate carrying-cost: major wildfire risk; extreme-heat days projected 7→22/yr by 2055 (HVAC capex compounding) — expect insurance premiums to compound above CPI over the hold.
Questions for the listing agent
- It's been on market 101 days. Have you received any prior offers? Is the seller open to a 9% concession, seller financing, or rate buy-down credit?
- Built in 1920 — when were the roof, HVAC, electrical panel, plumbing, and water heater last replaced?
- Why hasn't it sold? Are there any deal-killer items the seller is aware of (foundation, flood, title, zoning, code violations)?
- Is there a deadline driving the sale (1031 exchange, divorce, estate, relocation)? That informs how much negotiation room exists.
- Schools are D-rated, which usually means shorter tenancies and higher turnover. Who's the typical renter profile here, and what's been the actual vacancy rate?
- What's the average days-on-market for RENTAL listings here right now (not sales)? A rising rental-DOM trend means longer vacancies and softer asking-rent achievability than the comps imply.
- What's the recent tenant-quality profile in this submarket — average credit score on applications, eviction rate, late-payment / NSF rate, and stable-employment percentage? A property-management company in the area should have these aggregated.
- How much new for-sale + rental construction is in the pipeline within 1–3 miles? Heavy new supply typically softens prices + rents 12–24 months out; constrained supply supports both.
Investment metrics
- 1% rule
- 1.05% ✓
- Cap rate
- 7.14%
- Cash-on-cash
- 3.02%
- DSCR
- 1.13
- GRM
- 7.9
CMA / ARV
- ARV (median comp)
- $198,130
- List price
- $140,000
- Delta
- -29.34%
- Verdict
- UNDERPRICED
- Comps
- 20 within 1.0 mi
Show comp detail 12 sales within ~0.75 mi
| Address | Dist | Beds/Ba | Sqft | Sold | Price | $/sf | Match |
|---|---|---|---|---|---|---|---|
| 646 Denton Dr | 0.12mi | 3/1.5 | 1,191 (-5%) | 4mo | $199,900 | $168 | 81 |
| 902 N Woods St | 0.27mi | 3/1.5 | 1,262 (+1%) | 8mo | $225,000 | $178 | 77 |
| 1402 Hillcrest Dr | 0.40mi | 3/1.5 | 1,216 (-3%) | 8mo | $177,500 | $146 | 68 |
| 900 W Sycamore St | 0.39mi | 3/1.0 | 1,140 (-9%) | 2mo | $160,000 | $140 | 65 |
| 1318 Kessler Blvd | 0.51mi | 2/2.0 (-1) | 1,224 (-2%) | 6mo | $224,800 | $184 | 59 |
| 1003 Blanton Dr | 0.70mi | 3/2.0 | 1,221 (-2%) | 6mo | $209,740 | $172 | 54 |
| 318 N Mckown Ave | 0.38mi | 2/1.0 (-1) | 1,100 (-12%) | 7mo | $200,000 | $182 | 51 |
| 1517 N Highland Ave | 0.60mi | 3/1.0 | 1,100 (-12%) | 5mo | $179,000 | $163 | 48 |
| 1409 N Highland Ave | 0.50mi | 4/3.0 (+1) | 1,370 (+10%) | 2mo | $189,900 | $139 | 46 |
| 1518 N Ricketts St | 0.60mi | 2/1.0 (-1) | 1,144 (-9%) | 9mo | $189,900 | $166 | 46 |
| 1511 N Alexander St | 0.69mi | 3/2.0 | 1,414 (+13%) | 1mo | $282,500 | $200 | 42 |
| 1706 N Ricketts St | 0.74mi | 3/2.0 | 1,106 (-12%) | 8mo | $129,900 | $117 | 35 |
Match score weights: distance 35% · size 25% · config 20% · recency 20%. Top-matched comps best support the ARV.
Projected returns pro-forma
-3.0% appreciation · 0.0% rent growth · sell at horizon
- IRR
- -15.2%
- Equity multiple
- 0.47×
- Total profit
- $-20,638
- Equity at exit
- $20,874
- IRR
- -13.5%
- Equity multiple
- 0.33×
- Total profit
- $-26,236
- Equity at exit
- $12,105
Cash invested: $39,200 (down + closing). Projections, not guarantees.
Landlord ↔ Tenant lean methodology
- Overall (STATE)
- 87 Strongly Landlord-Friendly
- State Texas
- 87 Strongly Landlord-Friendly · R+5
- County
- — inherits STATE
- City
- — inherits STATE
ZIP-level market 75092
- Rents YoY
- -2.4%
- Active inventory
- 636
- Price-to-rent
- 7.9×
Monthly cashflow live
- Estimated rent
- $1,474 high interval (Pro) →
- Mortgage (P&I)
- −$734
- Tax from tax record
- −$273 /mo · $3,277/yr
- Insurance
- −$58
- HOA
- −$0
- Vacancy / Maint / Mgmt
- −$309
- Net cashflow
- $99
Break-even live
UW: 25.0% down · 7.5% · 30yr · 1.5% tax · 5.0% vac · 8.0% maint · 8.0% mgmt
Financing live
Cash to close
- Down payment
- $35,000
- Closing costs
- $4,200
- Reserves months
- —
- Total cash needed
- —
Loan-product check · same deal, 3 products live
Conventional
25% down · 7.5% · 30yr
- Down + closing
- —
- Monthly P&I
- —
- Monthly cashflow
- —
- DSCR
- —
- Eligible?
- —
Personal DTI + credit; lowest rate.
DSCR
20% down · 8.5% · 30yr
- Down + closing
- —
- Monthly P&I
- —
- Monthly cashflow
- —
- DSCR
- —
- Eligible?
- —
No personal income docs; deal must DSCR.
Hard money
10% down · 12.0% · 12mo
- Down + closing
- —
- Monthly P&I
- —
- Monthly cashflow
- —
- DSCR
- —
- Eligible?
- —
Short-term bridge; refi at stabilization.
Rent comps 40 comps
| Address | Beds | Baths | Sqft | Rent | $/sqft | DOM | Units | Dist |
|---|---|---|---|---|---|---|---|---|
| 930 W Freeman St Sherman, TX | 3.0 | 2.0 | 1222 | $1,499 | $1.23 | 21d | 1 | 0.09mi |
| 914 W Washington St Unit F Sherman, TX | 2.0 | 1.5 | 1287 | $1,165 | $0.91 | 44d | 1 | 0.13mi |
| 524-526 N Woods St Sherman, TX | 3.0 | 2.0 | 1454 | $1,445 | $0.99 | 44d | 1 | 0.21mi |
| 814 W College St Sherman, TX | 2.0 | 2.0 | 1100 | $1,150 | $1.05 | 44d | 1 | 0.27mi |
| 214 N Ricketts St Sherman, TX | 3.0 | 2.0 | 1211 | $1,550 | $1.28 | 44d | 1 | 0.30mi |
| 822 W Fischer St Sherman, TX | 3.0 | 1.0 | 1256 | $1,350 | $1.07 | 21d | 1 | 0.31mi |
| 207 N Highland Ave Sherman, TX | 2.0 | 1.0 | 1175 | $1,300 | $1.11 | 44d | 1 | 0.32mi |
| 820 N Sam Rayburn Fwy Unit 204 Sherman, TX | 2.0 | 1.5 | 1027 | $1,350 | $1.31 | 44d | 1 | 0.37mi |
| 1402 Hillcrest Dr Sherman, TX | 3.0 | 1.5 | 1216 | $1,595 | $1.31 | 44d | 1 | 0.37mi |
| 907 W Birge St Sherman, TX | 2.0 | 2.0 | 952 | $1,100 | $1.16 | 44d | 1 | 0.38mi |
| 906 W Houston St Sherman, TX | 2.0 | 1.0 | 989 | $1,175 | $1.19 | 44d | 1 | 0.41mi |
| 908 W Houston St Sherman, TX | 2.0 | 1.0 | 989 | $1,299 | $1.31 | 21d | 1 | 0.42mi |
| 103 S Highland Ave Sherman, TX | 3.0 | 3.0 | 1766 | $1,950 | $1.10 | 44d | 1 | 0.43mi |
| 106 N McKown Ave Sherman, TX | 2.0 | 1.0 | 1066 | $1,050 | $0.98 | 21d | 1 | 0.46mi |
| 817 W Lamar St Sherman, TX | 3.0 | 2.0 | 1074 | $1,495 | $1.39 | 44d | 1 | 0.46mi |
| 324 Tolbert Ave Sherman, TX | 3.0 | 2.5 | 1700 | $1,650 | $0.97 | 44d | 1 | 0.46mi |
| 1014 W Belden St Sherman, TX | 3.0 | 2.0 | 1573 | $1,599 | $1.02 | 21d | 1 | 0.48mi |
| 114 S Holly Ave Sherman, TX | 3.0 | 1.5 | 1440 | $1,195 | $0.83 | 44d | 1 | 0.54mi |
| 1404 Park Pl Sherman, TX | 3.0 | 2.0 | 1150 | $1,400 | $1.22 | 44d | 1 | 0.67mi |
| 815 N Travis St Sherman, TX | 3.0 | 2.0 | 1536 | $1,550 | $1.01 | 21d | 1 | 0.67mi |
| 1505 Park Pl Sherman, TX | 3.0 | 2.0 | 1645 | $1,675 | $1.02 | 44d | 1 | 0.69mi |
| 221 Archer Dr Sherman, TX | 1.0–3.0 | 1.0–2.0 | 1000 | $1,399 | $1.40 | 21d | 9 | 0.70mi |
| 620 N Walnut St Sherman, TX | 2.0 | 1.0 | 1100 | $1,050 | $0.95 | 44d | 1 | 0.71mi |
| 1800 W Washington St Sherman, TX | 1.0–3.0 | 1.0–2.0 | 918 | $1,100 | $1.20 | 21d | 77 | 0.72mi |
| 1920 W Shields Dr Sherman, TX | 1.0–2.0 | 1.0–2.0 | 800 | $1,150 | $1.44 | 21d | 2 | 0.72mi |
| 1312 N Travis St Sherman, TX | 3.0 | 1.5 | 1086 | $1,325 | $1.22 | 44d | 1 | 0.74mi |
| 1706 N Ricketts St Sherman, TX | 3.0 | 2.0 | 1106 | $1,600 | $1.45 | 21d | 1 | 0.77mi |
| 1200 W Taylor St Sherman, TX | 1.0–2.0 | 1.0–2.0 | 814 | $849 | $1.04 | 21d | 42 | 0.79mi |
| 301 E Brockett St Unit 100 Sherman, TX | 4.0 | 4.0 | 1169 | $1,400 | $1.20 | 44d | 1 | 0.80mi |
| 1712 W Birge St Sherman, TX | 3.0 | 2.0 | 1260 | $1,695 | $1.35 | 44d | 1 | 0.80mi |
| 1809 Park Pl Sherman, TX | 3.0 | 2.0 | 1326 | $1,425 | $1.07 | 21d | 1 | 0.82mi |
| 1811 Park Pl Sherman, TX | 3.0 | 2.0 | 1326 | $1,425 | $1.07 | 21d | 1 | 0.83mi |
| 1811 W College St Sherman, TX | 3.0 | 1.0 | 1150 | $1,395 | $1.21 | 44d | 1 | 0.85mi |
| 823 N Branch St Sherman, TX | 3.0 | 2.0 | 1357 | $1,650 | $1.22 | 21d | 1 | 0.88mi |
| 1350 W Taylor St Sherman, TX | 1.0–3.0 | 1.0–2.0 | 1153 | $2,250 | $1.95 | 21d | 129 | 0.91mi |
| 514 E Brockett St Unit 514 Sherman, TX | 4.0 | 4.5 | 1800 | $1,800 | $1.00 | 44d | 1 | 0.97mi |
| 110-112 W Fairview St Sherman, TX | 2.0 | 1.5 | 1200 | $1,200 | $1.00 | 44d | 1 | 1.00mi |
| 1916 N Alexander St Sherman, TX | 3.0 | 2.0 | 1240 | $1,575 | $1.27 | 44d | 1 | 1.02mi |
| 221 W Taylor St Sherman, TX | 3.0 | 2.0 | 917 | $1,425 | $1.55 | 21d | 1 | 1.04mi |
| 2111 Wyldewood Way Sherman, TX | 3.0 | 2.0 | 1433 | $1,950 | $1.36 | 44d | 1 | 1.05mi |
Listing history 28 events
-
2026-06-19days on market $140,000 Active 101 DOM
-
2026-06-18days on market $140,000 Active 100 DOM
-
2026-06-17days on market $140,000 Active 99 DOM
-
2026-06-16days on market $140,000 Active 98 DOM
-
2026-06-15days on market $140,000 Active 97 DOM
-
2026-06-14days on market $140,000 Active 95 DOM
-
2026-06-13days on market $140,000 Active 94 DOM
-
2026-06-10days on market $140,000 Active 92 DOM
-
2026-06-09days on market $140,000 Active 91 DOM
-
2026-06-08days on market $140,000 Active 90 DOM
-
2026-06-07days on market $140,000 Active 89 DOM
-
2026-06-03days on market $140,000 Active 85 DOM
-
2026-06-02days on market $140,000 Active 84 DOM
-
2026-06-01days on market $140,000 Active 83 DOM
-
2026-05-31days on market $140,000 Active 82 DOM
-
2026-05-30days on market $140,000 Active 81 DOM
-
2026-05-19price $140,000 463-char remark
Show marketing remark (463 chars)
Welcome to 545 N. Wharton! This charming 3-bedroom, 1-bath home is located on a peaceful street, perfect for families or those seeking a serene environment. Would make great investment property with rental income. Enjoy a spacious backyard — ideal for gardening, entertaining, or simply relaxing. A great opportunity in a quiet neighborhood with mature trees! Roof replaced in 2023. Foundation repaired July 2025. Tenant occupied on month-to-month basis.
-
2026-04-25price $145,000 463-char remark
Show marketing remark (463 chars)
Welcome to 545 N. Wharton! This charming 3-bedroom, 1-bath home is located on a peaceful street, perfect for families or those seeking a serene environment. Would make great investment property with rental income. Enjoy a spacious backyard — ideal for gardening, entertaining, or simply relaxing. A great opportunity in a quiet neighborhood with mature trees! Roof replaced in 2023. Foundation repaired July 2025. Tenant occupied on month-to-month basis.
-
2026-04-06price $150,000 463-char remark
Show marketing remark (463 chars)
Welcome to 545 N. Wharton! This charming 3-bedroom, 1-bath home is located on a peaceful street, perfect for families or those seeking a serene environment. Would make great investment property with rental income. Enjoy a spacious backyard — ideal for gardening, entertaining, or simply relaxing. A great opportunity in a quiet neighborhood with mature trees! Roof replaced in 2023. Foundation repaired July 2025. Tenant occupied on month-to-month basis.
-
2026-03-10$160,000 Active 463-char remark
Show marketing remark (463 chars)
Welcome to 545 N. Wharton! This charming 3-bedroom, 1-bath home is located on a peaceful street, perfect for families or those seeking a serene environment. Would make great investment property with rental income. Enjoy a spacious backyard — ideal for gardening, entertaining, or simply relaxing. A great opportunity in a quiet neighborhood with mature trees! Roof replaced in 2023. Foundation repaired July 2025. Tenant occupied on month-to-month basis.
-
2025-11-17historical
-
2025-11-07status Active
-
2025-11-06historical
-
2025-08-07$180,000 Active
-
2024-09-13historical
-
2024-06-26$170,000 Active
-
2014-12-16soldstatus
-
1988-04-15soldstatus
ⓘ Source: listings_history table (triggers on properties + properties_extension) + one-shot
backfill from property_details.listing_events for pre-trigger history.
Tax reassessment forecast TX · Resets to sale price
- Current annual tax
- $3,277 · $273/mo
- Projected year-2 tax
- $3,277 · $273/mo
- Expected delta
- $0/yr ($0/mo · 0.0%)
ⓘ Screening estimate from a state-policy table — verify with the county assessor before closing.
Climate risk First Street
- Flood 4/10 Moderate FEMA zone X (unshaded) · 22% chance over 30 yrs
- Wildfire 6/10 Major
- Heat 6/10 Major 7 d/yr ≥108°F today · 22 d/yr by 30 yrs out
- Wind 4/10 Moderate 23% chance of damaging wind over 30 yrs
- Air quality 3/10 Moderate 2 unhealthy d/yr today · 3 by 30 yrs out
Nearby sold comps map
Loading sold comps map…
Walkable amenities ~0.75 mi
Loading nearby amenities…
Taxation est. · year 1
- Rental income
- $17,686
- − Mortgage interest
- −$7,842
- − Property taxes
- −$3,277
- − Insurance
- −$700
- − Repairs & maintenance
- −$1,415
- − Management
- −$1,415
- − Depreciation
- −$4,073
- Taxable loss
- −$1,036
- Est. tax savings @ 24.0%
- +$249
- After-tax cash flow
- $1,433/yr
For passive investors: Depreciation is non-cash, so a rental often shows a tax loss while cash-flowing — sheltering income. Rental losses are passive: they offset passive income freely, and up to $25,000/yr can offset ordinary (W-2) income if you actively participate and your MAGI is under $100k (phasing out to $0 by $150k); unused losses carry forward. On sale, claimed depreciation is recaptured at up to 25%, and gains may owe capital-gains tax (a 1031 exchange can defer both). Figures are a year-1 estimate at your 24.0% rate — not tax advice; consult a CPA.
Schools (NCES district)
- District
- Sherman ISD
- NCES district ID
- 4840080
- Math proficiency
- 31% ▼ -9.00%
- Reading proficiency
- 37% ▼ -2.00%
- Median HH income
- $42,587
- Composite
- 28.79/100
- National rank
- #6665
- State rank
- #546 of 826 in TX
Livability — Sherman
- Score
- 61/100
- State rank
- #1027
- US rank
- #18243
Category grades
Schools grade is shown separately in the Schools card above.
Census & demographics
- Census place
- Sherman, TX
- County
- Grayson County · 108,053 people
- City population
- 54,936
- Metro
- Sherman-Denison, TX
- Population (ZIP)
- 28,342
- Household income
- $68,036
- Rent vs Own
- Severe rent burden
- 1278.0
Population outlook (Grayson County) Hauer SSP2
- Today (2025)
- 134,540 people
- By 2030
- 138,653 · +3.1%
- By 2040
- 145,958 · +8.5%
- By 2050
- 151,218 · +12.4%
- By 2075
- 161,802 · +20.3%
- By 2100
- 159,036 · +18.2%
Race, ethnicity, and origin ACS 2023
- Neighborhood character
- Predominantly White (77%)
- Race & ethnicity
- White 77% Hispanic / Latino 10% Two or more races 8% Black 6% Asian 3%
- Hispanic origin (detail)
- Mexican 8%
- Common ancestry
- Italian 3% Slovak 3% Lithuanian 2%
- Foreign-born
- 6% · Canada, South Korea
- Languages at home
- 92% English-only · Spanish 5% Other Indo-European 1%
Political lean MEDSL · Grayson
- 2024 margin
- Solid R (+54.3) · D 22.5% · R 76.7%
- 2008→2024 swing
- -16.4pp toward R · 2008: -37.9pp · 2024: -54.3pp
- All cycles
- 2024: R+54.3 2020: R+49.9 2016: R+53.1 2012: R+48.0 2008: R+37.9
Not yet ingested
- Civics
- —
Market trends
- HPI YoY
- ▼ -201.47%
- Current HPI
- 235.984
- Rent YoY
- ▼ -2.36%
- Metro
- Sherman-Denison, TX
- State GDP YoY
- ▲ 3.95%
- F500 in state
- 110
Industry mix (Fortune 500 HQ in TX)
| Industry | F500 HQs | Revenue |
|---|---|---|
| Energy | 16 | $1,198B |
|
||
| Technology | 5 | $198B |
|
||
| Engineering / Construction | 4 | $72B |
|
||
| Energy Services | 3 | $60B |
|
||
| Utilities | 3 | $41B |
|
||
| Healthcare | 2 | $330B |
|
||
Price history
-17.6% since first listed12 events — show timeline
- 2026-05-19 Price Changed $140,000 NTREIS
- 2026-04-25 Price Changed $145,000 NTREIS
- 2026-04-06 Price Changed $150,000 NTREIS
- 2026-03-10 Listed $160,000 NTREIS
- 2025-11-17 Listing Removed — NTREIS
- 2025-11-07 Relisted — NTREIS
- 2025-11-06 Listing Removed — NTREIS
- 2025-08-07 Listed $180,000 NTREIS
- 2024-09-13 Listing Removed — NTREIS
- 2024-06-26 Listed $170,000 NTREIS
- 2014-12-16 Sold (Public Records) — Public Records
- 1988-04-15 Sold (Public Records) — Public Records
Property tax history
+5.6%/yrLatest (2025): $3,277 · +2.3% YoY. Source: county tax records.
Cash-flow waterfall
monthlySold comps — $/sqft
last 12 mo · ≤1 miLoading sold comps…