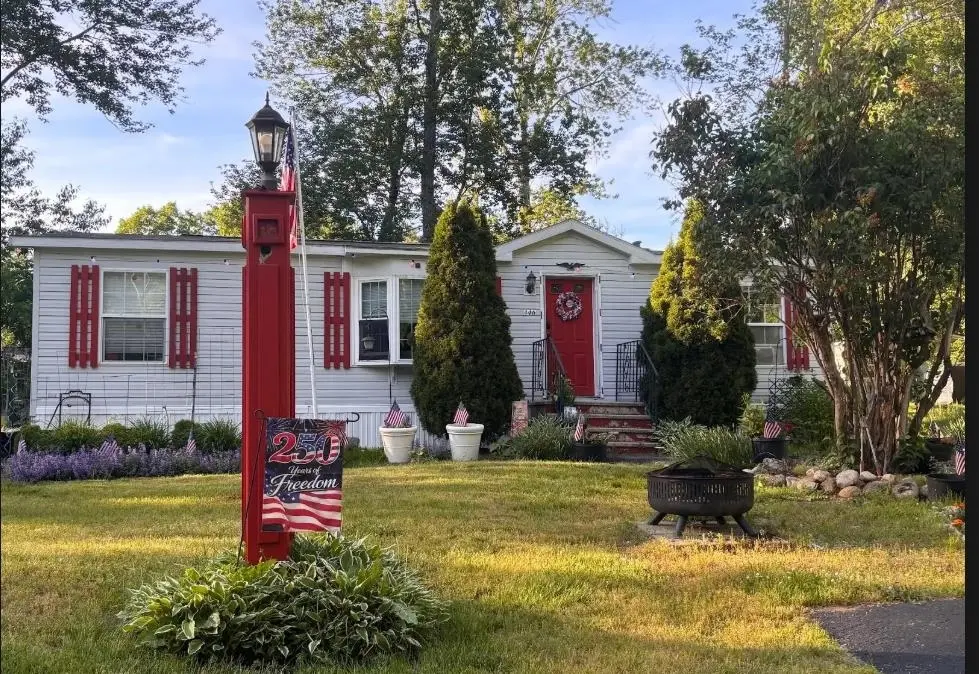
446 Emerald Dr · Barrington, NH
Flood risk 1/10 · Minimal
- FEMA flood zone
- X (unshaded)
- Chance of flooding over 30 yrs
- 0.0%
- Est. flood insurance / yr
- $507 – $1,088
Fire risk 3/10 · Minor
- Est. fire insurance / yr
- $507 – $941
Heat risk 4/10 · Minor
- Hot days now (above 96°F)
- 7 days/yr
- Hot days in 30 yrs
- 15 days/yr
Wind risk 4/10 · Minor
- Chance of severe wind over 30 yrs
- 24.0%
Air-quality risk 2/10 · Minimal
- Unhealthy air days now
- 1 days/yr
- Unhealthy air days in 30 yrs
- 2 days/yr
Risk factors via First Street. Map © Google.
Why this score? — see what drove the C- grade
The composite is a weighted blend of 9 inputs, each scored 0–100. Each bar is that input's sub-score; the figure is the points it added to the 100-point composite (weight × sub-score).
- Cash flow +13.1/30.0
- Appreciation +10.0/10.0
- 1% rule +6.7/10.0
- ARV discount +5.8/15.0
- Schools +4.2/10.0
- DSCR +3.9/10.0
- Rent growth +2.5/5.0
- Livability +2.5/5.0
- Condition / age +2.5/5.0
$194,900
🖨 Deal sheet 📄 Offer letter ✓ Due diligence
Listing remarks MLS
Live in the sought after, resident-owned community of Emerald Acres Cooperative Park! This 3 bedroom, 2 bathroom home features a large open concept kitchen perfect for entertaining. Conveniently located near the Lee traffic circle, less than 1 hour to Concord, and only a ten minute drive to the University of New Hampshire. Pets under 50 pounds allowed.
Key facts
- Built 1997
- Listed 5 days
Property features AI
Finance
- Other: Located in Emerald Acres mobile park (park approval required; co-op yes); Privately maintained road frontage
- HOA & community: Monthly association/park fee; Fee covers landscaping, sewer, trash, water and park rent; Association provides landscaping and trash removal
Exterior
- Parking: Paved driveway
- Utilities: 200 Amp electric service; Water: community/private; Sewer: 1250 gallon / community / private; Internet: high-speed available; Cable available
- Home design: Manufactured home (Manuf/Mobile style); Single-story (all main level rooms); White exterior color; Shingle - Asphalt roof
- Construction: Vinyl siding; Built in 1997; Manufactured home structure
- Exterior features: Paved driveway; Interior lot; Landscaped; Located near shopping; Leased lot (park rent)
Interior
- Kitchen: Kitchen/Dining area; Includes dishwasher, refrigerator, electric stove
- Bedrooms: Three bedrooms (all on main level)
- Flooring: Laminate
- Bathrooms: Two full bathrooms (both on main level)
- Interior features: Five total rooms; Laminate flooring
- Laundry & utility: Water heater (domestic)
Neighborhood map
What this means for you Summary
Snapshot
- This is a 3-bed/2.0-bath manufactured listed at $195k.
Deal economics
- At list price, monthly cash flow is $-8 ($-93/yr) — negative.
- To cash-flow at today's rent, offer at most $194k (0.7% below list).
- Meets the 1% rule at list price ($2k rent vs $195k).
- Recommended offer: $194k (0.7% below list) — sets the bar for cash-flow.
Location & tenants
- Location reads: area grade C — affects rentability + tenant quality, not the cash-flow math above.
- Barrington School District (rural): math 45% / reading 47% proficiency, ranked #44 of 98 in NH (top 45%) — families likely to look elsewhere, expect single-tenant / working-renter base with shorter leases; only 14% free/reduced lunch — higher-income household profile.
- Zoned schools: Barrington Elementary School (math 42% / reading 42%, grade F, #141 of 263 statewide, top 58%, 424 students, 9% FRL) — zoned schools at 9% FRL track the district average.
- Market conditions: 79 active listings in the ZIP; 951 units permitted in Strafford County in 2024 (551 in 5+ unit buildings).
Forward outlook
- In year one you build about $21k of equity ($1k loan paydown + $19k appreciation (10.0% local appreciation)).
- Strafford County population projected at +7% by 2050 — modest demand growth; plan on rents tracking national, not racing it.
- At projected returns (10.0% appreciation + 3.0% rent growth), your $55k cash investment doubles in ~3 years — after that, you're playing with house money.
- By year 2, paydown + projected appreciation supports a ~$33k cash-out refi (75% LTV) — recoverable capital for the next deal without selling this one.
Negotiation context
- Only 5 days on market — expect competitive offers; lowballing is unlikely to land.
- 4 sale attempts since 7y ago; this cycle's ask is 62% above the opening price — seller raised mid-cycle; expect resistance to lowballs.
- Current owner paid $118k; list at $195k implies a 66% gain — meaningful room to come down on a strong offer.
Risks & watch-outs
- Watch-outs: HOA is 23% of rent.
Questions for the listing agent
- What do current leases actually rent for vs. the listed asking? Can we see a recent rent roll and the last 12 months of T-12 income?
- What does the HOA fee cover, when was the last increase, and are there any pending special assessments or reserve-fund shortfalls?
- Is there a deadline driving the sale (1031 exchange, divorce, estate, relocation)? That informs how much negotiation room exists.
- What's the average days-on-market for RENTAL listings here right now (not sales)? A rising rental-DOM trend means longer vacancies and softer asking-rent achievability than the comps imply.
- What's the recent tenant-quality profile in this submarket — average credit score on applications, eviction rate, late-payment / NSF rate, and stable-employment percentage? A property-management company in the area should have these aggregated.
- How much new for-sale + rental construction is in the pipeline within 1–3 miles? Heavy new supply typically softens prices + rents 12–24 months out; constrained supply supports both.
Investment metrics
- 1% rule
- 1.17% ✓
- Cap rate
- 6.24%
- Cash-on-cash
- -0.17%
- DSCR
- 0.99
- GRM
- 7.1
CMA / ARV
- ARV (on-the-fly)
- $187,944
- Comps found
- 4
Show comp detail 4 sales within ~0.75 mi
| Address | Dist | Beds/Ba | Sqft | Sold | Price | $/sf | Match |
|---|---|---|---|---|---|---|---|
| 37 Diamond Ln | 0.15mi | 3/2.0 | 1,144 (-0%) | 18mo | $159,900 | $140 | 78 |
| 268 Emerald Dr | 0.24mi | 3/2.0 | 1,218 (+6%) | 1mo | $200,000 | $164 | 77 |
| 234 Emerald Dr | 0.31mi | 2/2.0 (-1) | 1,299 (+13%) | 4mo | $215,900 | $166 | 55 |
| 256 Emerald Dr | 0.26mi | 2/2.5 (-1) | 1,301 (+14%) | 21mo | $208,000 | $160 | 41 |
Match score weights: distance 35% · size 25% · config 20% · recency 20%. Top-matched comps best support the ARV.
Projected returns pro-forma
10.0% appreciation · 3.0% rent growth · sell at horizon
- IRR
- 24.2%
- Equity multiple
- 2.94×
- Total profit
- $105,973
- Equity at exit
- $175,581
- IRR
- 21.5%
- Equity multiple
- 6.74×
- Total profit
- $313,103
- Equity at exit
- $378,648
Cash invested: $54,572 (down + closing). Projections, not guarantees.
Landlord ↔ Tenant lean methodology
- Overall (STATE)
- 56 Moderately Landlord-Leaning
- State New Hampshire
- 56 Moderately Landlord-Leaning · D+1
- County
- — inherits STATE
- City
- — inherits STATE
ZIP-level market 03825
- Home prices YoY
- 13.7%
- Active inventory
- 79
- Price-to-rent
- 7.1×
Monthly cashflow live
- Estimated rent
- $2,286 medium interval (Pro) →
- Mortgage (P&I)
- −$1,022
- Tax from tax record
- −$196 /mo · $2,347/yr
- Insurance
- −$81
- HOA
- −$515
- Vacancy / Maint / Mgmt
- −$480
- Net cashflow
- $-8
Break-even live
UW: 25.0% down · 7.5% · 30yr · 1.5% tax · 5.0% vac · 8.0% maint · 8.0% mgmt
Financing live
Cash to close
- Down payment
- $48,725
- Closing costs
- $5,847
- Reserves months
- —
- Total cash needed
- —
Loan-product check · same deal, 3 products live
Conventional
25% down · 7.5% · 30yr
- Down + closing
- —
- Monthly P&I
- —
- Monthly cashflow
- —
- DSCR
- —
- Eligible?
- —
Personal DTI + credit; lowest rate.
DSCR
20% down · 8.5% · 30yr
- Down + closing
- —
- Monthly P&I
- —
- Monthly cashflow
- —
- DSCR
- —
- Eligible?
- —
No personal income docs; deal must DSCR.
Hard money
10% down · 12.0% · 12mo
- Down + closing
- —
- Monthly P&I
- —
- Monthly cashflow
- —
- DSCR
- —
- Eligible?
- —
Short-term bridge; refi at stabilization.
HOA detail
- Monthly dues
- $515 · $6,180/yr
Listing history 8 events
-
2026-06-18days on market $194,900 Active 5 DOM
-
2026-06-17days on market $194,900 Active 4 DOM
-
2026-06-16days on market $194,900 Active 3 DOM
-
2026-06-15days on market $194,900 Active 2 DOM
-
2026-06-13statusdays on market $194,900 Active 1 DOM
-
2026-06-13days on market $194,900 Coming Soon 3 DOM
-
2026-06-10remarks 699-char remark
-
2026-06-10$194,900 Coming Soon 1 DOM
ⓘ Source: listings_history table (triggers on properties + properties_extension) + one-shot
backfill from property_details.listing_events for pre-trigger history.
Tax reassessment forecast NH · Partial reset (capped growth)
- Current annual tax
- $2,347 · $196/mo
- Projected year-2 tax
- $3,298 · $275/mo
- Expected delta
- +$951/yr (+$79/mo · 40.5%)
ⓘ Screening estimate from a state-policy table — verify with the county assessor before closing.
Climate risk First Street
- Flood 1/10 Low FEMA zone X (unshaded) · 0% chance over 30 yrs
- Wildfire 3/10 Moderate
- Heat 4/10 Moderate 7 d/yr ≥96°F today · 15 d/yr by 30 yrs out
- Wind 4/10 Moderate 24% chance of damaging wind over 30 yrs
- Air quality 2/10 Low 1 unhealthy d/yr today · 2 by 30 yrs out
Nearby sold comps map
Loading sold comps map…
Walkable amenities ~0.75 mi
Loading nearby amenities…
Taxation est. · year 1
- Rental income
- $27,434
- − Mortgage interest
- −$10,917
- − Property taxes
- −$2,347
- − Insurance
- −$974
- − Repairs & maintenance
- −$2,195
- − Management
- −$2,195
- − HOA
- −$6,180
- − Depreciation
- −$5,670
- Taxable loss
- −$3,044
- Est. tax savings @ 24.0%
- +$731
- After-tax cash flow
- $637/yr
For passive investors: Depreciation is non-cash, so a rental often shows a tax loss while cash-flowing — sheltering income. Rental losses are passive: they offset passive income freely, and up to $25,000/yr can offset ordinary (W-2) income if you actively participate and your MAGI is under $100k (phasing out to $0 by $150k); unused losses carry forward. On sale, claimed depreciation is recaptured at up to 25%, and gains may owe capital-gains tax (a 1031 exchange can defer both). Figures are a year-1 estimate at your 24.0% rate — not tax advice; consult a CPA.
Schools (NCES district)
- District
- Barrington School District
- NCES district ID
- 3301650
- Math proficiency
- 45% ▼ -7.00%
- Reading proficiency
- 47% ▼ -11.00%
- Median HH income
- $78,443
- Composite
- 42.19/100
- National rank
- #3289
- State rank
- #44 of 98 in NH
Livability — Barrington
No livability data for this city. (Only ~50 U.S. cities are tracked.)
Census & demographics
- Population (ZIP)
- 9,420
Population outlook (Strafford County) Hauer SSP2
- Today (2025)
- 132,503 people
- By 2030
- 135,377 · +2.2%
- By 2040
- 139,609 · +5.4%
- By 2050
- 141,803 · +7.0%
- By 2075
- 149,280 · +12.7%
- By 2100
- 148,667 · +12.2%
Race, ethnicity, and origin ACS 2023
- Neighborhood character
- Predominantly White (89%)
- Race & ethnicity
- White 89% Two or more races 8% Hispanic / Latino 3% Black 2%
- Common ancestry
- Lithuanian 13% Slovak 5% Romanian 5%
- Foreign-born
- 1% · Canada
Political lean MEDSL · Strafford
- 2024 margin
- D (+12.1) · D 55.5% · R 43.5% · Other 1.0%
- 2008→2024 swing
- -8.3pp toward R · 2008: 20.4pp · 2024: 12.1pp
- All cycles
- 2024: D+12.1 2020: D+15.2 2016: D+8.6 2012: D+14.5 2008: D+20.4
Not yet ingested
- Civics
- —
Market trends
- HPI YoY
- ▲ 50.84%
- Current HPI
- 422.7577
- Rent YoY
- —
- Metro
- —
- State GDP YoY
- —
- F500 in state
- 0
Price history
+143.9% since first listed12 events — show timeline
- 2026-06-09 Coming Soon $194,900 PrimeMLS
- 2021-11-22 Sold (MLS) $117,500 PrimeMLS
- 2021-08-19 Contingent — PrimeMLS
- 2021-08-07 Relisted — PrimeMLS
- 2021-07-20 Contingent — PrimeMLS
- 2021-07-18 Relisted — PrimeMLS
- 2021-07-10 Contingent — PrimeMLS
- 2021-07-05 Listed $120,000 PrimeMLS
- 2019-05-24 Sold (Public Records) $80,000 Public Records
- 2019-05-24 Sold (MLS) $80,000 PrimeMLS
- 2019-04-03 Contingent — PrimeMLS
- 2019-03-05 Listed $79,900 PrimeMLS
Property tax history
+9.1%/yrLatest (2024): $2,347 · +4.6% YoY. Source: county tax records.
Cash-flow waterfall
monthlySold comps — $/sqft
last 12 mo · ≤1 miLoading sold comps…