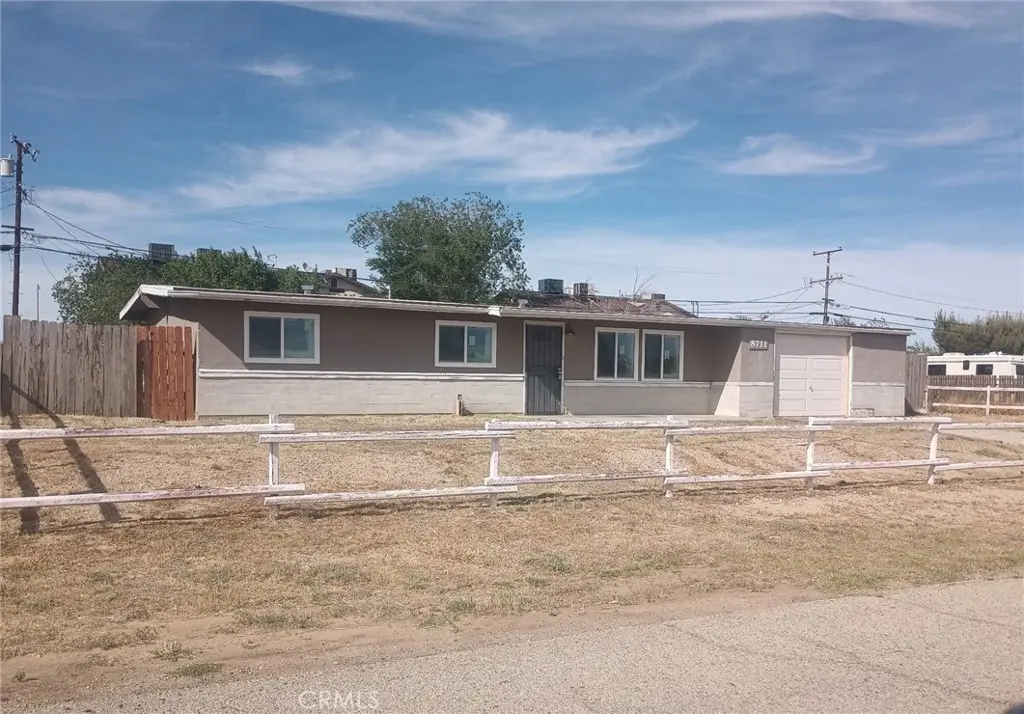
8711 Aspen · California City, CA
Flood risk 1/10 · Minimal
- FEMA flood zone
- X (unshaded)
- Chance of flooding over 30 yrs
- 0.0%
- Est. flood insurance / yr
- $507 – $1,088
Fire risk 1/10 · Minimal
- Est. fire insurance / yr
- $659 – $1,223
Heat risk 8/10 · Major
- Hot days now (above 101°F)
- 6 days/yr
- Hot days in 30 yrs
- 17 days/yr
Wind risk 1/10 · Minimal
- Chance of severe wind over 30 yrs
- —
Air-quality risk 7/10 · Major
- Unhealthy air days now
- 13 days/yr
- Unhealthy air days in 30 yrs
- 17 days/yr
Risk factors via First Street. Map © Google.
Why this score? — see what drove the D grade
The composite is a weighted blend of 9 inputs, each scored 0–100. Each bar is that input's sub-score; the figure is the points it added to the 100-point composite (weight × sub-score).
- Appreciation +10.0/10.0
- ARV discount +8.9/15.0
- Cash flow +8.1/30.0
- Rent growth +3.9/5.0
- Condition / age +2.5/5.0
- Livability +2.2/5.0
- DSCR +2.1/10.0
- Schools +2.1/10.0
- 1% rule +1.8/10.0
$235,000
🖨 Deal sheet 📄 Offer letter ✓ Due diligence
Listing remarks MLS
Welcome to 8711 Aspen Ave, this inviting home features three spacious bedrooms, ideal for families or those seeking extra space for a home office or guest accommodations. The well-appointed bathroom is designed with functionality in mind, ensuring convenience for daily living. The heart of this home is its brand-new kitchen, complete with contemporary finishes. The title floor throughout the main living areas adds a touch of elegance while ensuring easy maintenance. With numerous upgrades throughout, including fresh interior paint, this property is move-in ready, allowing you to settle in without the hassle of renovations.
Key facts
- Move-in ready
- Brand-new kitchen
- Fresh interior paint
Tags
Property features AI
Finance
- Other: Single-unit property; No accessory dwelling unit (ADU)
- HOA & community: Rural community
Exterior
- Parking: One garage space; One total parking space
- Utilities: Public/District water; Septic (type unknown)
- Home design: Attached house; One story
- Construction: Structure: House; Year built reported from public records; Two or more common walls
- Exterior features: No pool; Irregular-shaped lot; Lot size reported from assessor's data (6500–9999)
Interior
- Bedrooms: One main-level bedroom
- Bathrooms: One full bathroom
- Heating & cooling: Evaporative cooling
- Interior features: Single-level living; Ground-level entry; All bedrooms located on the main level
- Laundry & utility: Laundry area in the kitchen; Laundry available
Neighborhood map
What this means for you Summary
Snapshot
- This is a 3-bed/1.0-bath single-family listed at $235k.
Deal economics
- At list price, monthly cash flow is $-232 ($-3k/yr) — negative.
- To cash-flow at today's rent, offer at most $194k (17.5% below list).
- To meet the 1% rule (rent ≥ 1% of price), the offer needs to be $159k (32.4% below list).
- Recommended offer: $159k (32.4% below list) — sets the bar for 1% rule.
Location & tenants
- Location reads 44/100 on livability (#1,329 in CA) — a working-class tenant base; expect higher turnover. Strengths: housing A+; Watch: schools F, crime F, amenities F.
- Mojave Unified (town): math 25% / reading 25% proficiency, ranked #411 of 517 in CA (top 80%) — low school quality limits family demand, transient renter base, plan for 1-2y turnover; 76% free/reduced lunch — lower-income household profile, screen leases tightly.
- Market conditions: Rents rising fast (+5.5%/yr); 703 active listings in the ZIP; 24 comparable units currently listed for rent nearby; rentals at typical pace (median 24d on market — plan ~3-4 weeks tenant-placement turnaround); 3,244 units permitted in Kern County in 2024 (73 in 5+ unit buildings).
- This rent runs 32% of the median local income ($60k/yr) — at the standard rent-burdened threshold; future hikes will face affordability resistance.
Forward outlook
- In year one you build about $25k of equity ($2k loan paydown + $24k appreciation (10.0% local appreciation)).
- Kern County population projected at +17% by 2050 — long-run rental-demand tailwind backs the buy-and-hold thesis.
- By year 2, paydown + projected appreciation supports a ~$40k cash-out refi (75% LTV) — recoverable capital for the next deal without selling this one.
Negotiation context
- It's been on market 53 days — a 3% lower offer ($228k) is reasonable based on typical stale-listing flexibility.
- 11 sale attempts since 10y ago with the ask held roughly flat each time — persistent listings suggest the price (not the market) is what's stuck; bring a comps-based counter.
- Current owner paid $130k; list at $235k implies a 81% gain — meaningful room to come down on a strong offer.
Risks & watch-outs
- Watch-outs: built in 1959 — expect roof / HVAC / electrical / plumbing capex.
- Climate carrying-cost: extreme-heat days projected 6→17/yr by 2055 (HVAC capex compounding) — expect insurance premiums to compound above CPI over the hold.
Questions for the listing agent
- What do current leases actually rent for vs. the listed asking? Can we see a recent rent roll and the last 12 months of T-12 income?
- It's been on market 53 days. Have you received any prior offers? Is the seller open to a 32% concession, seller financing, or rate buy-down credit?
- Built in 1959 — when were the roof, HVAC, electrical panel, plumbing, and water heater last replaced?
- Is there a deadline driving the sale (1031 exchange, divorce, estate, relocation)? That informs how much negotiation room exists.
- Schools are F-rated, which usually means shorter tenancies and higher turnover. Who's the typical renter profile here, and what's been the actual vacancy rate?
- Crime grade is F in this area — have there been break-ins, vandalism, or insurance claims at this property in the last 3 years? What carrier currently insures it and at what premium?
- The area grade is low — what's the realistic commute time and amenity access for the typical tenant pool here? Any planned neighborhood developments (good or bad) we should know about?
- What's the average days-on-market for RENTAL listings here right now (not sales)? A rising rental-DOM trend means longer vacancies and softer asking-rent achievability than the comps imply.
- What's the recent tenant-quality profile in this submarket — average credit score on applications, eviction rate, late-payment / NSF rate, and stable-employment percentage? A property-management company in the area should have these aggregated.
- How much new for-sale + rental construction is in the pipeline within 1–3 miles? Heavy new supply typically softens prices + rents 12–24 months out; constrained supply supports both.
Investment metrics
- 1% rule
- 0.68% ✗
- Cap rate
- 5.11%
- Cash-on-cash
- -4.23%
- DSCR
- 0.81
- GRM
- 12.3
CMA / ARV
- ARV (median comp)
- $242,440
- List price
- $235,000
- Delta
- -3.07%
- Verdict
- FAIR
- Comps
- 20 within 1.0 mi
Show comp detail 9 sales within ~0.75 mi
| Address | Dist | Beds/Ba | Sqft | Sold | Price | $/sf | Match |
|---|---|---|---|---|---|---|---|
| 8757 N Loop Blvd | 0.40mi | 3/1.0 | 990 (+1%) | 1mo | $209,000 | $211 | 79 |
| 8651 S South Loop Boulevard Blvd | 0.18mi | 2/1.0 (-1) | 1,050 (+7%) | 8mo | $143,280 | $136 | 68 |
| 8037 Walpole Ave | 0.72mi | 3/1.0 | 1,012 (+3%) | 1mo | $153,000 | $151 | 61 |
| 20360 86th St | 0.55mi | 3/1.0 | 1,008 (+2%) | 11mo | $226,500 | $225 | 61 |
| 20661 91st St | 0.51mi | 2/1.0 (-1) | 1,018 (+4%) | 6mo | $212,834 | $209 | 60 |
| 8900 Manzanita Ave | 0.75mi | 3/1.0 | 984 (0%) | 9mo | $215,000 | $218 | 58 |
| 9037 Xavier Ave | 0.41mi | 2/1.0 (-1) | 920 (-6%) | 9mo | $200,000 | $217 | 57 |
| 20837 87th St | 0.11mi | 3/1.0 | 1,100 (+12%) | 23mo | $270,000 | $245 | 56 |
| 8318 Quezon Ave | 0.54mi | 3/1.0 | 1,000 (+2%) | 22mo | $270,000 | $270 | 54 |
Match score weights: distance 35% · size 25% · config 20% · recency 20%. Top-matched comps best support the ARV.
Projected returns pro-forma
10.0% appreciation · 5.45% rent growth · sell at horizon
- IRR
- 21.9%
- Equity multiple
- 2.78×
- Total profit
- $117,150
- Equity at exit
- $211,707
- IRR
- 20.2%
- Equity multiple
- 6.55×
- Total profit
- $365,490
- Equity at exit
- $456,553
Cash invested: $65,800 (down + closing). Projections, not guarantees.
Landlord ↔ Tenant lean methodology
- Overall (STATE)
- 18 Strongly Tenant-Friendly
- State California
- 18 Strongly Tenant-Friendly · D+13
- County
- — inherits STATE
- City
- — inherits STATE
ZIP-level market 93505
- Home prices YoY
- 13.0%
- Rents YoY
- 5.5%
- Active inventory
- 703
- Price-to-rent
- 12.3×
Monthly cashflow live
- Estimated rent
- $1,589 high interval (Pro) →
- Mortgage (P&I)
- −$1,232
- Tax from tax record
- −$157 /mo · $1,886/yr
- Insurance
- −$98
- HOA
- −$0
- Vacancy / Maint / Mgmt
- −$334
- Net cashflow
- $-232
Break-even live
UW: 25.0% down · 7.5% · 30yr · 1.5% tax · 5.0% vac · 8.0% maint · 8.0% mgmt
Financing live
Cash to close
- Down payment
- $58,750
- Closing costs
- $7,050
- Reserves months
- —
- Total cash needed
- —
Loan-product check · same deal, 3 products live
Conventional
25% down · 7.5% · 30yr
- Down + closing
- —
- Monthly P&I
- —
- Monthly cashflow
- —
- DSCR
- —
- Eligible?
- —
Personal DTI + credit; lowest rate.
DSCR
20% down · 8.5% · 30yr
- Down + closing
- —
- Monthly P&I
- —
- Monthly cashflow
- —
- DSCR
- —
- Eligible?
- —
No personal income docs; deal must DSCR.
Hard money
10% down · 12.0% · 12mo
- Down + closing
- —
- Monthly P&I
- —
- Monthly cashflow
- —
- DSCR
- —
- Eligible?
- —
Short-term bridge; refi at stabilization.
Rent comps 24 comps
| Address | Beds | Baths | Sqft | Rent | $/sqft | DOM | Units | Dist |
|---|---|---|---|---|---|---|---|---|
| 8712 California City Blvd Unit 2 California City, CA | 2.0 | 1.5 | 715 | $1,150 | $1.61 | 23d | 1 | 0.03mi |
| 8709 Xavier Ave Unit 3 California City, CA | 2.0 | 1.0 | 900 | $1,500 | $1.67 | 14d | 1 | 0.14mi |
| 8651 S Loop Blvd California City, CA | 2.0 | 1.0 | 1050 | $1,650 | $1.57 | 3d | 1 | 0.18mi |
| 8655 N Loop Blvd Unit A California City, CA | 2.0 | 1.0 | 850 | $1,800 | $2.12 | 23d | 1 | 0.21mi |
| 8531 Columbine Ave Unit B California City, CA | 2.0 | 2.0 | 1000 | $1,300 | $1.30 | 14d | 1 | 0.23mi |
| 8816 Fuchsia Ave Unit PASSTHROUGH B California City, CA | 2.0 | 2.0 | 1077 | $1,550 | $1.44 | 14d | 1 | 0.32mi |
| 20912 83rd St Unit C California City, CA | 2.0 | 1.0 | 784 | $1,150 | $1.47 | 23d | 1 | 0.38mi |
| 20961 83rd St Unit 6 California City, CA | 2.0 | 2.0 | 1100 | $1,300 | $1.18 | 23d | 1 | 0.40mi |
| 8318 Dogbane Ave Unit F California City, CA | 2.0 | 1.0 | 880 | $1,350 | $1.53 | 23d | 1 | 0.47mi |
| 21113 Nemophilia St Unit C California City, CA | 2.0 | 1.0 | 761 | $1,250 | $1.64 | 23d | 1 | 0.49mi |
| 21411 Hacienda Blvd Unit D California City, CA | 2.0 | 2.0 | 898 | $1,475 | $1.64 | 23d | 1 | 0.72mi |
| 9387 N Loop Blvd California City, CA | 2.0 | 1.0 | 807 | $1,150 | $1.43 | 23d | 1 | 0.84mi |
| 20001 Airway Blvd California City, CA | 3.0 | 2.0 | 1050 | $2,400 | $2.29 | 23d | 1 | 0.92mi |
| 7819 Walpole Ave California City, CA | 2.0 | 1.0 | 900 | $1,399 | $1.55 | 23d | 1 | 0.94mi |
| 21001 Berry St Unit 5 California City, CA | 2.0 | 1.0 | 890 | $1,150 | $1.29 | 23d | 1 | 1.06mi |
| 7617 California City Blvd Apt B California City, CA | 2.0 | 1.0 | 894 | $1,225 | $1.37 | 3d | 1 | 1.09mi |
| 9749 N Loop Blvd California City, CA | 2.0 | 1.0 | 900 | $1,350 | $1.50 | 11d | 1 | 1.20mi |
| 9749 N Loop Blvd California City, CA | 2.0 | 1.0 | 900 | $1,350 | $1.50 | 23d | 1 | 1.20mi |
| 9749 N Loop Blvd California City, CA | 2.0 | 1.0 | 900 | $1,350 | $1.50 | 3d | 1 | 1.20mi |
| 9817 N Loop Blvd California City, CA | 2.0 | 1.5 | 850 | $1,075 | $1.26 | 2d | 1 | 1.25mi |
| 9825 N Loop Blvd Unit B California City, CA | 2.0 | 1.0 | 883 | $1,350 | $1.53 | 19d | 1 | 1.26mi |
| 9848 Sally Ave Unit 2 California City, CA | 2.0 | 1.0 | 980 | $1,495 | $1.53 | 23d | 1 | 1.31mi |
| 9933 N Loop Blvd Unit B California City, CA | 2.0 | 2.0 | 895 | $1,875 | $2.09 | 23d | 1 | 1.36mi |
| 21306 Bancroft Ct California City, CA | 2.0 | 2.0 | 906 | $1,800 | $1.99 | 3d | 1 | 1.42mi |
Listing history 50 events
-
2026-06-18days on market $235,000 Active 53 DOM
-
2026-06-17days on market $235,000 Active 52 DOM
-
2026-06-16days on market $235,000 Active 51 DOM
-
2026-06-15days on market $235,000 Active 50 DOM
-
2026-06-14days on market $235,000 Active 48 DOM
-
2026-06-13days on market $235,000 Active 47 DOM
-
2026-06-10days on market $235,000 Active 45 DOM
-
2026-06-09days on market $235,000 Active 44 DOM
-
2026-06-08days on market $235,000 Active 43 DOM
-
2026-06-07days on market $235,000 Active 42 DOM
-
2026-06-05days on market $235,000 Active 39 DOM
-
2026-06-03days on market $235,000 Active 38 DOM
-
2026-06-03days on market $235,000 Active 37 DOM
-
2026-06-01days on market $235,000 Active 36 DOM
-
2026-05-31days on market $235,000 Active 35 DOM
-
2026-04-26$235,000 Active 629-char remark
-
2026-04-09$235,000 Active 630-char remark
Show marketing remark (630 chars)
Welcome to 8711 Aspen Ave, this inviting home features three spacious bedrooms, ideal for families or those seeking extra space for a home office or guest accommodations. The well-appointed bathroom is designed with functionality in mind, ensuring convenience for daily living. The heart of this home is its brand-new kitchen, complete with contemporary finishes. The title floor throughout the main living areas adds a touch of elegance while ensuring easy maintenance. With numerous upgrades throughout, including fresh interior paint, this property is move-in ready, allowing you to settle in without the hassle of renovations.
-
2022-07-22historical
-
2022-06-06$225,000 Active
-
2021-03-09soldstatus $129,999 Closed
-
2021-03-09soldstatus $130,000
-
2021-02-05price $129,999
-
2021-02-05price $129,900
-
2021-02-02price $129,000
-
2021-01-01$120,000 Active
-
2020-08-13historical
-
2020-03-24status Active
-
2020-03-17status Pending
-
2020-03-06price $110,000
-
2020-02-24price $105,000
-
2020-02-07price $110,000
-
2020-02-07price $119,000
-
2020-02-07price $114,900
-
2020-02-06$110,000 Active
-
2018-06-11soldstatus $65,000 Closed
-
2018-06-11soldstatus $65,000 Closed Sale
-
2018-06-05soldstatus $65,000
-
2018-05-10status Pending Sale
-
2018-05-10status Pending
-
2018-04-12$65,000 Active
-
2017-12-27historical
-
2017-12-26status Pending Sale
-
2017-12-26status Pending
-
2017-12-26historical
-
2017-10-30price $70,000
-
2017-10-30price $70,000
-
2017-07-27$74,900 Active
-
2017-07-27$74,900 Active
-
2016-12-13historical
-
2016-12-13historical
ⓘ Source: listings_history table (triggers on properties + properties_extension) + one-shot
backfill from property_details.listing_events for pre-trigger history.
Tax reassessment forecast CA · Resets to sale price
- Current annual tax
- $1,886 · $157/mo
- Projected year-2 tax
- $1,886 · $157/mo
- Expected delta
- $0/yr ($0/mo · 0.0%)
ⓘ Screening estimate from a state-policy table — verify with the county assessor before closing.
Climate risk First Street
- Flood 1/10 Low FEMA zone X (unshaded) · 0% chance over 30 yrs
- Wildfire 1/10 Low
- Heat 8/10 Severe 6 d/yr ≥101°F today · 17 d/yr by 30 yrs out
- Wind 1/10 Low
- Air quality 7/10 Severe 13 unhealthy d/yr today · 17 by 30 yrs out
Nearby sold comps map
Loading sold comps map…
Walkable amenities ~0.75 mi
Loading nearby amenities…
Taxation est. · year 1
- Rental income
- $19,067
- − Mortgage interest
- −$13,164
- − Property taxes
- −$1,886
- − Insurance
- −$1,175
- − Repairs & maintenance
- −$1,525
- − Management
- −$1,525
- − Depreciation
- −$6,836
- Taxable loss
- −$7,045
- Est. tax savings @ 24.0%
- +$1,691
- After-tax cash flow
- $-1,096/yr
For passive investors: Depreciation is non-cash, so a rental often shows a tax loss while cash-flowing — sheltering income. Rental losses are passive: they offset passive income freely, and up to $25,000/yr can offset ordinary (W-2) income if you actively participate and your MAGI is under $100k (phasing out to $0 by $150k); unused losses carry forward. On sale, claimed depreciation is recaptured at up to 25%, and gains may owe capital-gains tax (a 1031 exchange can defer both). Figures are a year-1 estimate at your 24.0% rate — not tax advice; consult a CPA.
Schools (NCES district)
- District
- Mojave Unified
- NCES district ID
- 0625230
- Math proficiency
- 25% ▲ 11.00%
- Reading proficiency
- 25% ▼ -1.00%
- Median HH income
- $43,017
- Composite
- 21.4/100
- National rank
- #8350
- State rank
- #411 of 517 in CA
Livability — California City
- Score
- 44/100
- State rank
- #1329
- US rank
- #26753
Category grades
Schools grade is shown separately in the Schools card above.
Census & demographics
- Census place
- California City, CA
- County
- Kern County · 710,371 people
- City population
- 14,353
- Metro
- Bakersfield, CA
- Population (ZIP)
- 14,353
- Household income
- $59,827
- Rent vs Own
- Severe rent burden
- 883.0
Population outlook (Kern County) Hauer SSP2
- Today (2025)
- 947,286 people
- By 2030
- 978,984 · +3.3%
- By 2040
- 1,045,018 · +10.3%
- By 2050
- 1,105,232 · +16.7%
- By 2075
- 1,229,538 · +29.8%
- By 2100
- 1,238,059 · +30.7%
Race, ethnicity, and origin ACS 2023
- Neighborhood character
- Highly diverse neighborhood (Simpson 0.70)
- Race & ethnicity
- Hispanic / Latino 40% White 30% Black 22% Two or more races 16% Native American 3% Asian 1%
- Hispanic origin (detail)
- Mexican 29%
- Common ancestry
- Italian 3% Lithuanian 1% Romanian 1%
- Foreign-born
- 13% · Canada, Dominican Republic
- Languages at home
- 68% English-only · Spanish 29%
Political lean MEDSL · Kern
- 2024 margin
- Strong R (+21.1) · D 38.2% · R 59.3% · Other 2.5%
- 2008→2024 swing
- -3.3pp toward R · 2008: -17.8pp · 2024: -21.1pp
- All cycles
- 2024: R+21.1 2020: R+10.2 2016: R+15.0 2012: R+20.9 2008: R+17.8
Not yet ingested
- Civics
- —
Market trends
- HPI YoY
- ▲ 46.32%
- Current HPI
- 402.4192
- Rent YoY
- ▲ 5.45%
- Metro
- Bakersfield, CA
- State GDP YoY
- ▲ 3.21%
- F500 in state
- 116
Industry mix (Fortune 500 HQ in CA)
| Industry | F500 HQs | Revenue |
|---|---|---|
| Technology | 27 | $1,492B |
|
||
| Financial Services | 3 | $174B |
|
||
| Retail | 3 | $44B |
|
||
| Insurance | 3 | $26B |
|
||
| Media / Entertainment | 2 | $115B |
|
||
| Pharmaceuticals / Biotech | 2 | $62B |
|
||
Price history
+244.0% since first listed39 events — show timeline
- 2026-06-19 Price Changed $215,000 AVMLS
- 2026-06-19 Price Changed $215,000 CRMLS
- 2026-04-26 Listed $235,000 CRMLS
- 2026-04-09 Listed $235,000 AVMLS
- 2022-07-22 Listing Removed — CRMLS
- 2022-06-06 Listed $225,000 CRMLS
- 2021-03-09 Sold (Public Records) $130,000 Public Records
- 2021-03-09 Sold (MLS) $129,999 AVMLS
- 2021-02-05 Price Changed $129,999 AVMLS
- 2021-02-05 Price Changed $129,900 AVMLS
- 2021-02-02 Price Changed $129,000 AVMLS
- 2021-01-01 Listed $120,000 AVMLS
- 2020-08-13 Listing Removed — AVMLS
- 2020-03-24 Relisted — AVMLS
- 2020-03-17 Pending — AVMLS
- 2020-03-06 Price Changed $110,000 AVMLS
- 2020-02-24 Price Changed $105,000 AVMLS
- 2020-02-07 Price Changed $110,000 AVMLS
- 2020-02-07 Price Changed $119,000 AVMLS
- 2020-02-07 Price Changed $114,900 AVMLS
- 2020-02-06 Listed $110,000 AVMLS
- 2018-06-11 Sold (MLS) $65,000 AVMLS
- 2018-06-11 Sold (MLS) $65,000 CRMLS
- 2018-06-05 Sold (Public Records) $65,000 Public Records
- 2018-05-10 Pending — CRMLS
- 2018-05-10 Pending — AVMLS
- 2018-04-12 Listed $65,000 AVMLS
- 2017-12-27 Listing Removed — AVMLS
- 2017-12-26 Pending — CRMLS
- 2017-12-26 Pending — AVMLS
- 2017-12-26 Listing Removed — CRMLS
- 2017-10-30 Price Changed $70,000 AVMLS
- 2017-10-30 Price Changed $70,000 CRMLS
- 2017-07-27 Listed $74,900 CRMLS
- 2017-07-27 Listed $74,900 AVMLS
- 2016-12-13 Listing Removed — AVMLS
- 2016-12-13 Listing Removed — CRMLS
- 2016-07-20 Listed $62,500 AVMLS
- 2016-07-19 Listed $62,500 CRMLS
Property tax history
+12.4%/yrLatest (2025): $1,886 · -5.0% YoY. Source: county tax records.
Cash-flow waterfall
monthlySold comps — $/sqft
last 12 mo · ≤1 miLoading sold comps…