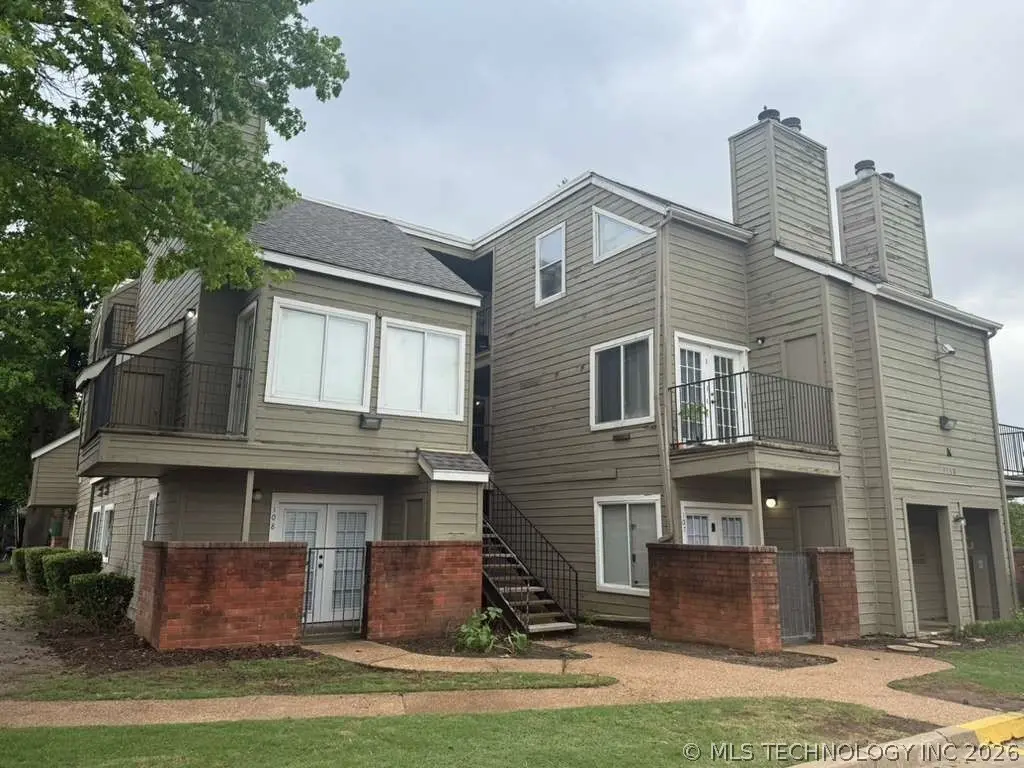
1730 E 67th St S Unit K204 · Tulsa, OK
Flood risk 1/10 · Minimal
- FEMA flood zone
- X (shaded)
- Chance of flooding over 30 yrs
- 0.0%
- Est. flood insurance / yr
- $473 – $860
Fire risk 3/10 · Minor
- Est. fire insurance / yr
- $2,463 – $4,575
Heat risk 7/10 · Major
- Hot days now (above 112°F)
- 7 days/yr
- Hot days in 30 yrs
- 19 days/yr
Wind risk 2/10 · Minimal
- Chance of severe wind over 30 yrs
- 4.0%
Air-quality risk 3/10 · Minor
- Unhealthy air days now
- 2 days/yr
- Unhealthy air days in 30 yrs
- 3 days/yr
Risk factors via First Street. Map © Google.
Why this score? — see what drove the C- grade
The composite is a weighted blend of 9 inputs, each scored 0–100. Each bar is that input's sub-score; the figure is the points it added to the 100-point composite (weight × sub-score).
- Cash flow +19.8/30.0
- 1% rule +10.0/10.0
- ARV discount +7.5/15.0
- DSCR +6.3/10.0
- Livability +3.8/5.0
- Rent growth +2.7/5.0
- Condition / age +2.5/5.0
- Schools +0.8/10.0
- Appreciation +0.0/10.0
$59,900
🖨 Deal sheet 📄 Offer letter ✓ Due diligence
Listing remarks MLS
Back on Market through no fault of Seller! Completely renovated with fresh paint, new flooring, new stove and dishwasher. Close to shopping, parks, trails, and easy highway access! Come make this condo home!
Key facts
- Brand new appliances
- Fresh interior paint
- Vaulted ceilings
Tags
Property features AI
Finance
- Other: Pets allowed
- HOA & community: Homeowners association with a $285 monthly fee; HOA covers structure maintenance, sewer, trash, and water; Community pool; Sidewalks in the community
Exterior
- Parking: 1-car garage; Carport
- Utilities: Electricity available; Public water; Public sewer
- Home design: 2 stories; Faces northwest; Slab foundation
- Construction: Built with concrete and stone veneer; Shingle and wood roof
- Exterior features: Balcony; Storage structure; No safety shelter
Interior
- Kitchen: Built-in range; Built-in oven; Range; Oven; Dishwasher; Refrigerator; Gas water heater; Electric oven connection; Electric range connection
- Flooring: Laminate flooring
- Bathrooms: 2 full bathrooms
- Heating & cooling: Central heating (gas); Central air conditioning
- Interior features: Vaulted ceilings; Ceiling fans; Laminate counters; Aluminum frame windows
- Laundry & utility: Washer hookup; Dryer hookup; Washer included; Dryer included
Neighborhood map
What this means for you Summary
Snapshot
- This is a 2-bed/2.0-bath condo listed at $60k.
Deal economics
- At list price, monthly cash flow is $71 ($858/yr) — positive.
- The deal already cash-flows at list — no discount required.
- Meets the 1% rule at list price ($942 rent vs $60k).
- Recommended offer: $56k (6.0% below list) — sets the bar for market timing.
- Cap rate 7.7% vs local median 3.9% in Tulsa — top-decile yield for the area; either an underpriced asset or a hidden risk that comps aren't pricing in. Stress-test before assuming the spread holds.
Location & tenants
- Location reads 75/100 on livability (#13 in OK, #4,058 nationally) — a middle-class / working-renter tenant base. Strengths: amenities A+, commute A+, cost of living A+; Watch: schools F, crime F, employment D-.
- Tulsa (urban): math 7% / reading 12% proficiency, ranked #250 of 270 in OK (top 93%) — low school quality limits family demand, transient renter base, plan for 1-2y turnover; 76% free/reduced lunch — lower-income household profile, screen leases tightly.
- Market conditions: Rents flat; 172 active listings in the ZIP; 29 comparable units currently listed for rent nearby; rentals leasing fast (median 3d on market — plan ~1-2 weeks tenant-placement turnaround); 2,818 units permitted in Tulsa County in 2024 (518 in 5+ unit buildings).
Forward outlook
- Local home prices are declining (-3.0%/yr); year-one equity from $414 of loan paydown is wiped out by about $2k of value loss. Plan a longer hold.
- Tulsa County population projected at +30% by 2050 — long-run rental-demand tailwind backs the buy-and-hold thesis.
Negotiation context
- It's been on market 64 days — a 6% lower offer ($56k) is reasonable based on typical stale-listing flexibility.
- 6 sale attempts since 22y ago; this cycle's ask has dropped $8k (11%) from the opening price — seller is motivated, your offer sets the floor, not the list.
- Current owner paid $38k; list at $60k implies a 58% gain — meaningful room to come down on a strong offer.
Risks & watch-outs
- Watch-outs: HOA is 30% of rent.
- Climate carrying-cost: extreme-heat days projected 7→19/yr by 2055 (HVAC capex compounding) — expect insurance premiums to compound above CPI over the hold.
Questions for the listing agent
- It's been on market 64 days. Have you received any prior offers? Is the seller open to a 6% concession, seller financing, or rate buy-down credit?
- What does the HOA fee cover, when was the last increase, and are there any pending special assessments or reserve-fund shortfalls?
- Any open or pending special assessments — roof, HVAC, plumbing, elevator, façade? What's the per-unit balance and payoff schedule, and is the seller paying it off at close or rolling it to the buyer?
- Why hasn't it sold? Are there any deal-killer items the seller is aware of (foundation, flood, title, zoning, code violations)?
- Is there a deadline driving the sale (1031 exchange, divorce, estate, relocation)? That informs how much negotiation room exists.
- Schools are F-rated, which usually means shorter tenancies and higher turnover. Who's the typical renter profile here, and what's been the actual vacancy rate?
- Crime grade is F in this area — have there been break-ins, vandalism, or insurance claims at this property in the last 3 years? What carrier currently insures it and at what premium?
- What's the average days-on-market for RENTAL listings here right now (not sales)? A rising rental-DOM trend means longer vacancies and softer asking-rent achievability than the comps imply.
- What's the recent tenant-quality profile in this submarket — average credit score on applications, eviction rate, late-payment / NSF rate, and stable-employment percentage? A property-management company in the area should have these aggregated.
- How much new apartment / multifamily construction is in the pipeline within 1–3 miles? Heavy new supply (>2% of stock underway) typically softens rents 12–24 months out; light construction supports rent growth.
Investment metrics
- 1% rule
- 1.57% ✓
- Cap rate
- 7.73%
- Cash-on-cash
- 5.12%
- DSCR
- 1.23
- GRM
- 5.3
CMA / ARV
No comps found within radius.
Projected returns pro-forma
-3.0% appreciation · 0.74% rent growth · sell at horizon
- IRR
- -12.0%
- Equity multiple
- 0.58×
- Total profit
- $-7,075
- Equity at exit
- $8,931
- IRR
- -8.8%
- Equity multiple
- 0.53×
- Total profit
- $-7,813
- Equity at exit
- $5,179
Cash invested: $16,772 (down + closing). Projections, not guarantees.
Landlord ↔ Tenant lean methodology
- Overall (STATE)
- 83 Strongly Landlord-Friendly
- State Oklahoma
- 83 Strongly Landlord-Friendly · R+20
- County
- — inherits STATE
- City
- — inherits STATE
ZIP-level market 74136
- Home prices YoY
- -31.4%
- Rents YoY
- 0.7%
- Active inventory
- 172
- Price-to-rent
- 5.3×
Monthly cashflow live
- Estimated rent
- $942 high interval (Pro) →
- Mortgage (P&I)
- −$314
- Tax from tax record
- −$49 /mo · $588/yr
- Insurance
- −$25
- HOA
- −$285
- Vacancy / Maint / Mgmt
- −$198
- Net cashflow
- $71
Break-even live
UW: 25.0% down · 7.5% · 30yr · 1.5% tax · 5.0% vac · 8.0% maint · 8.0% mgmt
Financing live
Cash to close
- Down payment
- $14,975
- Closing costs
- $1,797
- Reserves months
- —
- Total cash needed
- —
Loan-product check · same deal, 3 products live
Conventional
25% down · 7.5% · 30yr
- Down + closing
- —
- Monthly P&I
- —
- Monthly cashflow
- —
- DSCR
- —
- Eligible?
- —
Personal DTI + credit; lowest rate.
DSCR
20% down · 8.5% · 30yr
- Down + closing
- —
- Monthly P&I
- —
- Monthly cashflow
- —
- DSCR
- —
- Eligible?
- —
No personal income docs; deal must DSCR.
Hard money
10% down · 12.0% · 12mo
- Down + closing
- —
- Monthly P&I
- —
- Monthly cashflow
- —
- DSCR
- —
- Eligible?
- —
Short-term bridge; refi at stabilization.
Rent comps 29 comps
| Address | Beds | Baths | Sqft | Rent | $/sqft | DOM | Units | Dist |
|---|---|---|---|---|---|---|---|---|
| 1804 E 66th Pl Unit E108 Tulsa, OK | 1.0 | 1.0 | 562 | $850 | $1.51 | 23d | 1 | 0.07mi |
| 6639 S Victor Ave Unit G208 Tulsa, OK | 1.0 | 1.0 | 800 | $850 | $1.06 | 16d | 1 | 0.08mi |
| 6639 S Victor Ave Unit G203 Tulsa, OK | 1.0 | 1.0 | 800 | $850 | $1.06 | 23d | 1 | 0.09mi |
| 1802 E 66th Pl Tulsa, OK | 1.0–2.0 | 1.0–2.0 | 695 | $1,100 | $1.58 | 21d | 3 | 0.09mi |
| 1802 E 66th Pl Tulsa, OK | 1.0–2.0 | 1.0–2.0 | 562 | $995 | $1.77 | 3d | 1 | 0.09mi |
| 6630 S Zunis Ave Tulsa, OK | 1.0–3.0 | 1.0–2.0 | 1000 | $1,044 | $1.04 | 1d | 12 | 0.20mi |
| 6760 S Trenton Pl Tulsa, OK | 1.0 | 1.0 | 700 | $745 | $1.06 | 23d | 1 | 0.34mi |
| 6760 S Trenton Pl Tulsa, OK | 2.0 | 2.0 | 900 | $900 | $1.00 | 10d | 1 | 0.34mi |
| 6609 S Lewis Ave Tulsa, OK | 1.0 | 1.0 | 600 | $816 | $1.36 | 2d | 5 | 0.44mi |
| 1818 E 71st St Tulsa, OK | 2.0 | 1.0–2.0 | 700 | $1,062 | $1.52 | 1d | 37 | 0.44mi |
| 1329 E 64th St Tulsa, OK | 1.0–2.0 | 1.0 | 624 | $1,149 | $1.84 | 1d | 2 | 0.57mi |
| 6642 S Peoria Ave Tulsa, OK | 1.0–2.0 | 1.0 | 712 | $1,100 | $1.54 | 11d | 2 | 0.63mi |
| 6105 S Troost Ave Tulsa, OK | 2.0 | 2.0 | 1124 | $1,300 | $1.16 | 23d | 1 | 0.63mi |
| 6732 S Peoria Ave Tulsa, OK | 1.0–2.0 | 1.0–2.0 | 810 | $926 | $1.14 | 2d | 4 | 0.68mi |
| 7901 Riverside Pkwy Tulsa, OK | 2.0 | 2.0 | 950 | $884 | $0.93 | 3d | 16 | 0.77mi |
| 2218 E 59th St Tulsa, OK | 1.0–2.0 | 1.0 | 787 | $1,199 | $1.52 | 3d | 4 | 0.86mi |
| 6345 S Madison Pl Unit 1 Tulsa, OK | 3.0 | 2.0 | 1080 | $1,100 | $1.02 | 3d | 1 | 0.87mi |
| 1337 E 61st St Tulsa, OK | 1.0–2.0 | 1.0 | 700 | $1,051 | $1.50 | 3d | 14 | 0.89mi |
| 2409 E 59th Ct Unit 2433-4 Tulsa, OK | 1.0 | 1.0 | 565 | $675 | $1.19 | 19d | 1 | 0.92mi |
| 1110 E 60th St Tulsa, OK | 1.0–2.0 | 1.0–2.0 | 794 | $1,069 | $1.35 | 3d | 4 | 0.98mi |
| 1320 E 58th St Tulsa, OK | 1.0 | 1.0 | 980 | $1,200 | $1.22 | 21d | 1 | 1.02mi |
| 910 E 61st St Tulsa, OK | 1.0 | 1.0 | 700 | $926 | $1.32 | 3d | 1 | 1.04mi |
| 7803 S Wheeling Ave Tulsa, OK | 1.0–2.0 | 1.0–2.0 | 800 | $849 | $1.06 | 23d | 10 | 1.11mi |
| 5630 S Peoria Ave Unit 5630B-P Tulsa, OK | 1.0 | 1.0 | 650 | $925 | $1.42 | 3d | 1 | 1.11mi |
| 5628 S Peoria Ave Unit 5628A-P Tulsa, OK | 2.0 | 2.0 | 950 | $1,100 | $1.16 | 3d | 1 | 1.13mi |
| 5620 S Quaker Ave Unit 5620D-Q Tulsa, OK | 1.0 | 1.0 | 650 | $999 | $1.54 | 23d | 1 | 1.14mi |
| 5624 S Peoria Ave Unit 5624C-P Tulsa, OK | 2.0 | 1.0 | 850 | $1,000 | $1.18 | 3d | 1 | 1.15mi |
| 5607 S Quaker Ave Unit 5607D-Q Tulsa, OK | 2.0 | 2.0 | 950 | $1,100 | $1.16 | 3d | 1 | 1.20mi |
| 1037 E 57th Pl #5 Tulsa, OK | 1.0 | 1.5 | 1088 | $1,100 | $1.01 | 23d | 1 | 1.22mi |
HOA detail condo
- Monthly dues
- $285 · $3,420/yr
- Assessments
- None detected in remarks — confirm with the listing agent.
Listing history 38 events
-
2026-06-18days on market $59,900 Active 64 DOM
-
2026-06-17days on market $59,900 Active 63 DOM
-
2026-06-16days on market $59,900 Active 62 DOM
-
2026-06-15days on market $59,900 Active 61 DOM
-
2026-06-13pricedays on market $59,900 Active 59 DOM
-
2026-06-10days on market $64,500 Active 56 DOM
-
2026-06-09days on market $64,500 Active 55 DOM
-
2026-06-08days on market $64,500 Active 54 DOM
-
2026-06-07days on market $64,500 Active 53 DOM
-
2026-06-05days on market $64,500 Active 50 DOM
-
2026-06-03days on market $64,500 Active 49 DOM
-
2026-06-02days on market $64,500 Active 48 DOM
-
2026-06-01days on market $64,500 Active 47 DOM
-
2026-05-31days on market $64,500 Active 46 DOM
-
2026-04-27price $64,500
-
2026-04-15$67,500 Active
-
2026-02-13historical $975
-
2026-02-04price $975
-
2026-01-21price $1,050
-
2026-01-13$1,100
-
2021-05-26soldstatus $38,000
-
2021-05-21soldstatus $38,000 Closed 209-char remark
Show marketing remark (209 chars)
Back on Market through no fault of Seller! Completely renovated with fresh paint, new flooring, new stove and dishwasher. Close to shopping, parks, trails, and easy highway access! Come make this condo home!
-
2021-04-20status Pending 209-char remark
Show marketing remark (209 chars)
Back on Market through no fault of Seller! Completely renovated with fresh paint, new flooring, new stove and dishwasher. Close to shopping, parks, trails, and easy highway access! Come make this condo home!
-
2021-04-16price $38,000 209-char remark
Show marketing remark (209 chars)
Back on Market through no fault of Seller! Completely renovated with fresh paint, new flooring, new stove and dishwasher. Close to shopping, parks, trails, and easy highway access! Come make this condo home!
-
2021-04-16status Active 209-char remark
Show marketing remark (209 chars)
Back on Market through no fault of Seller! Completely renovated with fresh paint, new flooring, new stove and dishwasher. Close to shopping, parks, trails, and easy highway access! Come make this condo home!
-
2020-12-05historical 209-char remark
Show marketing remark (209 chars)
Back on Market through no fault of Seller! Completely renovated with fresh paint, new flooring, new stove and dishwasher. Close to shopping, parks, trails, and easy highway access! Come make this condo home!
-
2020-11-17status Pending 209-char remark
Show marketing remark (209 chars)
Back on Market through no fault of Seller! Completely renovated with fresh paint, new flooring, new stove and dishwasher. Close to shopping, parks, trails, and easy highway access! Come make this condo home!
-
2020-09-30historical 209-char remark
Show marketing remark (209 chars)
Back on Market through no fault of Seller! Completely renovated with fresh paint, new flooring, new stove and dishwasher. Close to shopping, parks, trails, and easy highway access! Come make this condo home!
-
2020-08-19status Pending 209-char remark
Show marketing remark (209 chars)
Back on Market through no fault of Seller! Completely renovated with fresh paint, new flooring, new stove and dishwasher. Close to shopping, parks, trails, and easy highway access! Come make this condo home!
-
2020-07-31status Pending 209-char remark
Show marketing remark (209 chars)
Back on Market through no fault of Seller! Completely renovated with fresh paint, new flooring, new stove and dishwasher. Close to shopping, parks, trails, and easy highway access! Come make this condo home!
-
2020-07-31$29,329 Active 209-char remark
Show marketing remark (209 chars)
Back on Market through no fault of Seller! Completely renovated with fresh paint, new flooring, new stove and dishwasher. Close to shopping, parks, trails, and easy highway access! Come make this condo home!
-
2012-05-02historical
-
2011-11-01$55,000
-
2004-12-20soldstatus $45,000
-
2004-12-16soldstatus $45,000
-
2004-11-29historical
-
2004-07-28$49,900
-
1983-07-05soldstatus $53,000
ⓘ Source: listings_history table (triggers on properties + properties_extension) + one-shot
backfill from property_details.listing_events for pre-trigger history.
Tax reassessment forecast OK · Resets to sale price
- Current annual tax
- $588 · $49/mo
- Projected year-2 tax
- $588 · $49/mo
- Expected delta
- $0/yr ($0/mo · 0.0%)
ⓘ Screening estimate from a state-policy table — verify with the county assessor before closing.
Climate risk First Street
- Flood 1/10 Low FEMA zone X (shaded) · 0% chance over 30 yrs
- Wildfire 3/10 Moderate
- Heat 7/10 Severe 7 d/yr ≥112°F today · 19 d/yr by 30 yrs out
- Wind 2/10 Low 4% chance of damaging wind over 30 yrs
- Air quality 3/10 Moderate 2 unhealthy d/yr today · 3 by 30 yrs out
Nearby sold comps map
Loading sold comps map…
Walkable amenities ~0.75 mi
Loading nearby amenities…
Taxation est. · year 1
- Rental income
- $11,310
- − Mortgage interest
- −$3,355
- − Property taxes
- −$588
- − Insurance
- −$300
- − Repairs & maintenance
- −$905
- − Management
- −$905
- − HOA
- −$3,420
- − Depreciation
- −$1,743
- Taxable income
- $95
- Est. tax owed @ 24.0%
- −$23
- After-tax cash flow
- $835/yr
For passive investors: Depreciation is non-cash, so a rental often shows a tax loss while cash-flowing — sheltering income. Rental losses are passive: they offset passive income freely, and up to $25,000/yr can offset ordinary (W-2) income if you actively participate and your MAGI is under $100k (phasing out to $0 by $150k); unused losses carry forward. On sale, claimed depreciation is recaptured at up to 25%, and gains may owe capital-gains tax (a 1031 exchange can defer both). Figures are a year-1 estimate at your 24.0% rate — not tax advice; consult a CPA.
Schools (NCES district)
- District
- Tulsa
- NCES district ID
- 4030240
- Math proficiency
- 7% ▼ -9.00%
- Reading proficiency
- 12% ▼ -7.00%
- Median HH income
- $37,895
- Composite
- 8.04/100
- National rank
- #9919
- State rank
- #250 of 270 in OK
Livability — Tulsa
- Score
- 75/100
- State rank
- #13
- US rank
- #4058
Category grades
Schools grade is shown separately in the Schools card above.
Census & demographics
- Census place
- Tulsa, OK
- County
- Tulsa County · 640,811 people
- City population
- 389,418
- Metro
- Tulsa, OK
- Population (ZIP)
- 31,416
- Household income
- $51,820
- Rent vs Own
- Severe rent burden
- 2579.0
Population outlook (Tulsa County) Hauer SSP2
- Today (2025)
- 723,846 people
- By 2030
- 766,033 · +5.8%
- By 2040
- 851,386 · +17.6%
- By 2050
- 938,389 · +29.6%
- By 2075
- 1,166,011 · +61.1%
- By 2100
- 1,350,277 · +86.5%
Race, ethnicity, and origin ACS 2023
- Neighborhood character
- Diverse neighborhood (Simpson 0.66)
- Race & ethnicity
- White 55% Black 16% Two or more races 13% Hispanic / Latino 10% Asian 7% Native American 2%
- Hispanic origin (detail)
- Mexican 6%
- Common ancestry
- Slovak 2% Lithuanian 2% Italian 1%
- Foreign-born
- 14% · Canada, Philippines
- Languages at home
- 83% English-only · Spanish 8% Other Asian/Pacific 5% Other Indo-European 1%
Political lean MEDSL · Tulsa
- 2024 margin
- R (+15.2) · D 41.3% · R 56.5% · Other 2.2%
- 2008→2024 swing
- +9.2pp toward D · 2008: -24.5pp · 2024: -15.2pp
- All cycles
- 2024: R+15.2 2020: R+15.6 2016: R+22.9 2012: R+27.4 2008: R+24.5
Not yet ingested
- Civics
- —
Market trends
- HPI YoY
- ▼ -98.51%
- Current HPI
- 215.3642
- Rent YoY
- ▲ 0.74%
- Metro
- Tulsa, OK
- State GDP YoY
- ▲ 1.55%
- F500 in state
- 6
Industry mix (Fortune 500 HQ in OK)
| Industry | F500 HQs | Revenue |
|---|---|---|
| Energy | 3 | $48B |
|
||
Price history
+21.7% since first listed24 events — show timeline
- 2026-04-27 Price Changed $64,500 MLS Technology, Inc.
- 2026-04-15 Listed $67,500 MLS Technology, Inc.
- 2026-02-13 Rental Removed $975 APPFOLIO
- 2026-02-04 Price Changed $975 APPFOLIO
- 2026-01-21 Price Changed $1,050 APPFOLIO
- 2026-01-13 Listed for Rent $1,100 APPFOLIO
- 2021-05-26 Sold (Public Records) $38,000 Public Records
- 2021-05-21 Sold (MLS) $38,000 MLS Technology, Inc.
- 2021-04-20 Pending — MLS Technology, Inc.
- 2021-04-16 Price Changed $38,000 MLS Technology, Inc.
- 2021-04-16 Relisted — MLS Technology, Inc.
- 2020-12-05 Listing Removed — MLS Technology, Inc.
- 2020-11-17 Pending — MLS Technology, Inc.
- 2020-09-30 Listing Removed — MLS Technology, Inc.
- 2020-08-19 Pending — MLS Technology, Inc.
- 2020-07-31 Pending — MLS Technology, Inc.
- 2020-07-31 Listed $29,329 MLS Technology, Inc.
- 2012-05-02 Listing Removed — MLS Technology, Inc.
- 2011-11-01 Listed $55,000 MLS Technology, Inc.
- 2004-12-20 Sold (Public Records) $45,000 Public Records
- 2004-12-16 Sold (MLS) $45,000 MLS Technology, Inc.
- 2004-11-29 Listing Removed — MLS Technology, Inc.
- 2004-07-28 Listed $49,900 MLS Technology, Inc.
- 1983-07-05 Sold (Public Records) $53,000 Public Records
Property tax history
+1.0%/yrLatest (2025): $588 · +42.7% YoY. Source: county tax records.
Cash-flow waterfall
monthlySold comps — $/sqft
last 12 mo · ≤1 miLoading sold comps…