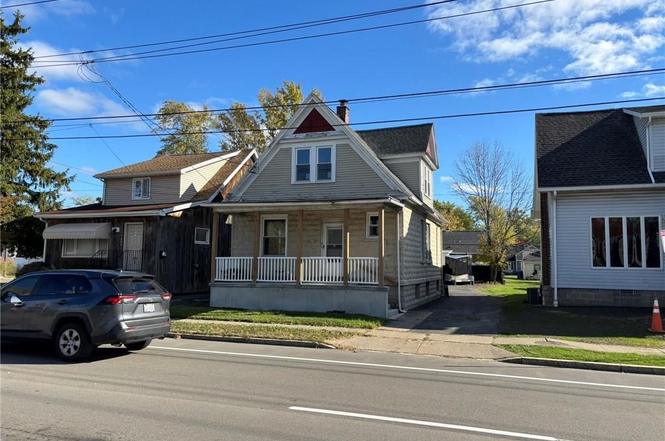
1403 Union Rd · West Seneca, NY
Flood risk 1/10 · Minimal
- FEMA flood zone
- X (unshaded)
- Chance of flooding over 30 yrs
- 0.0%
- Est. flood insurance / yr
- $473 – $860
Fire risk 1/10 · Minimal
- Est. fire insurance / yr
- $691 – $1,283
Heat risk 3/10 · Minor
- Hot days now (above 92°F)
- 7 days/yr
- Hot days in 30 yrs
- 16 days/yr
Wind risk 1/10 · Minimal
- Chance of severe wind over 30 yrs
- —
Air-quality risk 4/10 · Minor
- Unhealthy air days now
- 3 days/yr
- Unhealthy air days in 30 yrs
- 8 days/yr
Risk factors via First Street. Map © Google.
Why this score? — see what drove the C+ grade
The composite is a weighted blend of 9 inputs, each scored 0–100. Each bar is that input's sub-score; the figure is the points it added to the 100-point composite (weight × sub-score).
- Cash flow +24.7/30.0
- 1% rule +8.8/10.0
- DSCR +8.0/10.0
- ARV discount +7.5/15.0
- Schools +4.5/10.0
- Livability +4.0/5.0
- Rent growth +2.5/5.0
- Condition / age +2.5/5.0
- Appreciation +0.0/10.0
$109,900
🖨 Deal sheet (PDF) 📄 Offer letter ✓ Due diligence
Listing remarks
Check out this terrific opportunity to purchase a single family home that needs cosmetic touches completed. Many mechanical updates have been done including high efficiency replacement windows, updated architectural shingle roof, a fully rebuilt front porch, glass block windows and more. There are three bedrooms and a full bathroom upstairs. There is also some nice original architectural details like the oak banister going up the front staircase and a cool open concept kitchen. What is needed now is someone to update light fixtures, do a full interior paint job and install finished flooring or carpet. This could serve as an excellent rental or a home for you. Additionally since it is on Uni
Key facts
- Open concept kitchen
- Oak banister
- Glass block windows
Tags
Neighborhood map
What this means for you Summary
Snapshot
- This is a 3-bed/1.0-bath single-family listed at $110k.
Deal economics
- At list price, monthly cash flow is $229 ($3k/yr) — positive.
- The deal already cash-flows at list — no discount required.
- Meets the 1% rule at list price ($2k rent vs $110k).
- Recommended offer: $107k (3.0% below list) — sets the bar for market timing.
- Cap rate 8.8% vs local median 3.7% in West Seneca — top-decile yield for the area; either an underpriced asset or a hidden risk that comps aren't pricing in. Stress-test before assuming the spread holds.
Location & tenants
- Location reads 79/100 on livability (#130 in NY, #2,089 nationally) — a middle-class / working-renter tenant base. Strengths: housing A+, health & safety A+, crime A-; Watch: amenities D, commute F.
- West Seneca Central School District (suburban): math 49% / reading 55% proficiency, ranked #336 of 590 in NY (top 57%) — acceptable for families but not a draw, mixed tenant base, ~2y average lease.
- Market conditions: 202 active listings in the ZIP; 5 comparable units currently listed for rent nearby; rentals leasing fast (median 4d on market — plan ~1-2 weeks tenant-placement turnaround); 40% of comp listings sitting > 30 days — soft ceiling on asking rent; 1,244 units permitted in Erie County in 2024 (563 in 5+ unit buildings).
Forward outlook
- Local home prices are declining (-3.0%/yr); year-one equity from $760 of loan paydown is wiped out by about $3k of value loss. Plan a longer hold.
Negotiation context
- It's been on market 36 days — a 3% lower offer ($107k) is reasonable based on typical stale-listing flexibility.
- 2 sale attempts with the ask held roughly flat each time — persistent listings suggest the price (not the market) is what's stuck; bring a comps-based counter.
Risks & watch-outs
- Watch-outs: property tax is 3.8% of price; built in 1907 — expect roof / HVAC / electrical / plumbing capex.
Questions for the listing agent
- It's been on market 36 days. Have you received any prior offers? Is the seller open to a 3% concession, seller financing, or rate buy-down credit?
- Built in 1907 — when were the roof, HVAC, electrical panel, plumbing, and water heater last replaced?
- Property tax is high relative to price — has the assessment been appealed recently, and will the sale trigger a re-assessment?
- Is there a deadline driving the sale (1031 exchange, divorce, estate, relocation)? That informs how much negotiation room exists.
- Schools are B-rated — typically a magnet for longer-tenancy family renters. What's the average tenant stay here, and is there a school-zone premium baked into asking?
- What's the average days-on-market for RENTAL listings here right now (not sales)? A rising rental-DOM trend means longer vacancies and softer asking-rent achievability than the comps imply.
- What's the recent tenant-quality profile in this submarket — average credit score on applications, eviction rate, late-payment / NSF rate, and stable-employment percentage? A property-management company in the area should have these aggregated.
- How much new for-sale + rental construction is in the pipeline within 1–3 miles? Heavy new supply typically softens prices + rents 12–24 months out; constrained supply supports both.
Investment metrics
- 1% rule
- 1.38% ✓
- Cap rate
- 8.79%
- Cash-on-cash
- 8.93%
- DSCR
- 1.40
- GRM
- 6.0
CMA / ARV
- ARV (on-the-fly)
- $288,512
- Comps found
- 12
Show comp detail 12 sales within ~0.75 mi
| Address | Dist | Beds/Ba | Sqft | Sold | Price | $/sf | Match |
|---|---|---|---|---|---|---|---|
| 26 Warren Ave | 0.17mi | 3/2.0 | 1,415 (+10%) | 5mo | $328,000 | $232 | 67 |
| 135 Century Dr | 0.52mi | 3/1.0 | 1,232 (-4%) | 5mo | $265,000 | $215 | 64 |
| 67 Hillcrest Dr | 0.57mi | 3/1.5 | 1,286 (-0%) | 11mo | $301,000 | $234 | 62 |
| 211 Ansley Ct | 0.42mi | 3/1.0 | 1,399 (+9%) | 6mo | $307,000 | $219 | 61 |
| 67 Bayberry Ave | 0.61mi | 3/1.0 | 1,232 (-4%) | 6mo | $300,000 | $244 | 59 |
| 61 Centerview Dr | 0.47mi | 3/1.0 | 1,400 (+9%) | 7mo | $250,000 | $179 | 58 |
| 120 Cloverside Ct | 0.50mi | 3/1.5 | 1,356 (+5%) | 10mo | $300,000 | $221 | 58 |
| 22 Carol Dr | 0.60mi | 3/2.0 | 1,319 (+2%) | 10mo | $370,000 | $281 | 56 |
| 59 Woodlane Dr | 0.70mi | 3/1.0 | 1,340 (+4%) | 8mo | $300,000 | $224 | 54 |
| 117 Willowdale Dr | 0.73mi | 3/2.0 | 1,323 (+3%) | 11mo | $302,000 | $228 | 48 |
| 14 Princess Ln | 0.58mi | 3/2.0 | 1,428 (+11%) | 8mo | $240,000 | $168 | 44 |
| 66 Bayberry Ave | 0.64mi | 2/1.0 (-1) | 1,112 (-14%) | 6mo | $210,000 | $189 | 37 |
Match score weights: distance 35% · size 25% · config 20% · recency 20%. Top-matched comps best support the ARV.
Projected returns pro-forma
-3.0% appreciation · 3.0% rent growth · sell at horizon
- IRR
- -2.6%
- Equity multiple
- 0.90×
- Total profit
- $-3,066
- Equity at exit
- $16,386
- IRR
- 7.2%
- Equity multiple
- 1.54×
- Total profit
- $16,741
- Equity at exit
- $9,502
Cash invested: $30,772 (down + closing). Projections, not guarantees.
Landlord ↔ Tenant lean methodology
- Overall (STATE)
- 15 Strongly Tenant-Friendly
- State New York
- 15 Strongly Tenant-Friendly · D+10
- County
- — inherits STATE
- City
- — inherits STATE
ZIP-level market 14224
- Active inventory
- 202
- Price-to-rent
- 6.0×
Monthly cashflow live
- Estimated rent
- $1,521 high interval (Pro) →
- Mortgage (P&I)
- −$576
- Tax from tax record
- −$351 /mo · $4,209/yr
- Insurance
- −$46
- HOA
- −$0
- Vacancy / Maint / Mgmt
- −$320
- Net cashflow
- $229
Break-even live
Sensitivity live
| Price | -10% $291 | -5% $260 | +0% $229 | +5% $198 | +10% $167 |
|---|---|---|---|---|---|
| Rent | -10% $109 | -5% $169 | +0% $229 | +5% $289 | +10% $349 |
| Rate | -1.0pp $284 | -0.5pp $257 | base $229 | +0.5pp $201 | +1.0pp $172 |
UW: 25.0% down · 7.5% · 30yr · 1.5% tax · 5.0% vac · 8.0% maint · 8.0% mgmt
Financing live
Cash to close
- Down payment
- $27,475
- Closing costs
- $3,297
- Reserves months
- —
- Total cash needed
- —
Loan-product check · same deal, 3 products live
Conventional
25% down · 7.5% · 30yr
- Down + closing
- —
- Monthly P&I
- —
- Monthly cashflow
- —
- DSCR
- —
- Eligible?
- —
Personal DTI + credit; lowest rate.
DSCR
20% down · 8.5% · 30yr
- Down + closing
- —
- Monthly P&I
- —
- Monthly cashflow
- —
- DSCR
- —
- Eligible?
- —
No personal income docs; deal must DSCR.
Hard money
10% down · 12.0% · 12mo
- Down + closing
- —
- Monthly P&I
- —
- Monthly cashflow
- —
- DSCR
- —
- Eligible?
- —
Short-term bridge; refi at stabilization.
Rent comps 5 comps
| Address | Beds | Baths | Sqft | Rent | $/sqft | DOM | Units | Dist |
|---|---|---|---|---|---|---|---|---|
| 194 Boncroft Dr Unit Upper West Seneca, NY | 2.0 | 1.0 | 936 | $1,300 | $1.39 | 45d | 1 | 0.36mi |
| 510 Center Rd West Seneca, NY | 2.0 | 1.0–1.5 | 1054 | $1,515 | $1.44 | 3d | 2 | 0.50mi |
| 3266 Seneca St Buffalo, NY | 1.0–2.0 | 1.0–2.0 | 825 | $2,015 | $2.44 | 3d | 1 | 0.92mi |
| 200 Center Rd Buffalo, NY | 2.0 | 1.0 | 900 | $1,295 | $1.44 | 3d | 1 | 0.98mi |
| 1130 Orchard Park Rd Buffalo, NY | 2.0 | 2.0 | 1517 | $2,015 | $1.33 | 45d | 1 | 1.50mi |
Listing history 4 events
-
2026-03-31status Pending
-
2026-02-25status Active
-
2026-02-16status Pending
-
2026-02-13$109,900 Active
ⓘ Source: listings_history table (triggers on properties + properties_extension) + one-shot
backfill from property_details.listing_events for pre-trigger history.
Tax reassessment forecast NY · Partial reset (capped growth)
- Current annual tax
- $4,209 · $351/mo
- Projected year-2 tax
- $4,209 · $351/mo
- Expected delta
- $0/yr ($0/mo · 0.0%)
ⓘ Screening estimate from a state-policy table — verify with the county assessor before closing.
Climate risk First Street
- Flood 1/10 Low FEMA zone X (unshaded) · 0% chance over 30 yrs
- Wildfire 1/10 Low
- Heat 3/10 Moderate 7 d/yr ≥92°F today · 16 d/yr by 30 yrs out
- Wind 1/10 Low
- Air quality 4/10 Moderate 3 unhealthy d/yr today · 8 by 30 yrs out
Nearby sold comps map
Loading sold comps map…
Walkable amenities ~0.75 mi
Loading nearby amenities…
Taxation est. · year 1
- Rental income
- $18,257
- − Mortgage interest
- −$6,156
- − Property taxes
- −$4,209
- − Insurance
- −$550
- − Repairs & maintenance
- −$1,461
- − Management
- −$1,461
- − Depreciation
- −$3,197
- Taxable income
- $1,224
- Est. tax owed @ 24.0%
- −$294
- After-tax cash flow
- $2,455/yr
For passive investors: Depreciation is non-cash, so a rental often shows a tax loss while cash-flowing — sheltering income. Rental losses are passive: they offset passive income freely, and up to $25,000/yr can offset ordinary (W-2) income if you actively participate and your MAGI is under $100k (phasing out to $0 by $150k); unused losses carry forward. On sale, claimed depreciation is recaptured at up to 25%, and gains may owe capital-gains tax (a 1031 exchange can defer both). Figures are a year-1 estimate at your 24.0% rate — not tax advice; consult a CPA.
Schools (NCES district)
- District
- West Seneca Central School District
- NCES district ID
- 3630780
- Math proficiency
- 49% ▼ -15.00%
- Reading proficiency
- 55% ▼ -4.00%
- Median HH income
- $54,231
- Composite
- 44.83/100
- National rank
- #2735
- State rank
- #336 of 590 in NY
Livability — West Seneca
- Score
- 79/100
- State rank
- #130
- US rank
- #2089
Category grades
Schools grade is shown separately in the Schools card above.
Census & demographics
- Census place
- West Seneca, NY
- City population
- 41,101
- Population (ZIP)
- 41,101
Population outlook (Erie County) Hauer SSP2
- Today (2025)
- 933,037 people
- By 2030
- 935,181 · +0.2%
- By 2040
- 928,531 · -0.5%
- By 2050
- 905,725 · -2.9%
- By 2075
- 834,037 · -10.6%
- By 2100
- 708,033 · -24.1%
Race, ethnicity, and origin ACS 2023
- Neighborhood character
- Predominantly White (91%)
- Race & ethnicity
- White 91% Hispanic / Latino 4% Two or more races 3% Black 2%
- Common ancestry
- Romanian 22% Lithuanian 2% Iranian 1%
- Foreign-born
- 2% · Canada
- Languages at home
- 95% English-only · Spanish 2% Russian/Polish/Slavic 1% Arabic 1%
Political lean MEDSL · Erie
- 2024 margin
- Lean D (+9.7) · D 54.8% · R 45.2%
- 2008→2024 swing
- -7.9pp toward R · 2008: 17.5pp · 2024: 9.7pp
- All cycles
- 2024: D+9.7 2020: D+14.7 2016: D+4.8 2012: D+15.6 2008: D+17.5
Not yet ingested
- Civics
- —
Market trends
- HPI YoY
- ▼ -211.03%
- Current HPI
- 303.7523
- Rent YoY
- —
- Metro
- —
- State GDP YoY
- ▲ 2.60%
- F500 in state
- 92
Industry mix (Fortune 500 HQ in NY)
| Industry | F500 HQs | Revenue |
|---|---|---|
| Financial Services | 10 | $950B |
|
||
| Consumer Goods | 9 | $162B |
|
||
| Insurance | 4 | $225B |
|
||
| Telecommunications | 2 | $144B |
|
||
| Pharmaceuticals | 2 | $112B |
|
||
| Media / Entertainment | 2 | $69B |
|
||
Price history
4 events — show timeline
- 2026-03-31 Pending — WNYREIS
- 2026-02-25 Relisted — WNYREIS
- 2026-02-16 Pending — WNYREIS
- 2026-02-13 Listed $109,900 WNYREIS
Property tax history
+1.8%/yrLatest (2025): $4,209 · +0.7% YoY. Source: county tax records.
Cash-flow waterfall
monthlySold comps — $/sqft
last 12 mo · ≤1 miLoading sold comps…