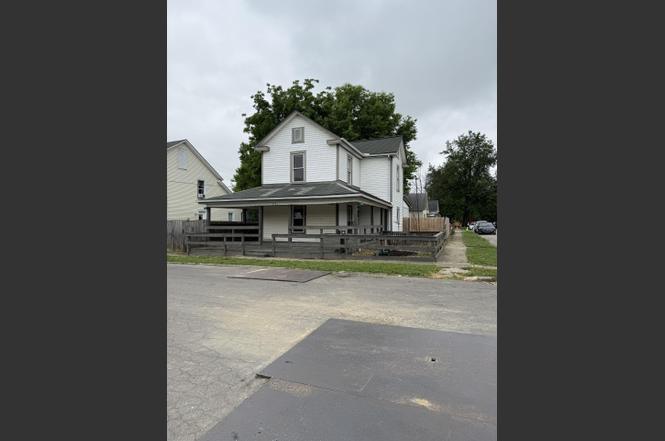
79 Toland St · London, OH
Flood risk 1/10 · Minimal
- FEMA flood zone
- X (unshaded)
- Chance of flooding over 30 yrs
- 0.0%
- Est. flood insurance / yr
- $507 – $1,088
Fire risk 1/10 · Minimal
- Est. fire insurance / yr
- $713 – $1,323
Heat risk 3/10 · Minor
- Hot days now (above 99°F)
- 7 days/yr
- Hot days in 30 yrs
- 18 days/yr
Wind risk 2/10 · Minimal
- Chance of severe wind over 30 yrs
- 1.0%
Air-quality risk 3/10 · Minor
- Unhealthy air days now
- 2 days/yr
- Unhealthy air days in 30 yrs
- 4 days/yr
Risk factors via First Street. Map © Google.
Why this score? — see what drove the C- grade
The composite is a weighted blend of 9 inputs, each scored 0–100. Each bar is that input's sub-score; the figure is the points it added to the 100-point composite (weight × sub-score).
- ARV discount +15.0/15.0
- Cash flow +14.9/30.0
- DSCR +4.6/10.0
- Schools +4.0/10.0
- Livability +3.5/5.0
- 1% rule +3.1/10.0
- Rent growth +2.5/5.0
- Condition / age +2.5/5.0
- Appreciation +0.0/10.0
$154,500
🖨 Deal sheet 📄 Offer letter ✓ Due diligence
Listing remarks MLS
Open to Investors as well as Owner Occupants. Come see this Historic Charmer located in the heart of London Ohio. This home features 3 bedrooms, 2 bath rooms, and a great wrap around porch where you can spend your evenings with your family. Hurry this one won't last long!
Key facts
- Wrap around porch
- Corner lot
- 3,049 sq ft lot
Tags
Property features AI
Exterior
- Utilities: Public water; Public sewer
- Home design: Single-family home; Two levels; Built in 1930; No shared/common walls
- Construction: Other foundation
- Exterior features: Deck; Fenced yard; Shed(s)
Interior
- Bedrooms: One main-level bedroom
- Bathrooms: Two full bathrooms
- Heating & cooling: Central air conditioning; Forced air heating
- Interior features: Crawl space basement
Neighborhood map
What this means for you Summary
Snapshot
- This is a 3-bed/2.0-bath single-family listed at $154k.
Deal economics
- At list price, monthly cash flow is $46 ($549/yr) — positive.
- The deal already cash-flows at list — no discount required.
- To meet the 1% rule (rent ≥ 1% of price), the offer needs to be $125k (19.2% below list).
- Recommended offer: $125k (19.2% below list) — sets the bar for 1% rule.
- Cap rate 6.6% vs local median 3.0% in London — top-decile yield for the area; either an underpriced asset or a hidden risk that comps aren't pricing in. Stress-test before assuming the spread holds.
Location & tenants
- Location reads 70/100 on livability (#477 in OH) — a middle-class / working-renter tenant base. Strengths: crime A+, cost of living A+, housing A+; Watch: amenities F, commute F, health & safety F.
- London City (town): math 39% / reading 54% proficiency, ranked #479 of 656 in OH (top 73%) — families likely to look elsewhere, expect single-tenant / working-renter base with shorter leases.
- Market conditions: 111 active listings in the ZIP; 2 comparable units currently listed for rent nearby; solid renter incomes; 530 units permitted in Madison County in 2024 (120 in 5+ unit buildings).
Forward outlook
- Local home prices are declining (-3.0%/yr); year-one equity from $1k of loan paydown is wiped out by about $5k of value loss. Plan a longer hold.
- Madison County population projected at +4% by 2050 — modest demand growth; plan on rents tracking national, not racing it.
Negotiation context
- Only 8 days on market — expect competitive offers; lowballing is unlikely to land.
- 7 sale attempts since 31y ago with the ask held roughly flat each time — persistent listings suggest the price (not the market) is what's stuck; bring a comps-based counter.
- Current owner paid $22k; list at $154k implies a 602% gain — meaningful room to come down on a strong offer.
Risks & watch-outs
- Watch-outs: built in 1930 — expect roof / HVAC / electrical / plumbing capex.
Questions for the listing agent
- Built in 1930 — when were the roof, HVAC, electrical panel, plumbing, and water heater last replaced?
- Is there a deadline driving the sale (1031 exchange, divorce, estate, relocation)? That informs how much negotiation room exists.
- Schools are B-rated — typically a magnet for longer-tenancy family renters. What's the average tenant stay here, and is there a school-zone premium baked into asking?
- What's the average days-on-market for RENTAL listings here right now (not sales)? A rising rental-DOM trend means longer vacancies and softer asking-rent achievability than the comps imply.
- What's the recent tenant-quality profile in this submarket — average credit score on applications, eviction rate, late-payment / NSF rate, and stable-employment percentage? A property-management company in the area should have these aggregated.
- How much new for-sale + rental construction is in the pipeline within 1–3 miles? Heavy new supply typically softens prices + rents 12–24 months out; constrained supply supports both.
Investment metrics
- 1% rule
- 0.81% ✗
- Cap rate
- 6.65%
- Cash-on-cash
- 1.27%
- DSCR
- 1.06
- GRM
- 10.3
CMA / ARV
- ARV (on-the-fly)
- $258,736
- Comps found
- 12
Show comp detail 12 sales within ~0.75 mi
| Address | Dist | Beds/Ba | Sqft | Sold | Price | $/sf | Match |
|---|---|---|---|---|---|---|---|
| 188 W Center St | 0.15mi | 4/1.0 (+1) | 1,628 (-1%) | 11mo | $145,000 | $89 | 73 |
| 154 E High St | 0.57mi | 3/2.0 | 1,708 (+4%) | 5mo | $288,000 | $169 | 63 |
| 84 E 5th St | 0.58mi | 3/1.0 | 1,620 (-2%) | 7mo | $220,000 | $136 | 60 |
| 25 Vernon Ave | 0.31mi | 3/2.0 | 1,456 (-12%) | 11mo | $204,900 | $141 | 57 |
| 202 Toland St | 0.27mi | 4/2.5 (+1) | 1,502 (-9%) | 11mo | $300,000 | $200 | 56 |
| 37 Lotspeich Ave | 0.52mi | 3/1.5 | 1,494 (-9%) | 4mo | $213,000 | $143 | 54 |
| 35 Arlington Ave | 0.49mi | 3/2.5 | 1,849 (+12%) | 2mo | $318,000 | $172 | 53 |
| 31 N Madison Rd Unit R | 0.35mi | 4/1.5 (+1) | 1,892 (+15%) | 2mo | $272,500 | $144 | 50 |
| 188 S Oak St | 0.22mi | 4/1.5 (+1) | 1,404 (-15%) | 11mo | $250,000 | $178 | 49 |
| 27 Stump Ln | 0.71mi | 3/2.0 | 1,824 (+11%) | 2mo | $265,000 | $145 | 48 |
| 119 N Oak St | 0.49mi | 2/1.5 (-1) | 1,462 (-11%) | 9mo | $229,900 | $157 | 44 |
| 151 New Hampshire Ave | 0.64mi | 4/3.0 (+1) | 1,551 (-6%) | 11mo | $310,000 | $200 | 42 |
Match score weights: distance 35% · size 25% · config 20% · recency 20%. Top-matched comps best support the ARV.
Projected returns pro-forma
-3.0% appreciation · 3.0% rent growth · sell at horizon
- IRR
- -14.3%
- Equity multiple
- 0.49×
- Total profit
- $-22,181
- Equity at exit
- $23,036
- IRR
- -5.6%
- Equity multiple
- 0.63×
- Total profit
- $-15,804
- Equity at exit
- $13,358
Cash invested: $43,260 (down + closing). Projections, not guarantees.
Landlord ↔ Tenant lean methodology
- Overall (STATE)
- 73 Landlord-Friendly
- State Ohio
- 73 Landlord-Friendly · R+6
- County
- — inherits STATE
- City
- — inherits STATE
ZIP-level market 43140
- Active inventory
- 111
- Price-to-rent
- 10.3×
Monthly cashflow live
- Estimated rent
- $1,248 medium interval (Pro) →
- Mortgage (P&I)
- −$810
- Tax from tax record
- −$66 /mo · $788/yr
- Insurance
- −$64
- HOA
- −$0
- Vacancy / Maint / Mgmt
- −$262
- Net cashflow
- $46
Break-even live
UW: 25.0% down · 7.5% · 30yr · 1.5% tax · 5.0% vac · 8.0% maint · 8.0% mgmt
Financing live
Cash to close
- Down payment
- $38,625
- Closing costs
- $4,635
- Reserves months
- —
- Total cash needed
- —
Loan-product check · same deal, 3 products live
Conventional
25% down · 7.5% · 30yr
- Down + closing
- —
- Monthly P&I
- —
- Monthly cashflow
- —
- DSCR
- —
- Eligible?
- —
Personal DTI + credit; lowest rate.
DSCR
20% down · 8.5% · 30yr
- Down + closing
- —
- Monthly P&I
- —
- Monthly cashflow
- —
- DSCR
- —
- Eligible?
- —
No personal income docs; deal must DSCR.
Hard money
10% down · 12.0% · 12mo
- Down + closing
- —
- Monthly P&I
- —
- Monthly cashflow
- —
- DSCR
- —
- Eligible?
- —
Short-term bridge; refi at stabilization.
Rent comps 2 comps
| Address | Beds | Baths | Sqft | Rent | $/sqft | DOM | Units | Dist |
|---|---|---|---|---|---|---|---|---|
| 1 E High St Unit 3G London, OH | 2.0 | 1.0 | 1200 | $955 | $0.80 | 1d | 1 | 0.33mi |
| 107 Chandler Ave London, OH | 3.0 | 2.5 | 1280 | $1,950 | $1.52 | 2d | 1 | 0.83mi |
Listing history 7 events
-
2026-06-18days on market $154,500 Active 8 DOM
-
2026-06-17days on market $154,500 Active 7 DOM
-
2026-06-16days on market $154,500 Active 6 DOM
-
2026-06-15days on market $154,500 Active 5 DOM
-
2026-06-13days on market $154,500 Active 3 DOM
-
2026-06-13remarks 214-char remark
-
2026-06-13$154,500 Active 2 DOM
ⓘ Source: listings_history table (triggers on properties + properties_extension) + one-shot
backfill from property_details.listing_events for pre-trigger history.
Tax reassessment forecast OH · Partial reset (capped growth)
- Current annual tax
- $788 · $66/mo
- Projected year-2 tax
- $1,599 · $133/mo
- Expected delta
- +$811/yr (+$68/mo · 102.9%)
ⓘ Screening estimate from a state-policy table — verify with the county assessor before closing.
Climate risk First Street
- Flood 1/10 Low FEMA zone X (unshaded) · 0% chance over 30 yrs
- Wildfire 1/10 Low
- Heat 3/10 Moderate 7 d/yr ≥99°F today · 18 d/yr by 30 yrs out
- Wind 2/10 Low 100% chance of damaging wind over 30 yrs
- Air quality 3/10 Moderate 2 unhealthy d/yr today · 4 by 30 yrs out
Nearby sold comps map
Loading sold comps map…
Walkable amenities ~0.75 mi
Loading nearby amenities…
Taxation est. · year 1
- Rental income
- $14,978
- − Mortgage interest
- −$8,654
- − Property taxes
- −$788
- − Insurance
- −$772
- − Repairs & maintenance
- −$1,198
- − Management
- −$1,198
- − Depreciation
- −$4,495
- Taxable loss
- −$2,128
- Est. tax savings @ 24.0%
- +$511
- After-tax cash flow
- $1,060/yr
For passive investors: Depreciation is non-cash, so a rental often shows a tax loss while cash-flowing — sheltering income. Rental losses are passive: they offset passive income freely, and up to $25,000/yr can offset ordinary (W-2) income if you actively participate and your MAGI is under $100k (phasing out to $0 by $150k); unused losses carry forward. On sale, claimed depreciation is recaptured at up to 25%, and gains may owe capital-gains tax (a 1031 exchange can defer both). Figures are a year-1 estimate at your 24.0% rate — not tax advice; consult a CPA.
Schools (NCES district)
- District
- London City
- NCES district ID
- 3904425
- Math proficiency
- 39% ▼ -19.00%
- Reading proficiency
- 54% ▼ -9.00%
- Median HH income
- $53,859
- Composite
- 40.19/100
- National rank
- #3785
- State rank
- #479 of 656 in OH
Livability — London
- Score
- 70/100
- State rank
- #477
- US rank
- #7937
Category grades
Schools grade is shown separately in the Schools card above.
Census & demographics
- Census place
- London, OH
- County
- Madison · 56,187 people
- Metro
- Columbus, OH
- Population (ZIP)
- 24,162
- Household income
- $82,598
- Rent vs Own
- Severe rent burden
- 7.4
Population outlook (Madison County) Hauer SSP2
- Today (2025)
- 46,050 people
- By 2030
- 46,826 · +1.7%
- By 2040
- 47,941 · +4.1%
- By 2050
- 47,919 · +4.1%
- By 2075
- 46,160 · +0.2%
- By 2100
- 38,584 · -16.2%
Race, ethnicity, and origin ACS 2023
- Neighborhood character
- Predominantly White (82%)
- Race & ethnicity
- White 82% Black 8% Two or more races 7% Hispanic / Latino 2% Asian 2%
- Common ancestry
- Slovak 2% Iranian 2% Lithuanian 1%
- Foreign-born
- 3% · Canada, South Korea
- Languages at home
- 95% English-only · Spanish 2% Other Indo-European 1%
Political lean MEDSL · Madison
- 2024 margin
- Solid R (+43.7) · D 27.6% · R 71.3% · Other 1.1%
- 2008→2024 swing
- -20.3pp toward R · 2008: -23.4pp · 2024: -43.7pp
- All cycles
- 2024: R+43.7 2020: R+41.0 2016: R+39.7 2012: R+20.4 2008: R+23.4
Not yet ingested
- Civics
- —
Market trends
- HPI YoY
- ▼ -224.46%
- Current HPI
- 249.4987
- Rent YoY
- —
- Metro
- —
- State GDP YoY
- ▲ 1.98%
- F500 in state
- 48
Industry mix (Fortune 500 HQ in OH)
| Industry | F500 HQs | Revenue |
|---|---|---|
| Insurance | 3 | $145B |
|
||
| Industrial Machinery | 3 | $49B |
|
||
| Financial Services | 3 | $24B |
|
||
| Consumer Goods | 2 | $93B |
|
||
| Aerospace / Defense | 2 | $47B |
|
||
| Utilities | 2 | $33B |
|
||
Price history
+1717.6% since first listed20 events — show timeline
- 2026-06-09 Listed $154,500 CBRMLS
- 2013-10-11 Sold (Public Records) $22,000 Public Records
- 2013-10-04 Sold (MLS) $22,000 CBRMLS
- 2013-09-04 Listing Removed — CBRMLS
- 2013-07-19 Listed $26,000 CBRMLS
- 2013-04-16 Sold (Public Records) $25,334 Public Records
- 2011-01-01 Listing Removed — CBRMLS
- 2010-04-25 Listed $119,900 CBRMLS
- 2002-06-21 Sold (Public Records) $85,200 Public Records
- 2002-06-03 Sold (MLS) $85,200 CBRMLS
- 2002-04-11 Listing Removed — CBRMLS
- 2002-01-28 Listed $93,900 CBRMLS
- 1996-10-11 Sold (Public Records) $49,000 Public Records
- 1996-06-28 Listing Removed — CBRMLS
- 1996-04-01 Listed $57,800 CBRMLS
- 1996-03-27 Listing Removed — CBRMLS
- 1995-06-10 Listed $67,900 CBRMLS
- 1995-06-03 Listing Removed — CBRMLS
- 1995-01-01 Listed $69,900 CBRMLS
- 1986-11-28 Sold (Public Records) $8,500 Public Records
Property tax history
+3.8%/yrLatest (2025): $788 · -3.6% YoY. Source: county tax records.
Cash-flow waterfall
monthlySold comps — $/sqft
last 12 mo · ≤1 miLoading sold comps…