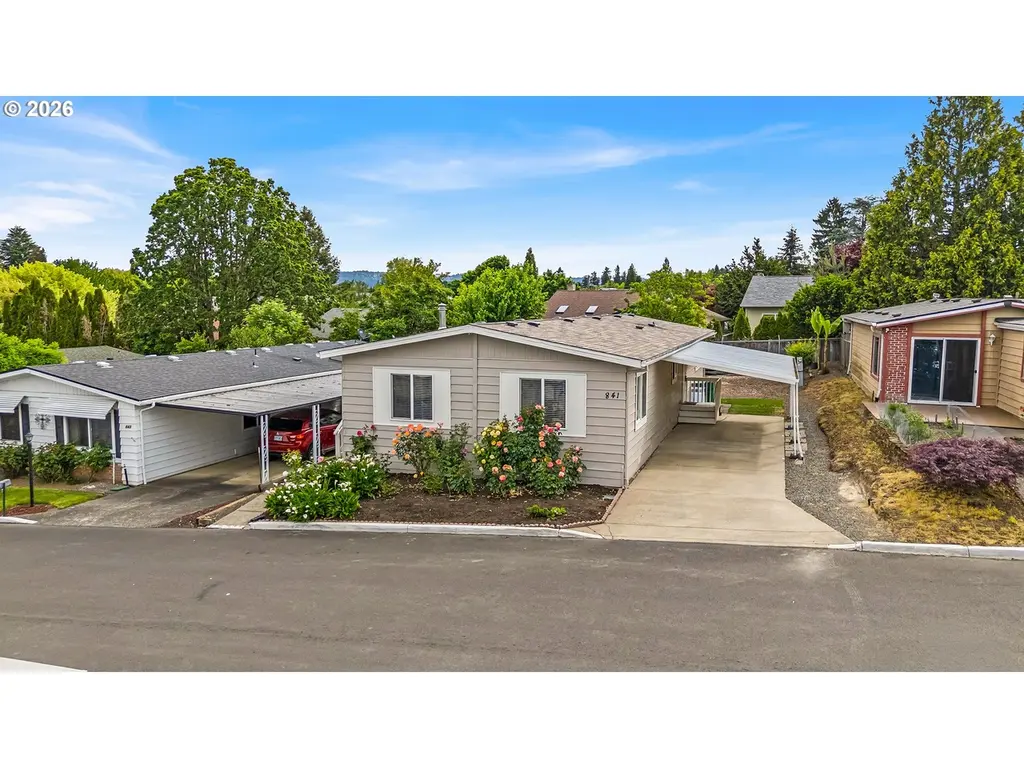
841 SW Liberty Bell Dr · Beaverton, OR
Flood risk 1/10 · Minimal
- FEMA flood zone
- X (unshaded)
- Chance of flooding over 30 yrs
- 0.0%
- Est. flood insurance / yr
- $507 – $1,088
Fire risk 1/10 · Minimal
- Est. fire insurance / yr
- $498 – $926
Heat risk 3/10 · Minor
- Hot days now (above 92°F)
- 7 days/yr
- Hot days in 30 yrs
- 14 days/yr
Wind risk 1/10 · Minimal
- Chance of severe wind over 30 yrs
- —
Air-quality risk 8/10 · Major
- Unhealthy air days now
- 11 days/yr
- Unhealthy air days in 30 yrs
- 11 days/yr
Risk factors via First Street. Map © Google.
Why this score? — see what drove the B- grade
The composite is a weighted blend of 9 inputs, each scored 0–100. Each bar is that input's sub-score; the figure is the points it added to the 100-point composite (weight × sub-score).
- Cash flow +28.7/30.0
- DSCR +10.0/10.0
- 1% rule +8.0/10.0
- Schools +6.3/10.0
- ARV discount +5.9/15.0
- Livability +4.4/5.0
- Condition / age +2.5/5.0
- Rent growth +2.1/5.0
- Appreciation +0.0/10.0
$170,000
🖨 Deal sheet 📄 Offer letter ✓ Due diligence
Listing remarks
Beautifully well maintained double wide located in Heritage Village Park offering comfortable and functional living throughout. This home features 3 bedrooms and 2 full bathrooms. Interior highlights include a welcoming living area and a spacious great room anchored by a wood burning fireplace, creating a warm and inviting gathering space. Recent updates include a newer furnace, newer windows with blinds, enhancing energy efficiency and natural light. Additional features include air conditioning and recessed lighting throughout, adding both comfort and a modern appeal. The backyard offers a garden area and a convenient tool shed for extra storage and outdoor projects. Residents at this park
Key facts
- Air conditioning
- Newer furnace
- Garden area
Tags
Property features AI
Finance
- Other: Lot rent $1,330 monthly (park lot rent)
- Financial info: Land lease: No
- HOA & community: Community amenities include basketball court, commons, pool, recreation facilities; Park community: Heritage Village; Community center with kitchen, playgrounds, heated pools, jacuzzi, basketball court, soccer field, fitness center, picnic area with BBQ; No pets allowed
Exterior
- Parking: Carport; Driveway
- Security: No security features listed
- Utilities: Public water; Public sewer; Electric service
- Home design: Manufactured home in park (model: BROOKWOOD, manufacturer: BENDIX); Single-level (one level); Residential property, resale; Built in 1977
- Construction: Composition roof; Wood siding exterior; Crawl space foundation; Year built 1977
- Exterior features: Deck; Tool shed; Wood siding; Level lot; Concrete and paved road access
Interior
- Kitchen: Built-in range; Dishwasher; Free-standing refrigerator; Kitchen island
- Bedrooms: Primary bedroom on main level with closet and ensuite; Second bedroom on main level with closet; Third bedroom on main level with closet
- Flooring: Laminate flooring
- Bathrooms: 2 full bathrooms (both on main level)
- Heating & cooling: Forced air heating; Central air conditioning; Electric hot water
- Interior features: Laminate flooring; Laundry area; Washer and dryer included; Wood-burning fireplace; Double-pane windows; Main-floor bedroom with bath (accessible, one-level living); Crawl space basement
- Laundry & utility: Main-level laundry with washer and dryer
Neighborhood map
What this means for you Summary
Snapshot
- This is a 3-bed/2.0-bath manufactured listed at $170k.
Deal economics
- At list price, monthly cash flow is $567 ($7k/yr) — positive.
- The deal already cash-flows at list — no discount required.
- Meets the 1% rule at list price ($2k rent vs $170k).
- Recommended offer: $167k (1.5% below list) — sets the bar for market timing.
- Cap rate 10.3% vs local median 2.2% in Beaverton — top-decile yield for the area; either an underpriced asset or a hidden risk that comps aren't pricing in. Stress-test before assuming the spread holds.
Location & tenants
- Location reads 88/100 on livability (#10 in OR, #251 nationally) — a professional / high-income tenant draw. Strengths: amenities A+, commute A+, employment A+; Watch: crime D, cost of living F.
- Beaverton SD 48J (urban): math 68% / reading 76% proficiency, ranked #3 of 58 in OR (top 5%) — strong family-tenant draw, lease renewals of 3-5y typical.
- Zoned schools: Elmonica Elementary School (math 64% / reading 84%, grade A, #23 of 412 statewide, top 7%, 413 students, 41% FRL); Five Oaks Middle School (math 44% / reading 74%, grade B, #17 of 128 statewide, top 14%, 781 students, 49% FRL); Westview High School (math 75% / reading 75%, grade A-, #2 of 143 statewide, top 6%, 2,442 students, 29% FRL).
- Market conditions: Rents soft (-1.6%/yr); 245 active listings in the ZIP; 40 comparable units currently listed for rent nearby; rentals at typical pace (median 18d on market — plan ~3-4 weeks tenant-placement turnaround); solid renter incomes; 2,224 units permitted in Washington County in 2024 (242 in 5+ unit buildings).
Forward outlook
- Local home prices are declining (-3.0%/yr); year-one equity from $1k of loan paydown is wiped out by about $5k of value loss. Plan a longer hold.
- Washington County population projected at +33% by 2050 — long-run rental-demand tailwind backs the buy-and-hold thesis.
Negotiation context
- It's been on market 20 days — a 2% lower offer ($167k) is reasonable based on typical stale-listing flexibility.
Questions for the listing agent
- Built in 1977 — when were the roof, HVAC, electrical panel, plumbing, and water heater last replaced?
- Is there a deadline driving the sale (1031 exchange, divorce, estate, relocation)? That informs how much negotiation room exists.
- Schools are A-rated — typically a magnet for longer-tenancy family renters. What's the average tenant stay here, and is there a school-zone premium baked into asking?
- Crime grade is D in this area — have there been break-ins, vandalism, or insurance claims at this property in the last 3 years? What carrier currently insures it and at what premium?
- What's the average days-on-market for RENTAL listings here right now (not sales)? A rising rental-DOM trend means longer vacancies and softer asking-rent achievability than the comps imply.
- What's the recent tenant-quality profile in this submarket — average credit score on applications, eviction rate, late-payment / NSF rate, and stable-employment percentage? A property-management company in the area should have these aggregated.
- How much new for-sale + rental construction is in the pipeline within 1–3 miles? Heavy new supply typically softens prices + rents 12–24 months out; constrained supply supports both.
Investment metrics
- 1% rule
- 1.30% ✓
- Cap rate
- 10.29%
- Cash-on-cash
- 14.29%
- DSCR
- 1.64
- GRM
- 6.4
CMA / ARV
- ARV (on-the-fly)
- $164,160
- Comps found
- 12
Show comp detail 12 sales within ~0.75 mi
| Address | Dist | Beds/Ba | Sqft | Sold | Price | $/sf | Match |
|---|---|---|---|---|---|---|---|
| 17660 SW Bunker Oak Rd | 0.07mi | 3/2.0 | 1,380 (-4%) | 2mo | $165,600 | $120 | 88 |
| 874 SW Liberty Bell Dr | 0.16mi | 3/2.0 | 1,448 (+1%) | 10mo | $165,000 | $114 | 83 |
| 17736 NW Shady Fir Loop | 0.41mi | 3/2.0 | 1,404 (-2%) | 1mo | $220,000 | $157 | 76 |
| 17730 SW Independence Way #253 | 0.25mi | 3/2.0 | 1,488 (+3%) | 10mo | $130,000 | $87 | 74 |
| 905 SW Liberty Bell Dr | 0.22mi | 3/2.0 | 1,447 (+0%) | 19mo | $130,000 | $90 | 74 |
| 17614 SW Richmond Way | 0.04mi | 4/2.0 (+1) | 1,512 (+5%) | 16mo | $93,000 | $62 | 71 |
| 520 SW Georgetown Way | 0.34mi | 4/2.0 (+1) | 1,344 (-7%) | 1mo | $75,000 | $56 | 67 |
| 17500 NW Shady Fir Loop | 0.33mi | 3/2.0 | 1,536 (+7%) | 12mo | $241,000 | $157 | 64 |
| 17595 SW Hancock Way #282 | 0.21mi | 3/2.0 | 1,335 (-7%) | 20mo | $160,000 | $120 | 62 |
| 17436 NW Shady Fir Loop | 0.35mi | 3/2.0 | 1,344 (-7%) | 19mo | $200,000 | $149 | 56 |
| 17643 NW Shady Fir Loop | 0.38mi | 3/2.0 | 1,530 (+6%) | 19mo | $174,900 | $114 | 56 |
| 375 SW Liberty Bell Dr | 0.28mi | 2/2.0 (-1) | 1,311 (-9%) | 15mo | $90,000 | $69 | 55 |
Match score weights: distance 35% · size 25% · config 20% · recency 20%. Top-matched comps best support the ARV.
Projected returns pro-forma
-3.0% appreciation · 0.0% rent growth · sell at horizon
- IRR
- 1.2%
- Equity multiple
- 1.04×
- Total profit
- $2,127
- Equity at exit
- $25,348
- IRR
- 7.6%
- Equity multiple
- 1.49×
- Total profit
- $23,505
- Equity at exit
- $14,698
Cash invested: $47,600 (down + closing). Projections, not guarantees.
Landlord ↔ Tenant lean methodology
- Overall (STATE)
- 28 Tenant-Leaning
- State Oregon
- 28 Tenant-Leaning · D+6
- County
- — inherits STATE
- City
- — inherits STATE
ZIP-level market 97006
- Rents YoY
- -1.6%
- Active inventory
- 245
- Price-to-rent
- 6.4×
Monthly cashflow live
- Estimated rent
- $2,205 high interval (Pro) →
- Mortgage (P&I)
- −$891
- Tax est. 1.5%
- −$212 /mo · $2,550/yr
- Insurance
- −$71
- HOA
- −$0
- Vacancy / Maint / Mgmt
- −$463
- Net cashflow
- $567
Break-even live
UW: 25.0% down · 7.5% · 30yr · 1.5% tax · 5.0% vac · 8.0% maint · 8.0% mgmt
Financing live
Cash to close
- Down payment
- $42,500
- Closing costs
- $5,100
- Reserves months
- —
- Total cash needed
- —
Loan-product check · same deal, 3 products live
Conventional
25% down · 7.5% · 30yr
- Down + closing
- —
- Monthly P&I
- —
- Monthly cashflow
- —
- DSCR
- —
- Eligible?
- —
Personal DTI + credit; lowest rate.
DSCR
20% down · 8.5% · 30yr
- Down + closing
- —
- Monthly P&I
- —
- Monthly cashflow
- —
- DSCR
- —
- Eligible?
- —
No personal income docs; deal must DSCR.
Hard money
10% down · 12.0% · 12mo
- Down + closing
- —
- Monthly P&I
- —
- Monthly cashflow
- —
- DSCR
- —
- Eligible?
- —
Short-term bridge; refi at stabilization.
Rent comps 40 comps
| Address | Beds | Baths | Sqft | Rent | $/sqft | DOM | Units | Dist |
|---|---|---|---|---|---|---|---|---|
| 908 SW 175th Ter Beaverton, OR | 3.0 | 2.5 | 1307 | $2,295 | $1.76 | 24d | 1 | 0.19mi |
| 900 SW 179th Ave Beaverton, OR | 4.0 | 2.0 | 1356 | $2,450 | $1.81 | 8d | 1 | 0.28mi |
| 17152 SW Whitley Way Beaverton, OR | 2.0 | 2.5 | 1260 | $2,275 | $1.81 | 16d | 1 | 0.28mi |
| 17040 SW Whitley Way #203 Beaverton, OR | 2.0 | 1.5 | 1200 | $1,695 | $1.41 | 44d | 1 | 0.31mi |
| 17030 SW Baseline Rd Beaverton, OR | 2.0 | 1.0 | 680 | $1,671 | $2.46 | 12d | 1 | 0.33mi |
| 1145 SW 170th Ave Beaverton, OR | 3.0 | 1.0–2.0 | 835 | $3,426 | $4.10 | 2d | 221 | 0.36mi |
| 1050 SW 170th Ave #201 Beaverton, OR | 3.0 | 2.5 | 1524 | $2,395 | $1.57 | 18d | 1 | 0.37mi |
| 17634 SW September Ln Beaverton, OR | 3.0 | 2.5 | 1582 | $2,345 | $1.48 | 18d | 1 | 0.38mi |
| 17472 SW Jay St Beaverton, OR | 3.0 | 2.5 | 1537 | $2,300 | $1.50 | 44d | 1 | 0.40mi |
| 1345 SW 172nd Ter Beaverton, OR | 1.0–3.0 | 1.0–2.0 | 970 | $2,482 | $2.56 | 2d | 20 | 0.42mi |
| 1333 SW 178th Ave Beaverton, OR | 3.0 | 2.0 | 1310 | $2,395 | $1.83 | 24d | 1 | 0.43mi |
| 18405 SW Stepping Stone Dr #43 Beaverton, OR | 3.0 | 2.5 | 1553 | $2,275 | $1.46 | 17d | 1 | 0.45mi |
| 17461 SW Rose Petal Ln Beaverton, OR | 3.0 | 2.5 | 1504 | $2,295 | $1.53 | 44d | 1 | 0.46mi |
| 16715 SW Baseline Rd Beaverton, OR | 3.0 | 2.0 | 1436 | $2,200 | $1.53 | 44d | 1 | 0.49mi |
| 1563 SW 172nd Ter Beaverton, OR | 3.0 | 1.0–1.5 | 730 | $2,290 | $3.14 | 2d | 26 | 0.52mi |
| 903 SW 185th Ave Hillsboro, OR | 2.0 | 2.0 | 985 | $1,622 | $1.65 | 8d | 6 | 0.57mi |
| 1614 SW 172nd Ter Beaverton, OR | 2.0 | 2.5 | 1498 | $2,195 | $1.47 | 44d | 1 | 0.57mi |
| 17565 NW Woodmere Ct Beaverton, OR | 3.0 | 2.0 | 1519 | $2,500 | $1.65 | 44d | 1 | 0.61mi |
| 915 SW 163rd Ave Beaverton, OR | 1.0–2.0 | 1.0–2.0 | 786 | $1,810 | $2.30 | 44d | 12 | 0.61mi |
| 16250 SW Jenkins Rd Beaverton, OR | 1.0–3.0 | 1.0–2.0 | 1007 | $1,790 | $1.78 | 44d | 1 | 0.61mi |
| 17391 SW Beaver Ct Beaverton, OR | 3.0 | 2.0 | 1380 | $2,295 | $1.66 | 44d | 1 | 0.62mi |
| 10667 NE Heritage Pkwy Hillsboro, OR | 1.0–3.0 | 1.0–2.0 | 914 | $2,332 | $2.55 | 2d | 13 | 0.63mi |
| 17208 SW Pleasanton Ln Beaverton, OR | 3.0 | 2.5 | 1460 | $2,450 | $1.68 | 8d | 1 | 0.65mi |
| 915 SW 163rd Ave Unit 718 Beaverton, OR | 2.0 | 2.0 | 913 | $1,675 | $1.83 | 8d | 1 | 0.67mi |
| 915 SW 163rd Ave Unit 2314 Beaverton, OR | 2.0 | 2.0 | 913 | $1,725 | $1.89 | 2d | 1 | 0.67mi |
| 915 SW 163rd Ave Unit 527 Beaverton, OR | 2.0 | 2.0 | 913 | $1,625 | $1.78 | 8d | 1 | 0.67mi |
| 915 SW 163rd Ave Unit 132 Beaverton, OR | 2.0 | 2.0 | 913 | $1,635 | $1.79 | 24d | 1 | 0.67mi |
| 17236 SW Berkeley Ln Beaverton, OR | 3.0 | 2.5 | 1500 | $2,395 | $1.60 | 15d | 1 | 0.68mi |
| 16201 NW Schendel Ave Beaverton, OR | 1.0–2.0 | 1.0–2.0 | 830 | $1,815 | $2.19 | 2d | 9 | 0.69mi |
| 17042 SW Berkeley Ln Beaverton, OR | 3.0 | 2.5 | 1475 | $2,249 | $1.52 | 24d | 1 | 0.70mi |
| 16275 SW Gage Ln Beaverton, OR | 3.0 | 2.5 | 1505 | $2,550 | $1.69 | 16d | 1 | 0.71mi |
| 10834 NE Holly St Hillsboro, OR | 2.0 | 2.0 | 966 | $1,995 | $2.07 | 12d | 1 | 0.71mi |
| 10664 NE Holly St Hillsboro, OR | 2.0 | 2.0 | 960 | $2,000 | $2.08 | 24d | 1 | 0.73mi |
| 18300 NW Walker Rd Beaverton, OR | 2.0 | 2.0 | 958 | $1,949 | $2.03 | 2d | 5 | 0.73mi |
| 16205 SW Gage Ln Beaverton, OR | 3.0 | 2.5 | 1541 | $2,345 | $1.52 | 18d | 1 | 0.73mi |
| 314 NE Edgeway Dr Beaverton, OR | 2.0 | 2.5 | 1300 | $2,395 | $1.84 | 24d | 1 | 0.74mi |
| 17300 SW Merlo Rd Apt 3 Beaverton, OR | 2.0 | 1.0 | 1000 | $1,450 | $1.45 | 3d | 1 | 0.75mi |
| 1248 SW 162nd Ave Beaverton, OR | 2.0 | 3.0 | 1170 | $2,150 | $1.84 | 18d | 1 | 0.76mi |
| 10795 NE Gateway Pl Beaverton, OR | 2.0 | 2.5 | 1104 | $2,099 | $1.90 | 24d | 1 | 0.76mi |
| 760 NW 185th Ave #207 Beaverton, OR | 2.0 | 2.0 | 1007 | $1,850 | $1.84 | 24d | 1 | 0.77mi |
Listing history 13 events
-
2026-06-18days on market $170,000 Active 20 DOM
-
2026-06-17days on market $170,000 Active 19 DOM
-
2026-06-16days on market $170,000 Active 18 DOM
-
2026-06-15days on market $170,000 Active 17 DOM
-
2026-06-13days on market $170,000 Active 15 DOM
-
2026-06-09days on market $170,000 Active 11 DOM
-
2026-06-08days on market $170,000 Active 10 DOM
-
2026-06-07days on market $170,000 Active 9 DOM
-
2026-06-05days on market $170,000 Active 6 DOM
-
2026-06-03days on market $170,000 Active 5 DOM
-
2026-06-02days on market $170,000 Active 4 DOM
-
2026-06-01days on market $170,000 Active 3 DOM
-
2026-05-31days on market $170,000 Active 2 DOM
ⓘ Source: listings_history table (triggers on properties + properties_extension) + one-shot
backfill from property_details.listing_events for pre-trigger history.
Climate risk First Street
- Flood 1/10 Low FEMA zone X (unshaded) · 0% chance over 30 yrs
- Wildfire 1/10 Low
- Heat 3/10 Moderate 7 d/yr ≥92°F today · 14 d/yr by 30 yrs out
- Wind 1/10 Low
- Air quality 8/10 Severe 11 unhealthy d/yr today · 11 by 30 yrs out
Nearby sold comps map
Loading sold comps map…
Walkable amenities ~0.75 mi
Loading nearby amenities…
Taxation est. · year 1
- Rental income
- $26,456
- − Mortgage interest
- −$9,523
- − Property taxes
- −$2,550
- − Insurance
- −$850
- − Repairs & maintenance
- −$2,116
- − Management
- −$2,116
- − Depreciation
- −$4,945
- Taxable income
- $4,355
- Est. tax owed @ 24.0%
- −$1,045
- After-tax cash flow
- $5,757/yr
For passive investors: Depreciation is non-cash, so a rental often shows a tax loss while cash-flowing — sheltering income. Rental losses are passive: they offset passive income freely, and up to $25,000/yr can offset ordinary (W-2) income if you actively participate and your MAGI is under $100k (phasing out to $0 by $150k); unused losses carry forward. On sale, claimed depreciation is recaptured at up to 25%, and gains may owe capital-gains tax (a 1031 exchange can defer both). Figures are a year-1 estimate at your 24.0% rate — not tax advice; consult a CPA.
Schools (NCES district)
- District
- Beaverton SD 48J
- NCES district ID
- 4101920
- Math proficiency
- 68% ▲ 14.00%
- Reading proficiency
- 76% ▲ 11.00%
- Median HH income
- $67,966
- Composite
- 62.72/100
- National rank
- #672
- State rank
- #3 of 58 in OR
Livability — Beaverton
- Score
- 88/100
- State rank
- #10
- US rank
- #251
Category grades
Schools grade is shown separately in the Schools card above.
Census & demographics
- County
- Washington County · 583,254 people
- City population
- 204,753
- Metro
- Portland-Vancouver-Hillsboro, OR-WA
- Population (ZIP)
- 46,463
- Household income
- $104,790
- Rent vs Own
- Severe rent burden
- 2200.0
Population outlook (Washington County) Hauer SSP2
- Today (2025)
- 674,042 people
- By 2030
- 721,804 · +7.1%
- By 2040
- 812,732 · +20.6%
- By 2050
- 895,143 · +32.8%
- By 2075
- 1,058,806 · +57.1%
- By 2100
- 1,131,692 · +67.9%
Race, ethnicity, and origin ACS 2023
- Neighborhood character
- Diverse neighborhood (Simpson 0.66)
- Race & ethnicity
- White 52% Asian 21% Hispanic / Latino 16% Two or more races 12% Black 3%
- Hispanic origin (detail)
- Mexican 12%
- Common ancestry
- Italian 4% Portuguese 3% Lithuanian 3%
- Foreign-born
- 22% · Canada, China, Vietnam
- Languages at home
- 71% English-only · Spanish 8% Other Asian/Pacific 6% Other Indo-European 5%
Political lean MEDSL · Washington
- 2024 margin
- Solid D (+34.0) · D 65.3% · R 31.3% · Other 3.4%
- 2008→2024 swing
- +11.8pp toward D · 2008: 22.1pp · 2024: 34.0pp
- All cycles
- 2024: D+34.0 2020: D+34.6 2016: D+26.7 2012: D+17.5 2008: D+22.1
Not yet ingested
- Civics
- —
Market trends
- HPI YoY
- ▼ -344.27%
- Current HPI
- 304.041
- Rent YoY
- ▼ -1.58%
- Metro
- Portland-Vancouver-Hillsboro, OR-WA
- State GDP YoY
- ▲ 2.05%
- F500 in state
- 2
Industry mix (Fortune 500 HQ in OR)
| Industry | F500 HQs | Revenue |
|---|---|---|
| Consumer Goods | 1 | $51B |
|
||
Price history
1 event — show timeline
- 2026-05-26 Listed $170,000 RMLS
Property tax history
+0.0%/yrLatest (2015): $6 · +0.0% YoY. Source: county tax records.
Cash-flow waterfall
monthlySold comps — $/sqft
last 12 mo · ≤1 miLoading sold comps…