 Multi-family
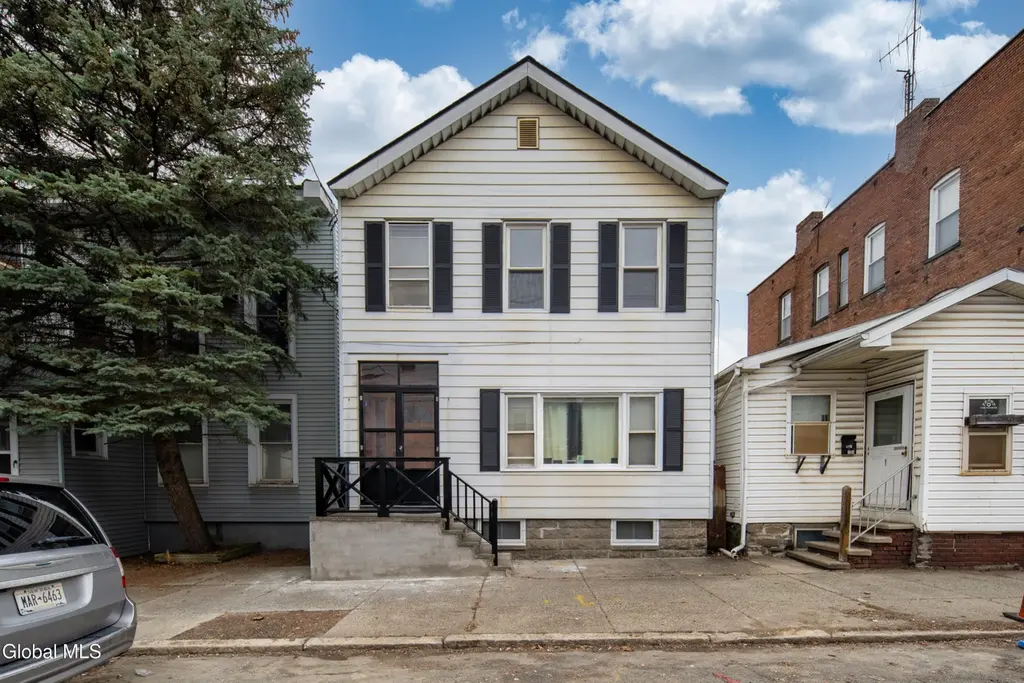
103 Congress St · Cohoes, NY
Flood risk 1/10 · Minimal
- FEMA flood zone
- X (unshaded)
- Chance of flooding over 30 yrs
- 0.0%
- Est. flood insurance / yr
- $473 – $860
Fire risk 3/10 · Minor
- Est. fire insurance / yr
- $691 – $1,283
Heat risk 4/10 · Minor
- Hot days now (above 98°F)
- 7 days/yr
- Hot days in 30 yrs
- 17 days/yr
Wind risk 3/10 · Minor
- Chance of severe wind over 30 yrs
- 6.0%
Air-quality risk 2/10 · Minimal
- Unhealthy air days now
- 0 days/yr
- Unhealthy air days in 30 yrs
- 1 days/yr
Risk factors via First Street. Map © Google.
Why this score? — see what drove the C+ grade
The composite is a weighted blend of 9 inputs, each scored 0–100. Each bar is that input's sub-score; the figure is the points it added to the 100-point composite (weight × sub-score).
- Cash flow +28.0/30.0
- DSCR +9.9/10.0
- 1% rule +7.5/10.0
- Rent growth +4.4/5.0
- ARV discount +4.3/15.0
- Livability +4.2/5.0
- Schools +3.6/10.0
- Condition / age +2.5/5.0
- Appreciation +0.0/10.0
$249,900
🖨 Deal sheet (PDF) 📄 Offer letter ✓ Due diligence
Multi-family units
County records classify this as Multi-Family (2-4 Unit). Listing-text estimate: 1 unit. estimate disagrees with records
Listing remarks MLS
Great investment or owner occupied 2 family with many updates. Long term tenants with month to month leases. Rents could be much higher.
Key facts
- Fully renovated
- New kitchen
- New bathroom
Tags
Neighborhood map
What this means for you Summary
Snapshot
- This is a 4-bed/2.0-bath multifamily listed at $250k.
Deal economics
- At list price, monthly cash flow is $778 ($9k/yr) — positive.
- The deal already cash-flows at list — no discount required.
- Meets the 1% rule at list price ($3k rent vs $250k).
- Cap rate 10.0% vs local median 4.7% in Cohoes — top-decile yield for the area; either an underpriced asset or a hidden risk that comps aren't pricing in. Stress-test before assuming the spread holds.
Location & tenants
- Location reads 83/100 on livability (#61 in NY, #895 nationally) — a professional / high-income tenant draw. Strengths: amenities A+, commute A+, housing A+; Watch: employment C-.
- Cohoes City School District (suburban): math 38% / reading 48% proficiency, ranked #487 of 590 in NY (top 82%) — families likely to look elsewhere, expect single-tenant / working-renter base with shorter leases.
- Market conditions: Rents rising fast (+7.6%/yr); 114 active listings in the ZIP; 8 comparable units currently listed for rent nearby; rentals at typical pace (median 20d on market — plan ~3-4 weeks tenant-placement turnaround); 675 units permitted in Albany County in 2024 (451 in 5+ unit buildings).
- At $3,117/mo this rent would consume 57% of the median local household income ($66k/yr) (locally 1395% of renters already pay >50% of income on rent) — very limited rent-growth headroom before tenants either downsize or default.
Forward outlook
- Local home prices are declining (-3.0%/yr); year-one equity from $2k of loan paydown is wiped out by about $7k of value loss. Plan a longer hold.
- Albany County population projected at +9% by 2050 — modest demand growth; plan on rents tracking national, not racing it.
- At projected returns (-3.0% appreciation + 7.6% rent growth), your $70k cash investment doubles in ~7 years — after that, you're playing with house money.
Negotiation context
- Only 14 days on market — expect competitive offers; lowballing is unlikely to land.
- 2 sale attempts since 4y ago with the ask held roughly flat each time — persistent listings suggest the price (not the market) is what's stuck; bring a comps-based counter.
Risks & watch-outs
- Watch-outs: built in 1900 — expect roof / HVAC / electrical / plumbing capex.
Questions for the listing agent
- Built in 1900 — when were the roof, HVAC, electrical panel, plumbing, and water heater last replaced?
- Is there a deadline driving the sale (1031 exchange, divorce, estate, relocation)? That informs how much negotiation room exists.
- What's the average days-on-market for RENTAL listings here right now (not sales)? A rising rental-DOM trend means longer vacancies and softer asking-rent achievability than the comps imply.
- What's the recent tenant-quality profile in this submarket — average credit score on applications, eviction rate, late-payment / NSF rate, and stable-employment percentage? A property-management company in the area should have these aggregated.
- How much new apartment / multifamily construction is in the pipeline within 1–3 miles? Heavy new supply (>2% of stock underway) typically softens rents 12–24 months out; light construction supports rent growth.
Investment metrics
- 1% rule
- 1.25% ✓
- Cap rate
- 10.03%
- Cash-on-cash
- 13.34%
- DSCR
- 1.59
- GRM
- 6.7
CMA / ARV
- ARV (on-the-fly)
- $233,280
- Comps found
- 12
Show comp detail 12 sales within ~0.75 mi
| Address | Dist | Beds/Ba | Sqft | Sold | Price | $/sf | Match |
|---|---|---|---|---|---|---|---|
| 35 Grant St | 0.37mi | 4/2.0 | 2,100 (-3%) | 0mo | $150,000 | $71 | 78 |
| 61 Main St | 0.13mi | 4/2.0 | 2,040 (-6%) | 10mo | $317,000 | $155 | 76 |
| 172 Congress St | 0.17mi | 5/2.0 (+1) | 2,094 (-3%) | 8mo | $120,000 | $57 | 75 |
| 61 Columbia St | 0.07mi | 4/3.0 | 2,408 (+12%) | 3mo | $260,000 | $108 | 72 |
| 119 Congress St | 0.04mi | 5/2.0 (+1) | 2,372 (+10%) | 8mo | $207,000 | $87 | 71 |
| 171 Lancaster St | 0.24mi | 4/2.0 | 2,308 (+7%) | 9mo | $245,500 | $106 | 70 |
| 59 Amity St | 0.50mi | 4/2.0 | 2,208 (+2%) | 5mo | $240,000 | $109 | 68 |
| 90 Central Ave | 0.23mi | 4/2.0 | 1,930 (-11%) | 10mo | $175,000 | $91 | 64 |
| 120 Mann Ave | 0.60mi | 4/2.0 | 2,112 (-2%) | 7mo | $305,000 | $144 | 63 |
| 4 Congress St | 0.26mi | 4/2.5 | 1,848 (-14%) | 3mo | $160,000 | $87 | 59 |
| 46 White St | 0.22mi | 5/2.0 (+1) | 1,900 (-12%) | 10mo | $250,000 | $132 | 57 |
| 35 Mangam St | 0.60mi | 4/4.0 | 2,320 (+7%) | 10mo | $356,000 | $153 | 43 |
Match score weights: distance 35% · size 25% · config 20% · recency 20%. Top-matched comps best support the ARV.
Projected returns pro-forma
-3.0% appreciation · 7.6% rent growth · sell at horizon
- IRR
- 8.4%
- Equity multiple
- 1.35×
- Total profit
- $24,155
- Equity at exit
- $37,261
- IRR
- 21.2%
- Equity multiple
- 3.19×
- Total profit
- $153,029
- Equity at exit
- $21,607
Cash invested: $69,972 (down + closing). Projections, not guarantees.
Landlord ↔ Tenant lean methodology
- Overall (STATE)
- 15 Strongly Tenant-Friendly
- State New York
- 15 Strongly Tenant-Friendly · D+10
- County
- — inherits STATE
- City
- — inherits STATE
ZIP-level market 12047
- Home prices YoY
- -10.7%
- Rents YoY
- 7.6%
- Active inventory
- 114
- Price-to-rent
- 13.4×
Monthly cashflow live
- Estimated rent
- $3,117 high interval (Pro) →
- Mortgage (P&I)
- −$1,311
- Tax from tax record
- −$270 /mo · $3,241/yr
- Insurance
- −$104
- HOA
- −$0
- Vacancy / Maint / Mgmt
- −$655
- Net cashflow
- $778
Break-even live
Sensitivity live
| Price | -10% $919 | -5% $848 | +0% $778 | +5% $707 | +10% $636 |
|---|---|---|---|---|---|
| Rent | -10% $531 | -5% $655 | +0% $778 | +5% $901 | +10% $1,024 |
| Rate | -1.0pp $904 | -0.5pp $841 | base $778 | +0.5pp $713 | +1.0pp $647 |
2-unit breakdown (identical units grouped — click to expand)
| Units | Beds | Baths | Est. rent |
|---|---|---|---|
| 2× units | 2 | 1 | $3,118 |
| #1 | 2 | 1 | $1,559 |
| #2 | 2 | 1 | $1,559 |
| Total (2 units) | $3,117 | ||
UW: 25.0% down · 7.5% · 30yr · 1.5% tax · 5.0% vac · 8.0% maint · 8.0% mgmt
Financing live
Cash to close
- Down payment
- $62,475
- Closing costs
- $7,497
- Reserves months
- —
- Total cash needed
- —
Loan-product check · same deal, 3 products live
Conventional
25% down · 7.5% · 30yr
- Down + closing
- —
- Monthly P&I
- —
- Monthly cashflow
- —
- DSCR
- —
- Eligible?
- —
Personal DTI + credit; lowest rate.
DSCR
20% down · 8.5% · 30yr
- Down + closing
- —
- Monthly P&I
- —
- Monthly cashflow
- —
- DSCR
- —
- Eligible?
- —
No personal income docs; deal must DSCR.
Hard money
10% down · 12.0% · 12mo
- Down + closing
- —
- Monthly P&I
- —
- Monthly cashflow
- —
- DSCR
- —
- Eligible?
- —
Short-term bridge; refi at stabilization.
Rent comps 8 comps
| Address | Beds | Baths | Sqft | Rent | $/sqft | DOM | Units | Dist |
|---|---|---|---|---|---|---|---|---|
| 12 White St Cohoes, NY | 3.0 | 2.0 | 1790 | $2,895 | $1.62 | 19d | 1 | 0.24mi |
| 192 Saratoga St Cohoes, NY | 1.0–3.0 | 1.0–3.0 | 1157 | $2,600 | $2.25 | 14d | 4 | 0.25mi |
| 6 Hamilton Pl Unit 2 Cohoes, NY | 3.0 | 1.0 | 2300 | $1,999 | $0.87 | 19d | 1 | 0.81mi |
| 53 Park Ave Cohoes, NY | 3.0 | 1.0 | 1875 | $1,600 | $0.85 | 14d | 1 | 0.86mi |
| 100 N Mohawk St Cohoes, NY | 1.0–3.0 | 1.0–3.0 | 1769 | $3,840 | $2.17 | 14d | 18 | 0.93mi |
| 8 Cindy Way Cohoes, NY | 3.0 | 1.5 | 1420 | $2,300 | $1.62 | 44d | 1 | 1.09mi |
| 290 2nd Ave Troy, NY | 3.0 | 1.0 | 1400 | $1,600 | $1.14 | 21d | 1 | 1.11mi |
| 131 6th Ave Troy, NY | 4.0 | 1.0 | 1400 | $2,325 | $1.66 | 14d | 1 | 1.40mi |
Listing history 5 events
-
2026-04-03status Pending
-
2026-03-20$249,900 Active
-
2022-09-02status Pending 136-char remark
Show marketing remark (136 chars)
Great investment or owner occupied 2 family with many updates. Long term tenants with month to month leases. Rents could be much higher.
-
2022-08-24price $145,000 136-char remark
Show marketing remark (136 chars)
Great investment or owner occupied 2 family with many updates. Long term tenants with month to month leases. Rents could be much higher.
-
2022-07-28$150,000 Active 136-char remark
Show marketing remark (136 chars)
Great investment or owner occupied 2 family with many updates. Long term tenants with month to month leases. Rents could be much higher.
ⓘ Source: listings_history table (triggers on properties + properties_extension) + one-shot
backfill from property_details.listing_events for pre-trigger history.
Tax reassessment forecast NY · Partial reset (capped growth)
- Current annual tax
- $3,241 · $270/mo
- Projected year-2 tax
- $3,732 · $311/mo
- Expected delta
- +$491/yr (+$41/mo · 15.2%)
ⓘ Screening estimate from a state-policy table — verify with the county assessor before closing.
Climate risk First Street
- Flood 1/10 Low FEMA zone X (unshaded) · 0% chance over 30 yrs
- Wildfire 3/10 Moderate
- Heat 4/10 Moderate 7 d/yr ≥98°F today · 17 d/yr by 30 yrs out
- Wind 3/10 Moderate 6% chance of damaging wind over 30 yrs
- Air quality 2/10 Low 0 unhealthy d/yr today · 1 by 30 yrs out
Nearby sold comps map
Loading sold comps map…
Walkable amenities ~0.75 mi
Loading nearby amenities…
Taxation est. · year 1
- Rental income
- $37,404
- − Mortgage interest
- −$13,998
- − Property taxes
- −$3,241
- − Insurance
- −$1,250
- − Repairs & maintenance
- −$2,992
- − Management
- −$2,992
- − Depreciation
- −$7,270
- Taxable income
- $5,661
- Est. tax owed @ 24.0%
- −$1,359
- After-tax cash flow
- $7,974/yr
For passive investors: Depreciation is non-cash, so a rental often shows a tax loss while cash-flowing — sheltering income. Rental losses are passive: they offset passive income freely, and up to $25,000/yr can offset ordinary (W-2) income if you actively participate and your MAGI is under $100k (phasing out to $0 by $150k); unused losses carry forward. On sale, claimed depreciation is recaptured at up to 25%, and gains may owe capital-gains tax (a 1031 exchange can defer both). Figures are a year-1 estimate at your 24.0% rate — not tax advice; consult a CPA.
Schools (NCES district)
- District
- Cohoes City School District
- NCES district ID
- 3607980
- Math proficiency
- 38% ▼ -4.00%
- Reading proficiency
- 48% ▲ 3.00%
- Median HH income
- $45,104
- Composite
- 36.48/100
- National rank
- #4655
- State rank
- #487 of 590 in NY
Livability — Cohoes
- Score
- 83/100
- State rank
- #61
- US rank
- #895
Category grades
Schools grade is shown separately in the Schools card above.
Census & demographics
- Census place
- Cohoes, NY
- County
- Albany County · 196,626 people
- City population
- 23,532
- Metro
- Albany-Schenectady-Troy, NY
- Population (ZIP)
- 23,532
- Household income
- $66,071
- Rent vs Own
- Severe rent burden
- 1395.0
Population outlook (Albany County) Hauer SSP2
- Today (2025)
- 320,794 people
- By 2030
- 327,401 · +2.1%
- By 2040
- 338,218 · +5.4%
- By 2050
- 348,467 · +8.6%
- By 2075
- 381,693 · +19.0%
- By 2100
- 393,809 · +22.8%
Race, ethnicity, and origin ACS 2023
- Neighborhood character
- Predominantly White (70%)
- Race & ethnicity
- White 70% Two or more races 11% Black 9% Hispanic / Latino 7% Asian 5%
- Hispanic origin (detail)
- Puerto Rican 3% Dominican 2%
- Common ancestry
- Lithuanian 8% Romanian 6% Iranian 2%
- Foreign-born
- 9% · Canada, China
- Languages at home
- 87% English-only · Spanish 3% Other Indo-European 3% Chinese 2%
Political lean MEDSL · Albany
- 2024 margin
- Strong D (+25.8) · D 62.9% · R 37.1%
- 2008→2024 swing
- -3.6pp toward R · 2008: 29.4pp · 2024: 25.8pp
- All cycles
- 2024: D+25.8 2020: D+31.4 2016: D+24.3 2012: D+31.0 2008: D+29.4
Not yet ingested
- Civics
- —
Market trends
- HPI YoY
- ▼ -38.15%
- Current HPI
- 317.4057
- Rent YoY
- ▲ 7.60%
- Metro
- Albany-Schenectady-Troy, NY
- State GDP YoY
- ▲ 2.60%
- F500 in state
- 92
Industry mix (Fortune 500 HQ in NY)
| Industry | F500 HQs | Revenue |
|---|---|---|
| Financial Services | 10 | $950B |
|
||
| Consumer Goods | 9 | $162B |
|
||
| Insurance | 4 | $225B |
|
||
| Telecommunications | 2 | $144B |
|
||
| Pharmaceuticals | 2 | $112B |
|
||
| Media / Entertainment | 2 | $69B |
|
||
Price history
+66.6% since first listed5 events — show timeline
- 2026-04-03 Pending — Global MLS
- 2026-03-20 Listed $249,900 Global MLS
- 2022-09-02 Pending — Global MLS
- 2022-08-24 Price Changed $145,000 Global MLS
- 2022-07-28 Listed $150,000 Global MLS
Property tax history
+4.1%/yrLatest (2025): $3,241 · -27.9% YoY. Source: county tax records.
Cash-flow waterfall
monthlySold comps — $/sqft
last 12 mo · ≤1 miLoading sold comps…