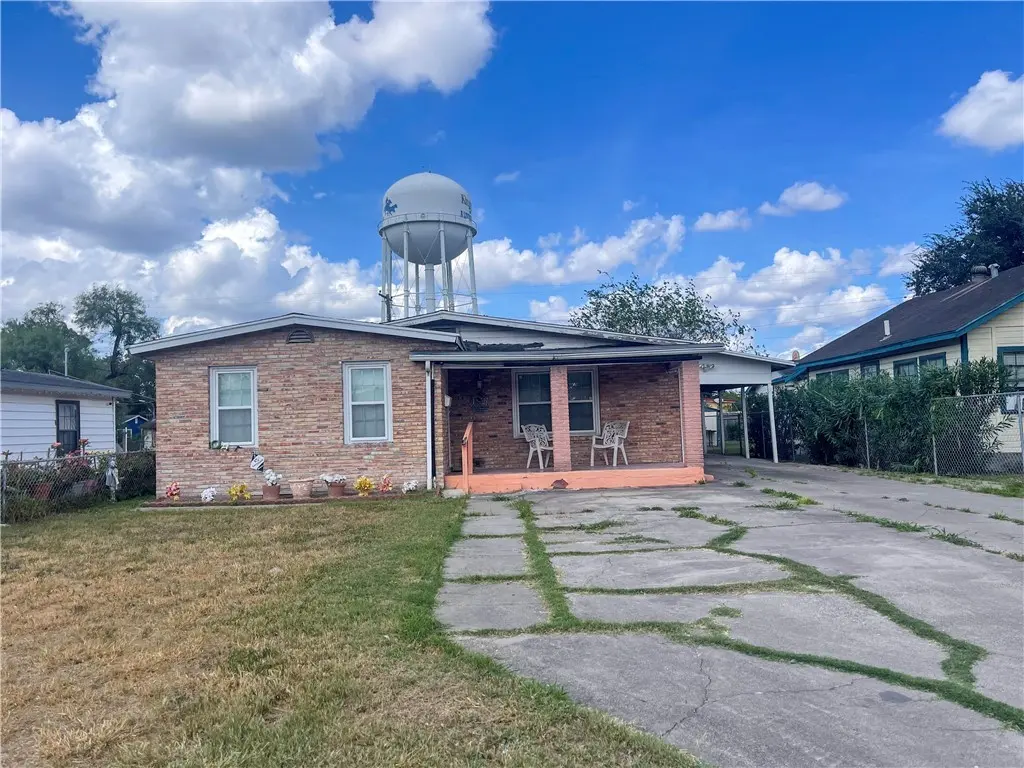
826 E Lott Ave · Kingsville, TX
Flood risk 6/10 · Moderate
- FEMA flood zone
- X (unshaded)
- Chance of flooding over 30 yrs
- 0.67%
- Est. flood insurance / yr
- $507 – $1,088
Fire risk 5/10 · Moderate
- Est. fire insurance / yr
- $1,222 – $2,270
Heat risk 9/10 · Severe
- Hot days now (above 111°F)
- 7 days/yr
- Hot days in 30 yrs
- 22 days/yr
Wind risk 8/10 · Major
- Chance of severe wind over 30 yrs
- 99.0%
Air-quality risk 1/10 · Minimal
- Unhealthy air days now
- 0 days/yr
- Unhealthy air days in 30 yrs
- 0 days/yr
Risk factors via First Street. Map © Google.
Why this score? — see what drove the B+ grade
The composite is a weighted blend of 9 inputs, each scored 0–100. Each bar is that input's sub-score; the figure is the points it added to the 100-point composite (weight × sub-score).
- Cash flow +30.0/30.0
- ARV discount +15.0/15.0
- 1% rule +10.0/10.0
- DSCR +10.0/10.0
- Rent growth +4.3/5.0
- Livability +3.5/5.0
- Condition / age +2.5/5.0
- Schools +1.5/10.0
- Appreciation +0.0/10.0
$109,900
🖨 Deal sheet (PDF) 📄 Offer letter ✓ Due diligence
Listing remarks MLS
Calling all Investors! This property is a perfect INVESTMENT OPPORTUNITY! 3 bedroom, 1 bathroom home with a large covered patio. Property is being sold "AS IS". Must see to appreciate!
Key facts
- 7,000 sq ft lot
- 2 garage spots
- Built 1955
Neighborhood map
What this means for you Summary
Snapshot
- This is a 3-bed/2.0-bath single-family listed at $110k.
Deal economics
- At list price, monthly cash flow is $562 ($7k/yr) — positive.
- The deal already cash-flows at list — no discount required.
- Meets the 1% rule at list price ($2k rent vs $110k).
- Recommended offer: $97k (12.0% below list) — sets the bar for market timing.
- Cap rate 12.4% vs local median 5.4% in Kingsville — top-decile yield for the area; either an underpriced asset or a hidden risk that comps aren't pricing in. Stress-test before assuming the spread holds.
Location & tenants
- Location reads 70/100 on livability (#364 in TX) — a middle-class / working-renter tenant base. Strengths: cost of living A+, housing A+, health & safety A+; Watch: schools D+, employment D, amenities F.
- Kingsville ISD (town): math 13% / reading 22% proficiency, ranked #800 of 826 in TX (top 97%) — low school quality limits family demand, transient renter base, plan for 1-2y turnover; 71% free/reduced lunch — lower-income household profile, screen leases tightly.
- Market conditions: Rents rising fast (+7.2%/yr); 227 active listings in the ZIP; 9 comparable units currently listed for rent nearby; rentals at typical pace (median 22d on market — plan ~3-4 weeks tenant-placement turnaround); 44% of comp listings sitting > 30 days — soft ceiling on asking rent; 24 units permitted in Kleberg County in 2024 (0 in 5+ unit buildings).
- This rent runs 35% of the median local income ($61k/yr) — at the standard rent-burdened threshold; future hikes will face affordability resistance.
Forward outlook
- Local home prices are declining (-3.0%/yr); year-one equity from $760 of loan paydown is wiped out by about $3k of value loss. Plan a longer hold.
- Kleberg County population projected at +9% by 2050 — modest demand growth; plan on rents tracking national, not racing it.
- At projected returns (-3.0% appreciation + 7.2% rent growth), your $31k cash investment doubles in ~5 years — after that, you're playing with house money.
Negotiation context
- It's been on market 250 days — a 12% lower offer ($97k) is reasonable based on typical stale-listing flexibility.
Risks & watch-outs
- Watch-outs: built in 1955 — expect roof / HVAC / electrical / plumbing capex.
- Climate carrying-cost: major flood risk; severe wind risk, 99% chance of damaging wind over 30y; moderate wildfire risk; extreme-heat days projected 7→22/yr by 2055 (HVAC capex compounding) — expect insurance premiums to compound above CPI over the hold.
Questions for the listing agent
- It's been on market 250 days. Have you received any prior offers? Is the seller open to a 12% concession, seller financing, or rate buy-down credit?
- Built in 1955 — when were the roof, HVAC, electrical panel, plumbing, and water heater last replaced?
- Why hasn't it sold? Are there any deal-killer items the seller is aware of (foundation, flood, title, zoning, code violations)?
- Is there a deadline driving the sale (1031 exchange, divorce, estate, relocation)? That informs how much negotiation room exists.
- Schools are D-rated, which usually means shorter tenancies and higher turnover. Who's the typical renter profile here, and what's been the actual vacancy rate?
- What's the average days-on-market for RENTAL listings here right now (not sales)? A rising rental-DOM trend means longer vacancies and softer asking-rent achievability than the comps imply.
- What's the recent tenant-quality profile in this submarket — average credit score on applications, eviction rate, late-payment / NSF rate, and stable-employment percentage? A property-management company in the area should have these aggregated.
- How much new for-sale + rental construction is in the pipeline within 1–3 miles? Heavy new supply typically softens prices + rents 12–24 months out; constrained supply supports both.
Investment metrics
- 1% rule
- 1.59% ✓
- Cap rate
- 12.43%
- Cash-on-cash
- 21.93%
- DSCR
- 1.98
- GRM
- 5.2
CMA / ARV
- ARV (median comp)
- $183,691
- List price
- $109,900
- Delta
- -40.17%
- Verdict
- UNDERPRICED
- Comps
- 20 within 1.0 mi
Show comp detail 12 sales within ~0.75 mi
| Address | Dist | Beds/Ba | Sqft | Sold | Price | $/sf | Match |
|---|---|---|---|---|---|---|---|
| 423 S 13th St | 0.07mi | 4/2.0 (+1) | 1,616 (+2%) | 11mo | $48,500 | $30 | 80 |
| 434 E County Rd 2090 | 0.17mi | 3/2.0 | 1,581 (-1%) | 14mo | $230,000 | $145 | 79 |
| 622 S 12th St | 0.21mi | 3/2.0 | 1,368 (-14%) | 2mo | $24,950 | $18 | 65 |
| 1021 Hall | 0.62mi | 3/2.0 | 1,594 (+0%) | 16mo | $195,000 | $122 | 58 |
| 427 E Johnston | 0.42mi | 3/3.0 | 1,544 (-3%) | 18mo | $245,000 | $159 | 57 |
| 726 Lyndale St | 0.59mi | 3/2.0 | 1,484 (-7%) | 14mo | $255,900 | $172 | 50 |
| 1111 La Esmeralda Dr | 0.75mi | 3/2.0 | 1,556 (-2%) | 15mo | $315,900 | $203 | 49 |
| 1019 E Lee Ave | 0.42mi | 3/3.0 | 1,446 (-9%) | 16mo | $85,000 | $59 | 48 |
| 903 Lyndale St | 0.60mi | 4/2.0 (+1) | 1,785 (+12%) | 1mo | $177,500 | $99 | 46 |
| 512 E Shelton | 0.68mi | 3/2.5 | 1,664 (+5%) | 17mo | $265,000 | $159 | 45 |
| 1102 S 11th St | 0.54mi | 3/1.0 | 1,434 (-10%) | 12mo | $135,900 | $95 | 44 |
| 315 E Alice Ave | 0.65mi | 3/1.0 | 1,462 (-8%) | 20mo | $124,800 | $85 | 36 |
Match score weights: distance 35% · size 25% · config 20% · recency 20%. Top-matched comps best support the ARV.
Projected returns pro-forma
-3.0% appreciation · 7.18% rent growth · sell at horizon
- IRR
- 19.5%
- Equity multiple
- 1.84×
- Total profit
- $25,715
- Equity at exit
- $16,386
- IRR
- 30.6%
- Equity multiple
- 4.35×
- Total profit
- $102,971
- Equity at exit
- $9,502
Cash invested: $30,772 (down + closing). Projections, not guarantees.
Landlord ↔ Tenant lean methodology
- Overall (STATE)
- 87 Strongly Landlord-Friendly
- State Texas
- 87 Strongly Landlord-Friendly · R+5
- County
- — inherits STATE
- City
- — inherits STATE
ZIP-level market 78363
- Rents YoY
- 7.2%
- Active inventory
- 227
- Price-to-rent
- 5.2×
Monthly cashflow live
- Estimated rent
- $1,745 high interval (Pro) →
- Mortgage (P&I)
- −$576
- Tax from tax record
- −$194 /mo · $2,331/yr
- Insurance
- −$46
- HOA
- −$0
- Vacancy / Maint / Mgmt
- −$366
- Net cashflow
- $562
Break-even live
Sensitivity live
| Price | -10% $625 | -5% $593 | +0% $562 | +5% $531 | +10% $500 |
|---|---|---|---|---|---|
| Rent | -10% $424 | -5% $493 | +0% $562 | +5% $631 | +10% $700 |
| Rate | -1.0pp $618 | -0.5pp $590 | base $562 | +0.5pp $534 | +1.0pp $505 |
UW: 25.0% down · 7.5% · 30yr · 1.5% tax · 5.0% vac · 8.0% maint · 8.0% mgmt
Financing live
Cash to close
- Down payment
- $27,475
- Closing costs
- $3,297
- Reserves months
- —
- Total cash needed
- —
Loan-product check · same deal, 3 products live
Conventional
25% down · 7.5% · 30yr
- Down + closing
- —
- Monthly P&I
- —
- Monthly cashflow
- —
- DSCR
- —
- Eligible?
- —
Personal DTI + credit; lowest rate.
DSCR
20% down · 8.5% · 30yr
- Down + closing
- —
- Monthly P&I
- —
- Monthly cashflow
- —
- DSCR
- —
- Eligible?
- —
No personal income docs; deal must DSCR.
Hard money
10% down · 12.0% · 12mo
- Down + closing
- —
- Monthly P&I
- —
- Monthly cashflow
- —
- DSCR
- —
- Eligible?
- —
Short-term bridge; refi at stabilization.
Rent comps 9 comps
| Address | Beds | Baths | Sqft | Rent | $/sqft | DOM | Units | Dist |
|---|---|---|---|---|---|---|---|---|
| 1107 E Kenedy Ave Kingsville, TX | 3.0 | 2.5 | 1526 | $2,300 | $1.51 | 22d | 1 | 0.23mi |
| 908 E Doddridge Ave Kingsville, TX | 3.0 | 1.0 | 1100 | $850 | $0.77 | 44d | 1 | 0.29mi |
| 307 W Alice Ave Kingsville, TX | 3.0 | 2.0 | 1600 | $1,500 | $0.94 | 44d | 1 | 0.92mi |
| 915 S 23rd St Kingsville, TX | 3.0 | 2.0 | 1713 | $1,900 | $1.11 | 14d | 1 | 0.94mi |
| 710 E C Ave Kingsville, TX | 3.0 | 2.0 | 1248 | $1,250 | $1.00 | 14d | 1 | 0.97mi |
| 1342 Virginia Ave Kingsville, TX | 3.0 | 2.0 | 1764 | $2,500 | $1.42 | 22d | 1 | 0.99mi |
| 614 W Alice Ave Kingsville, TX | 3.0 | 2.0 | 1713 | $1,599 | $0.93 | 44d | 1 | 1.19mi |
| 629 W Nettie Ave Kingsville, TX | 3.0 | 2.0 | 1762 | $1,495 | $0.85 | 44d | 1 | 1.33mi |
| 503 W Mesquite Ave Kingsville, TX | 3.0 | 2.0 | 1400 | $1,500 | $1.07 | 14d | 1 | 1.44mi |
Listing history 19 events
-
2026-06-21days on market $109,900 Active 250 DOM
-
2026-06-19days on market $109,900 Active 248 DOM
-
2026-06-18days on market $109,900 Active 247 DOM
-
2026-06-17days on market $109,900 Active 246 DOM
-
2026-06-16days on market $109,900 Active 245 DOM
-
2026-06-15days on market $109,900 Active 244 DOM
-
2026-06-14days on market $109,900 Active 242 DOM
-
2026-06-12days on market $109,900 Active 241 DOM
-
2026-06-09days on market $109,900 Active 238 DOM
-
2026-06-08days on market $109,900 Active 237 DOM
-
2026-06-07days on market $109,900 Active 236 DOM
-
2026-06-05days on market $109,900 Active 233 DOM
-
2026-06-03days on market $109,900 Active 232 DOM
-
2026-06-02days on market $109,900 Active 231 DOM
-
2026-06-01days on market $109,900 Active 230 DOM
-
2026-05-31days on market $109,900 Active 229 DOM
-
2026-05-30days on market $109,900 Active 228 DOM
-
2026-01-29price $109,900 194-char remark
Show marketing remark (194 chars)
Calling all Investors! This property is a perfect INVESTMENT OPPORTUNITY! 3 bedroom, 1 bathroom home with a large covered patio. Property is being sold "AS IS". Must see to appreciate!
-
2025-10-14$119,500 Active 194-char remark
Show marketing remark (194 chars)
Calling all Investors! This property is a perfect INVESTMENT OPPORTUNITY! 3 bedroom, 1 bathroom home with a large covered patio. Property is being sold "AS IS". Must see to appreciate!
ⓘ Source: listings_history table (triggers on properties + properties_extension) + one-shot
backfill from property_details.listing_events for pre-trigger history.
Tax reassessment forecast TX · Resets to sale price
- Current annual tax
- $2,331 · $194/mo
- Projected year-2 tax
- $2,331 · $194/mo
- Expected delta
- $0/yr ($0/mo · 0.0%)
ⓘ Screening estimate from a state-policy table — verify with the county assessor before closing.
Climate risk First Street
- Flood 6/10 Major FEMA zone X (unshaded) · 67% chance over 30 yrs
- Wildfire 5/10 Major
- Heat 9/10 Extreme 7 d/yr ≥111°F today · 22 d/yr by 30 yrs out
- Wind 8/10 Severe 99% chance of damaging wind over 30 yrs
- Air quality 1/10 Low 0 unhealthy d/yr today · 0 by 30 yrs out
Nearby sold comps map
Loading sold comps map…
Walkable amenities ~0.75 mi
Loading nearby amenities…
Taxation est. · year 1
- Rental income
- $20,942
- − Mortgage interest
- −$6,156
- − Property taxes
- −$2,331
- − Insurance
- −$550
- − Repairs & maintenance
- −$1,675
- − Management
- −$1,675
- − Depreciation
- −$3,197
- Taxable income
- $5,358
- Est. tax owed @ 24.0%
- −$1,286
- After-tax cash flow
- $5,462/yr
For passive investors: Depreciation is non-cash, so a rental often shows a tax loss while cash-flowing — sheltering income. Rental losses are passive: they offset passive income freely, and up to $25,000/yr can offset ordinary (W-2) income if you actively participate and your MAGI is under $100k (phasing out to $0 by $150k); unused losses carry forward. On sale, claimed depreciation is recaptured at up to 25%, and gains may owe capital-gains tax (a 1031 exchange can defer both). Figures are a year-1 estimate at your 24.0% rate — not tax advice; consult a CPA.
Schools (NCES district)
- District
- Kingsville ISD
- NCES district ID
- 4825680
- Math proficiency
- 13% ▼ -22.00%
- Reading proficiency
- 22% ▼ -7.00%
- Median HH income
- $36,308
- Composite
- 14.5/100
- National rank
- #9425
- State rank
- #800 of 826 in TX
Livability — Kingsville
- Score
- 70/100
- State rank
- #364
- US rank
- #7787
Category grades
Schools grade is shown separately in the Schools card above.
Census & demographics
- Census place
- Kingsville, TX
- County
- Kleberg County · 28,920 people
- City population
- 28,920
- Metro
- Kingsville, TX
- Population (ZIP)
- 28,920
- Household income
- $60,574
- Rent vs Own
- Severe rent burden
- 1663.0
Population outlook (Kleberg County) Hauer SSP2
- Today (2025)
- 31,615 people
- By 2030
- 32,054 · +1.4%
- By 2040
- 33,008 · +4.4%
- By 2050
- 34,536 · +9.2%
- By 2075
- 40,931 · +29.5%
- By 2100
- 46,001 · +45.5%
Race, ethnicity, and origin ACS 2023
- Neighborhood character
- Predominantly Hispanic (72%)
- Race & ethnicity
- Hispanic / Latino 72% Two or more races 36% White 20% Black 3% Asian 1% Native American 1%
- Hispanic origin (detail)
- Mexican 67%
- Common ancestry
- Italian 2% Slovak 1% Portuguese 1%
- Foreign-born
- 7% · Canada, China
- Languages at home
- 65% English-only · Spanish 32% Other Indo-European 1%
Political lean MEDSL · Kleberg
- 2024 margin
- R (+12.7) · D 43.3% · R 56.1%
- 2008→2024 swing
- -20.0pp toward R · 2008: 7.2pp · 2024: -12.7pp
- All cycles
- 2024: R+12.7 2020: R+1.7 2016: D+3.7 2012: D+7.8 2008: D+7.2
Not yet ingested
- Civics
- —
Market trends
- HPI YoY
- ▼ -87.12%
- Current HPI
- 147.6473
- Rent YoY
- ▲ 7.18%
- Metro
- Kingsville, TX
- State GDP YoY
- ▲ 3.95%
- F500 in state
- 110
Industry mix (Fortune 500 HQ in TX)
| Industry | F500 HQs | Revenue |
|---|---|---|
| Energy | 16 | $1,198B |
|
||
| Technology | 5 | $198B |
|
||
| Engineering / Construction | 4 | $72B |
|
||
| Energy Services | 3 | $60B |
|
||
| Utilities | 3 | $41B |
|
||
| Healthcare | 2 | $330B |
|
||
Price history
-8.0% since first listed2 events — show timeline
- 2026-01-29 Price Changed $109,900 CBMLS
- 2025-10-14 Listed $119,500 CBMLS
Property tax history
+4.5%/yrLatest (2025): $2,331 · +19.4% YoY. Source: county tax records.
Cash-flow waterfall
monthlySold comps — $/sqft
last 12 mo · ≤1 miLoading sold comps…