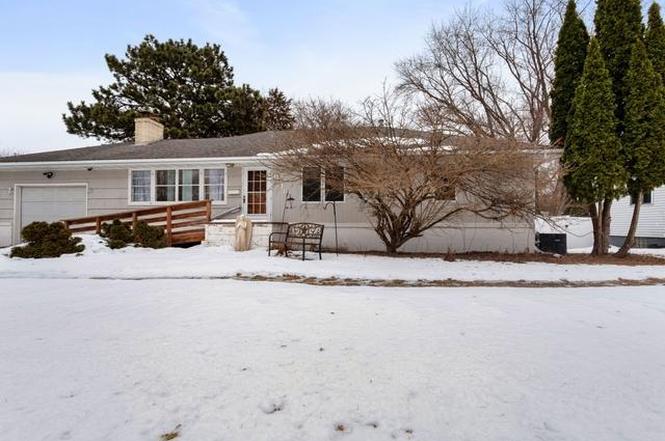
6018 Halifax Pl · Brooklyn Center, MN
Flood risk 6/10 · Moderate
- FEMA flood zone
- X (unshaded)
- Chance of flooding over 30 yrs
- 0.72%
- Est. flood insurance / yr
- $473 – $860
Fire risk 1/10 · Minimal
- Est. fire insurance / yr
- $888 – $1,650
Heat risk 2/10 · Minimal
- Hot days now (above 99°F)
- 7 days/yr
- Hot days in 30 yrs
- 14 days/yr
Wind risk 2/10 · Minimal
- Chance of severe wind over 30 yrs
- —
Air-quality risk 2/10 · Minimal
- Unhealthy air days now
- 2 days/yr
- Unhealthy air days in 30 yrs
- 2 days/yr
Risk factors via First Street. Map © Google.
Why this score? — see what drove the C grade
The composite is a weighted blend of 9 inputs, each scored 0–100. Each bar is that input's sub-score; the figure is the points it added to the 100-point composite (weight × sub-score).
- Cash flow +23.2/30.0
- DSCR +7.5/10.0
- ARV discount +7.5/15.0
- 1% rule +5.9/10.0
- Livability +3.7/5.0
- Schools +3.0/10.0
- Rent growth +2.5/5.0
- Condition / age +2.5/5.0
- Appreciation +0.0/10.0
$275,000
🖨 Deal sheet 📄 Offer letter ✓ Due diligence
Listing remarks MLS
Beautiful 4br on same level 2ba large turn key walkout rambler on nice treed lot. Great finished wood floors on main level, newer carpet LL. Many updates. New roof 2005, newer windows, central air, furnace and freshly painted. Close to shopping and 694.
Key facts
- 0.23 acre lot
- Garage
- Built 1955
Tags
Neighborhood map
What this means for you Summary
Snapshot
- This is a 3-bed/2.5-bath single-family listed at $275k.
Deal economics
- At list price, monthly cash flow is $499 ($6k/yr) — positive.
- The deal already cash-flows at list — no discount required.
- Meets the 1% rule at list price ($3k rent vs $275k).
- Recommended offer: $258k (6.0% below list) — sets the bar for market timing.
- Cap rate 8.5% vs local median 5.0% in Brooklyn Center — top-decile yield for the area; either an underpriced asset or a hidden risk that comps aren't pricing in. Stress-test before assuming the spread holds.
Location & tenants
- Location reads 73/100 on livability (#253 in MN) — a middle-class / working-renter tenant base. Strengths: commute A+, housing A+, cost of living A-; Watch: schools D+, crime F, amenities F.
- Robbinsdale Public School District (suburban): math 24% / reading 44% proficiency, ranked #250 of 301 in MN (top 83%) — families likely to look elsewhere, expect single-tenant / working-renter base with shorter leases.
- Market conditions: 87 active listings in the ZIP; 1 comparable units currently listed for rent nearby; 4,651 units permitted in Hennepin County in 2024 (2,443 in 5+ unit buildings).
Forward outlook
- Local home prices are declining (-3.0%/yr); year-one equity from $2k of loan paydown is wiped out by about $8k of value loss. Plan a longer hold.
- Hennepin County population projected at +30% by 2050 — long-run rental-demand tailwind backs the buy-and-hold thesis.
Negotiation context
- It's been on market 62 days — a 6% lower offer ($258k) is reasonable based on typical stale-listing flexibility.
- 4 sale attempts since 29y ago with the ask held roughly flat each time — persistent listings suggest the price (not the market) is what's stuck; bring a comps-based counter.
- Current owner paid $215k; 28% above their basis — modest negotiation headroom, anchor on the comps not their cost.
Risks & watch-outs
- Watch-outs: built in 1955 — expect roof / HVAC / electrical / plumbing capex.
- Climate carrying-cost: major flood risk — expect insurance premiums to compound above CPI over the hold.
Questions for the listing agent
- It's been on market 62 days. Have you received any prior offers? Is the seller open to a 6% concession, seller financing, or rate buy-down credit?
- Built in 1955 — when were the roof, HVAC, electrical panel, plumbing, and water heater last replaced?
- Why hasn't it sold? Are there any deal-killer items the seller is aware of (foundation, flood, title, zoning, code violations)?
- Is there a deadline driving the sale (1031 exchange, divorce, estate, relocation)? That informs how much negotiation room exists.
- Schools are D-rated, which usually means shorter tenancies and higher turnover. Who's the typical renter profile here, and what's been the actual vacancy rate?
- Crime grade is F in this area — have there been break-ins, vandalism, or insurance claims at this property in the last 3 years? What carrier currently insures it and at what premium?
- What's the average days-on-market for RENTAL listings here right now (not sales)? A rising rental-DOM trend means longer vacancies and softer asking-rent achievability than the comps imply.
- What's the recent tenant-quality profile in this submarket — average credit score on applications, eviction rate, late-payment / NSF rate, and stable-employment percentage? A property-management company in the area should have these aggregated.
- How much new for-sale + rental construction is in the pipeline within 1–3 miles? Heavy new supply typically softens prices + rents 12–24 months out; constrained supply supports both.
Investment metrics
- 1% rule
- 1.09% ✓
- Cap rate
- 8.47%
- Cash-on-cash
- 7.77%
- DSCR
- 1.35
- GRM
- 7.6
CMA / ARV
No comps found within radius.
Projected returns pro-forma
-3.0% appreciation · 3.0% rent growth · sell at horizon
- IRR
- -4.4%
- Equity multiple
- 0.83×
- Total profit
- $-12,761
- Equity at exit
- $41,003
- IRR
- 5.3%
- Equity multiple
- 1.39×
- Total profit
- $29,913
- Equity at exit
- $23,777
Cash invested: $77,000 (down + closing). Projections, not guarantees.
Landlord ↔ Tenant lean methodology
- Overall (STATE)
- 46 Balanced
- State Minnesota
- 46 Balanced · D+2
- County
- — inherits STATE
- City
- — inherits STATE
ZIP-level market 55429
- Active inventory
- 87
- Price-to-rent
- 7.6×
Monthly cashflow live
- Estimated rent
- $3,000 medium interval (Pro) →
- Mortgage (P&I)
- −$1,442
- Tax from tax record
- −$314 /mo · $3,773/yr
- Insurance
- −$115
- HOA
- −$0
- Vacancy / Maint / Mgmt
- −$630
- Net cashflow
- $499
Break-even live
UW: 25.0% down · 7.5% · 30yr · 1.5% tax · 5.0% vac · 8.0% maint · 8.0% mgmt
Financing live
Cash to close
- Down payment
- $68,750
- Closing costs
- $8,250
- Reserves months
- —
- Total cash needed
- —
Loan-product check · same deal, 3 products live
Conventional
25% down · 7.5% · 30yr
- Down + closing
- —
- Monthly P&I
- —
- Monthly cashflow
- —
- DSCR
- —
- Eligible?
- —
Personal DTI + credit; lowest rate.
DSCR
20% down · 8.5% · 30yr
- Down + closing
- —
- Monthly P&I
- —
- Monthly cashflow
- —
- DSCR
- —
- Eligible?
- —
No personal income docs; deal must DSCR.
Hard money
10% down · 12.0% · 12mo
- Down + closing
- —
- Monthly P&I
- —
- Monthly cashflow
- —
- DSCR
- —
- Eligible?
- —
Short-term bridge; refi at stabilization.
Rent comps 1 comps
| Address | Beds | Baths | Sqft | Rent | $/sqft | DOM | Units | Dist |
|---|---|---|---|---|---|---|---|---|
| 3119 67th Ave N Minneapolis, MN | 4.0 | 2.0 | 2056 | $3,000 | $1.46 | 43d | 1 | 0.92mi |
Listing history 27 events
-
2026-06-18days on market $275,000 Active 62 DOM
-
2026-06-17days on market $275,000 Active 61 DOM
-
2026-06-16days on market $275,000 Active 60 DOM
-
2026-06-15days on market $275,000 Active 59 DOM
-
2026-06-13days on market $275,000 Active 57 DOM
-
2026-06-13days on market $275,000 Active 56 DOM
-
2026-06-09days on market $275,000 Active 53 DOM
-
2026-06-08days on market $275,000 Active 52 DOM
-
2026-06-07days on market $275,000 Active 51 DOM
-
2026-06-04days on market $275,000 Active 48 DOM
-
2026-06-03days on market $275,000 Active 47 DOM
-
2026-06-02days on market $275,000 Active 46 DOM
-
2026-06-02days on market $275,000 Active 45 DOM
-
2026-05-31days on market $275,000 Active 44 DOM
-
2026-03-14status Pending
-
2026-01-31$275,000 Active
-
2007-10-10soldstatus $214,900
-
2007-10-03soldstatus $214,900 253-char remark
Show marketing remark (253 chars)
Beautiful 4br on same level 2ba large turn key walkout rambler on nice treed lot. Great finished wood floors on main level, newer carpet LL. Many updates. New roof 2005, newer windows, central air, furnace and freshly painted. Close to shopping and 694.
-
2007-08-23historical 253-char remark
Show marketing remark (253 chars)
Beautiful 4br on same level 2ba large turn key walkout rambler on nice treed lot. Great finished wood floors on main level, newer carpet LL. Many updates. New roof 2005, newer windows, central air, furnace and freshly painted. Close to shopping and 694.
-
2007-05-08$204,900 253-char remark
Show marketing remark (253 chars)
Beautiful 4br on same level 2ba large turn key walkout rambler on nice treed lot. Great finished wood floors on main level, newer carpet LL. Many updates. New roof 2005, newer windows, central air, furnace and freshly painted. Close to shopping and 694.
-
1997-12-18soldstatus $97,850
-
1997-10-30soldstatus $97,000
-
1997-10-01historical
-
1997-09-26$97,850
-
1997-09-24historical
-
1997-07-14$97,900
-
1990-05-25soldstatus $80,500
ⓘ Source: listings_history table (triggers on properties + properties_extension) + one-shot
backfill from property_details.listing_events for pre-trigger history.
Tax reassessment forecast MN · Partial reset (capped growth)
- Current annual tax
- $3,773 · $314/mo
- Projected year-2 tax
- $3,773 · $314/mo
- Expected delta
- $0/yr ($0/mo · 0.0%)
ⓘ Screening estimate from a state-policy table — verify with the county assessor before closing.
Climate risk First Street
- Flood 6/10 Major FEMA zone X (unshaded) · 72% chance over 30 yrs
- Wildfire 1/10 Low
- Heat 2/10 Low 7 d/yr ≥99°F today · 14 d/yr by 30 yrs out
- Wind 2/10 Low
- Air quality 2/10 Low 2 unhealthy d/yr today · 2 by 30 yrs out
Nearby sold comps map
Loading sold comps map…
Walkable amenities ~0.75 mi
Loading nearby amenities…
Taxation est. · year 1
- Rental income
- $36,000
- − Mortgage interest
- −$15,404
- − Property taxes
- −$3,773
- − Insurance
- −$1,375
- − Repairs & maintenance
- −$2,880
- − Management
- −$2,880
- − Depreciation
- −$8,000
- Taxable income
- $1,688
- Est. tax owed @ 24.0%
- −$405
- After-tax cash flow
- $5,581/yr
For passive investors: Depreciation is non-cash, so a rental often shows a tax loss while cash-flowing — sheltering income. Rental losses are passive: they offset passive income freely, and up to $25,000/yr can offset ordinary (W-2) income if you actively participate and your MAGI is under $100k (phasing out to $0 by $150k); unused losses carry forward. On sale, claimed depreciation is recaptured at up to 25%, and gains may owe capital-gains tax (a 1031 exchange can defer both). Figures are a year-1 estimate at your 24.0% rate — not tax advice; consult a CPA.
Schools (NCES district)
- District
- Robbinsdale Public School District
- NCES district ID
- 2731780
- Math proficiency
- 24% ▼ -11.00%
- Reading proficiency
- 44% ▼ -5.00%
- Median HH income
- $60,234
- Composite
- 30.42/100
- National rank
- #6240
- State rank
- #250 of 301 in MN
Livability — Brooklyn Center
- Score
- 73/100
- State rank
- #253
- US rank
- #5422
Category grades
Schools grade is shown separately in the Schools card above.
Census & demographics
- Census place
- Brooklyn Center, MN
- City population
- 22,749
- Population (ZIP)
- 27,570
Population outlook (Hennepin County) Hauer SSP2
- Today (2025)
- 1,405,227 people
- By 2030
- 1,492,650 · +6.2%
- By 2040
- 1,660,157 · +18.1%
- By 2050
- 1,823,498 · +29.8%
- By 2075
- 2,221,283 · +58.1%
- By 2100
- 2,509,976 · +78.6%
Race, ethnicity, and origin ACS 2023
- Neighborhood character
- Highly diverse neighborhood (Simpson 0.73)
- Race & ethnicity
- Black 34% White 34% Asian 15% Hispanic / Latino 11% Two or more races 8% Native American 1%
- Hispanic origin (detail)
- Mexican 7%
- Common ancestry
- Swiss 9% Portuguese 5% Romanian 2%
- Foreign-born
- 24% · Canada, Vietnam
- Languages at home
- 70% English-only · Spanish 10% Other Asian/Pacific 9% French/Haitian/Cajun 1%
Political lean MEDSL · Hennepin
- 2024 margin
- Solid D (+42.6) · D 70.2% · R 27.5% · Other 2.3%
- 2008→2024 swing
- +14.0pp toward D · 2008: 28.6pp · 2024: 42.6pp
- All cycles
- 2024: D+42.6 2020: D+43.2 2016: D+35.3 2012: D+27.1 2008: D+28.6
Not yet ingested
- Civics
- —
Market trends
- HPI YoY
- ▼ -228.09%
- Current HPI
- 266.119
- Rent YoY
- —
- Metro
- —
- State GDP YoY
- ▲ 2.41%
- F500 in state
- 34
Industry mix (Fortune 500 HQ in MN)
| Industry | F500 HQs | Revenue |
|---|---|---|
| Healthcare | 2 | $407B |
|
||
| Retail | 2 | $150B |
|
||
| Consumer Goods | 2 | $32B |
|
||
| Industrial Machinery | 2 | $6B |
|
||
| Agriculture | 1 | $40B |
|
||
| Healthcare / Medical Devices | 1 | $32B |
|
||
Price history
+241.6% since first listed13 events — show timeline
- 2026-03-14 Pending — NORTHSTARMLS as Distributed by MLS Grid
- 2026-01-31 Listed $275,000 NORTHSTARMLS as Distributed by MLS Grid
- 2007-10-10 Sold (Public Records) $214,900 Public Records
- 2007-10-03 Sold (MLS) $214,900 NORTHSTARMLS as Distributed by MLS Grid
- 2007-08-23 Listing Removed — NORTHSTARMLS as Distributed by MLS Grid
- 2007-05-08 Listed $204,900 NORTHSTARMLS as Distributed by MLS Grid
- 1997-12-18 Sold (Public Records) $97,850 Public Records
- 1997-10-30 Sold (MLS) $97,000 NORTHSTARMLS as Distributed by MLS Grid
- 1997-10-01 Listing Removed — NORTHSTARMLS as Distributed by MLS Grid
- 1997-09-26 Listed $97,850 NORTHSTARMLS as Distributed by MLS Grid
- 1997-09-24 Listing Removed — NORTHSTARMLS as Distributed by MLS Grid
- 1997-07-14 Listed $97,900 NORTHSTARMLS as Distributed by MLS Grid
- 1990-05-25 Sold (Public Records) $80,500 Public Records
Property tax history
+2.8%/yrLatest (2025): $3,773 · +18.3% YoY. Source: county tax records.
Cash-flow waterfall
monthlySold comps — $/sqft
last 12 mo · ≤1 miLoading sold comps…