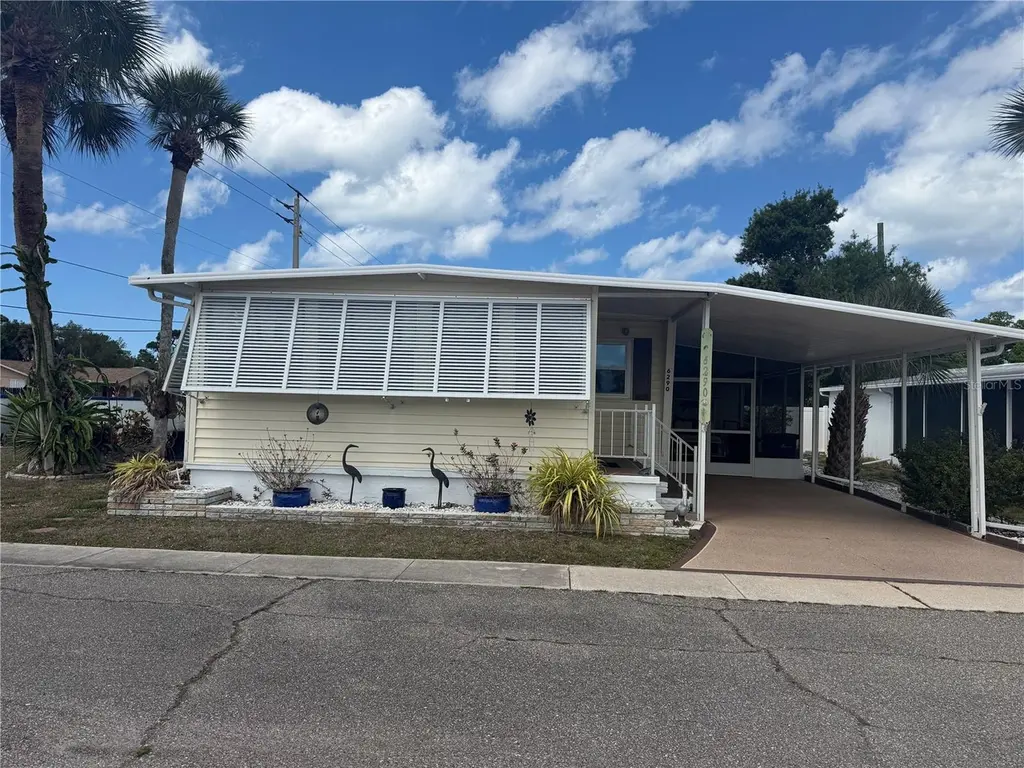
6290 Daffodil Rd · South Venice, FL
Flood risk 7/10 · Major
- FEMA flood zone
- AE
- Chance of flooding over 30 yrs
- 0.74%
- Est. flood insurance / yr
- $1,737 – $8,500
Fire risk 2/10 · Minimal
- Est. fire insurance / yr
- $947 – $1,759
Heat risk 10/10 · Severe
- Hot days now (above 107°F)
- 7 days/yr
- Hot days in 30 yrs
- 28 days/yr
Wind risk 10/10 · Severe
- Chance of severe wind over 30 yrs
- 99.0%
Air-quality risk 3/10 · Minor
- Unhealthy air days now
- 2 days/yr
- Unhealthy air days in 30 yrs
- 2 days/yr
Risk factors via First Street. Map © Google.
Why this score? — see what drove the B- grade
The composite is a weighted blend of 9 inputs, each scored 0–100. Each bar is that input's sub-score; the figure is the points it added to the 100-point composite (weight × sub-score).
- Cash flow +28.7/30.0
- DSCR +10.0/10.0
- 1% rule +8.9/10.0
- ARV discount +7.5/15.0
- Schools +5.4/10.0
- Livability +3.4/5.0
- Rent growth +2.7/5.0
- Condition / age +2.5/5.0
- Appreciation +0.0/10.0
$160,000
🖨 Deal sheet 📄 Offer letter ✓ Due diligence
Listing remarks
Two bedroom, two bathroom home in Japanese Gardens, an active 55+ community. Resident owned, no lot rent! The home is located in the dog friendly section of the community. This home is fully furnished and move in ready! The open floor plan is perfect for entertaining. Both bedrooms are a great size. The primary bedroom features an ensuite bathroom. The screened lanai is the perfect place to enjoy the beautiful Florida weather!
Key facts
- 3,317 sq ft lot
- Parking
- Community pool
Property features AI
Finance
- Other: Property type: Residential mobile home; Property subtype: Mobile Home (double wide); Zoning: RMH; Lot acreage: less than 1/4 acre
- Financial info: Total monthly fees $254; total annual fees $3,048; Lease restrictions apply
- HOA & community: Has HOA — monthly fee of $254; Association requires approval; Association fee includes cable TV, pool, management, private road, recreational facilities, sewer and water; Association amenities: pool, spa/hot tub, pickleball courts, shuffleboard court(s), cable TV; vehicle restrictions apply; Community features: clubhouse, community mailbox, sidewalks, street lights, buyer approval required, senior community; Pets allowed: cats and dogs
Exterior
- Parking: Carport (1 space)
- Utilities: Public water; Private sewer; Electricity connected; Water connected; Sewer connected; Cable connected; Underground utilities
- Home design: Residential mobile home (double wide); Single-story; East-facing; Crawlspace foundation
- Construction: Metal siding; Roof over
- Exterior features: Rain gutters; Shade shutters; Sidewalk; Paved lot; Asphalt road frontage; Shed on property; In-ground heated pool with lighting; Heated in-ground spa
Interior
- Kitchen: Cooktop; Range; Microwave; Dishwasher; Refrigerator
- Bedrooms: 2 bedrooms
- Flooring: Carpet; Laminate
- Bathrooms: 2 full bathrooms
- Heating & cooling: Central heating (electric); Central air conditioning
- Interior features: Ceiling fans; Thermostat; Window treatments
- Laundry & utility: Washer hookup; Electric dryer hookup; Other laundry hookups
Neighborhood map
What this means for you Summary
Snapshot
- This is a 2-bed/2.0-bath manufactured listed at $160k.
Deal economics
- At list price, monthly cash flow is $108 ($1k/yr) — positive.
- The deal already cash-flows at list — no discount required.
- Meets the 1% rule at list price ($2k rent vs $160k).
- Recommended offer: $155k (3.0% below list) — sets the bar for market timing.
Location & tenants
- Location reads 67/100 on livability (#549 in FL) — a middle-class / working-renter tenant base. Strengths: housing A+, crime A-, cost of living A-; Watch: schools F, amenities F, commute F.
- Sarasota (urban): math 63% / reading 63% proficiency, ranked #7 of 73 in FL (top 10%) — acceptable for families but not a draw, mixed tenant base, ~2y average lease.
- Market conditions: Rents flat; 1247 active listings in the ZIP; solid renter incomes; 7,466 units permitted in Sarasota County in 2024 (2,138 in 5+ unit buildings).
Forward outlook
- Local home prices are declining (-3.0%/yr); year-one equity from $1k of loan paydown is wiped out by about $5k of value loss. Plan a longer hold.
- Sarasota County population projected at +20% by 2050 — long-run rental-demand tailwind backs the buy-and-hold thesis.
Negotiation context
- It's been on market 41 days — a 3% lower offer ($155k) is reasonable based on typical stale-listing flexibility.
- Current owner paid $75k; list at $160k implies a 113% gain — meaningful room to come down on a strong offer.
Risks & watch-outs
- Watch-outs: flood insurance adds $427/mo.
- Climate carrying-cost: in FEMA flood zone AE (mandatory federal flood insurance); severe wind risk, 99% chance of damaging wind over 30y; extreme-heat days projected 7→28/yr by 2055 (HVAC capex compounding) — expect insurance premiums to compound above CPI over the hold.
Questions for the listing agent
- It's been on market 41 days. Have you received any prior offers? Is the seller open to a 3% concession, seller financing, or rate buy-down credit?
- Built in 1970 — when were the roof, HVAC, electrical panel, plumbing, and water heater last replaced?
- What's the actual annual flood-insurance premium (NFIP or private), and is the property in a SFHA with mandatory coverage?
- What does the HOA fee cover, when was the last increase, and are there any pending special assessments or reserve-fund shortfalls?
- Is there a deadline driving the sale (1031 exchange, divorce, estate, relocation)? That informs how much negotiation room exists.
- Schools are F-rated, which usually means shorter tenancies and higher turnover. Who's the typical renter profile here, and what's been the actual vacancy rate?
- What's the average days-on-market for RENTAL listings here right now (not sales)? A rising rental-DOM trend means longer vacancies and softer asking-rent achievability than the comps imply.
- What's the recent tenant-quality profile in this submarket — average credit score on applications, eviction rate, late-payment / NSF rate, and stable-employment percentage? A property-management company in the area should have these aggregated.
- How much new for-sale + rental construction is in the pipeline within 1–3 miles? Heavy new supply typically softens prices + rents 12–24 months out; constrained supply supports both.
Investment metrics
- 1% rule
- 1.39% ✓
- Cap rate
- 10.30%
- Cash-on-cash
- 14.32%
- DSCR
- 1.64
- GRM
- 6.0
CMA / ARV
No comps found within radius.
Projected returns pro-forma
-3.0% appreciation · 0.7% rent growth · sell at horizon
- IRR
- -15.3%
- Equity multiple
- 0.47×
- Total profit
- $-23,719
- Equity at exit
- $23,857
- IRR
- -13.5%
- Equity multiple
- 0.33×
- Total profit
- $-30,037
- Equity at exit
- $13,834
Cash invested: $44,800 (down + closing). Projections, not guarantees.
Landlord ↔ Tenant lean methodology
- Overall (STATE)
- 87 Strongly Landlord-Friendly
- State Florida
- 87 Strongly Landlord-Friendly · R+3
- County
- — inherits STATE
- City
- — inherits STATE
ZIP-level market 34293
- Rents YoY
- 0.7%
- Active inventory
- 1247
- Price-to-rent
- 6.0×
Monthly cashflow live
- Estimated rent
- $2,226 medium interval (Pro) →
- Mortgage (P&I)
- −$839
- Tax from tax record
- −$64 /mo · $770/yr
- Insurance
- −$67
- Flood insurance flood zone
- −$427 /mo · $5,118/yr
- HOA
- −$254
- Vacancy / Maint / Mgmt
- −$467
- Net cashflow
- $108
Break-even live
UW: 25.0% down · 7.5% · 30yr · 1.5% tax · 5.0% vac · 8.0% maint · 8.0% mgmt
Financing live
Cash to close
- Down payment
- $40,000
- Closing costs
- $4,800
- Reserves months
- —
- Total cash needed
- —
Loan-product check · same deal, 3 products live
Conventional
25% down · 7.5% · 30yr
- Down + closing
- —
- Monthly P&I
- —
- Monthly cashflow
- —
- DSCR
- —
- Eligible?
- —
Personal DTI + credit; lowest rate.
DSCR
20% down · 8.5% · 30yr
- Down + closing
- —
- Monthly P&I
- —
- Monthly cashflow
- —
- DSCR
- —
- Eligible?
- —
No personal income docs; deal must DSCR.
Hard money
10% down · 12.0% · 12mo
- Down + closing
- —
- Monthly P&I
- —
- Monthly cashflow
- —
- DSCR
- —
- Eligible?
- —
Short-term bridge; refi at stabilization.
HOA detail
- Monthly dues
- $254 · $3,048/yr
Listing history 15 events
-
2026-06-18days on market $160,000 Active 41 DOM
-
2026-06-17days on market $160,000 Active 40 DOM
-
2026-06-16days on market $160,000 Active 39 DOM
-
2026-06-15days on market $160,000 Active 38 DOM
-
2026-06-13days on market $160,000 Active 36 DOM
-
2026-06-13days on market $160,000 Active 35 DOM
-
2026-06-10days on market $160,000 Active 33 DOM
-
2026-06-09days on market $160,000 Active 32 DOM
-
2026-06-08days on market $160,000 Active 31 DOM
-
2026-06-08days on market $160,000 Active 30 DOM
-
2026-06-05status $160,000 Active 27 DOM
-
2026-04-29status Pending
-
2026-04-02$160,000 Active
-
2014-02-28soldstatus $75,000
-
1984-07-01soldstatus $37,500
ⓘ Source: listings_history table (triggers on properties + properties_extension) + one-shot
backfill from property_details.listing_events for pre-trigger history.
Tax reassessment forecast FL · Resets to sale price
- Current annual tax
- $770 · $64/mo
- Projected year-2 tax
- $1,328 · $111/mo
- Expected delta
- +$558/yr (+$47/mo · 72.5%)
ⓘ Screening estimate from a state-policy table — verify with the county assessor before closing.
Climate risk First Street
- Flood 7/10 Severe FEMA zone AE · 74% chance over 30 yrs
- Wildfire 2/10 Low
- Heat 10/10 Extreme 7 d/yr ≥107°F today · 28 d/yr by 30 yrs out
- Wind 10/10 Extreme 99% chance of damaging wind over 30 yrs
- Air quality 3/10 Moderate 2 unhealthy d/yr today · 2 by 30 yrs out
Nearby sold comps map
Loading sold comps map…
Walkable amenities ~0.75 mi
Loading nearby amenities…
Taxation est. · year 1
- Rental income
- $26,709
- − Mortgage interest
- −$8,962
- − Property taxes
- −$770
- − Insurance
- −$5,918
- − Repairs & maintenance
- −$2,137
- − Management
- −$2,137
- − HOA
- −$3,048
- − Depreciation
- −$4,655
- Taxable loss
- −$918
- Est. tax savings @ 24.0%
- +$220
- After-tax cash flow
- $1,515/yr
For passive investors: Depreciation is non-cash, so a rental often shows a tax loss while cash-flowing — sheltering income. Rental losses are passive: they offset passive income freely, and up to $25,000/yr can offset ordinary (W-2) income if you actively participate and your MAGI is under $100k (phasing out to $0 by $150k); unused losses carry forward. On sale, claimed depreciation is recaptured at up to 25%, and gains may owe capital-gains tax (a 1031 exchange can defer both). Figures are a year-1 estimate at your 24.0% rate — not tax advice; consult a CPA.
Schools (NCES district)
- District
- Sarasota
- NCES district ID
- 1201680
- Math proficiency
- 63% ▼ -8.00%
- Reading proficiency
- 63% ▼ -3.00%
- Median HH income
- $51,167
- Composite
- 53.68/100
- National rank
- #1428
- State rank
- #7 of 73 in FL
Livability — South Venice
- Score
- 67/100
- State rank
- #549
- US rank
- #10377
Category grades
Schools grade is shown separately in the Schools card above.
Census & demographics
- Census place
- South Venice, FL
- County
- Sarasota County · 448,376 people
- Metro
- North Port-Sarasota-Bradenton, FL
- Population (ZIP)
- 50,278
- Household income
- $90,038
- Rent vs Own
- Severe rent burden
- 548.0
Population outlook (Sarasota County) Hauer SSP2
- Today (2025)
- 452,380 people
- By 2030
- 474,175 · +4.8%
- By 2040
- 511,577 · +13.1%
- By 2050
- 541,467 · +19.7%
- By 2075
- 604,947 · +33.7%
- By 2100
- 621,965 · +37.5%
Race, ethnicity, and origin ACS 2023
- Neighborhood character
- Predominantly White (90%)
- Race & ethnicity
- White 90% Hispanic / Latino 5% Two or more races 4% Asian 2%
- Hispanic origin (detail)
- Mexican 1% Puerto Rican 2%
- Common ancestry
- Romanian 7% Lithuanian 4% Slovak 3%
- Foreign-born
- 9% · Canada, China, Dominican Republic
- Languages at home
- 90% English-only · Spanish 3% Russian/Polish/Slavic 2% French/Haitian/Cajun 1%
Political lean MEDSL · Sarasota
- 2024 margin
- R (+18.2) · D 40.5% · R 58.7%
- 2008→2024 swing
- -18.1pp toward R · 2008: -0.1pp · 2024: -18.2pp
- All cycles
- 2024: R+18.2 2020: R+10.4 2016: R+11.6 2012: R+7.4 2008: R+0.1
Not yet ingested
- Civics
- —
Market trends
- HPI YoY
- ▼ -355.64%
- Current HPI
- 270.5242
- Rent YoY
- ▲ 0.70%
- Metro
- North Port-Sarasota-Bradenton, FL
- State GDP YoY
- ▲ 3.28%
- F500 in state
- 36
Industry mix (Fortune 500 HQ in FL)
| Industry | F500 HQs | Revenue |
|---|---|---|
| Industrial Technology | 2 | $29B |
|
||
| Insurance | 2 | $17B |
|
||
| Retail | 1 | $60B |
|
||
| Technology Distribution | 1 | $58B |
|
||
| Homebuilding | 1 | $35B |
|
||
| Technology Manufacturing | 1 | $35B |
|
||
Price history
+326.7% since first listed4 events — show timeline
- 2026-04-29 Pending — Stellar MLS as Distributed by MLS Grid
- 2026-04-02 Listed $160,000 Stellar MLS as Distributed by MLS Grid
- 2014-02-28 Sold (Public Records) $75,000 Public Records
- 1984-07-01 Sold (Public Records) $37,500 Public Records
Property tax history
+2.2%/yrLatest (2025): $770 · -11.1% YoY. Source: county tax records.
Cash-flow waterfall
monthlySold comps — $/sqft
last 12 mo · ≤1 miLoading sold comps…