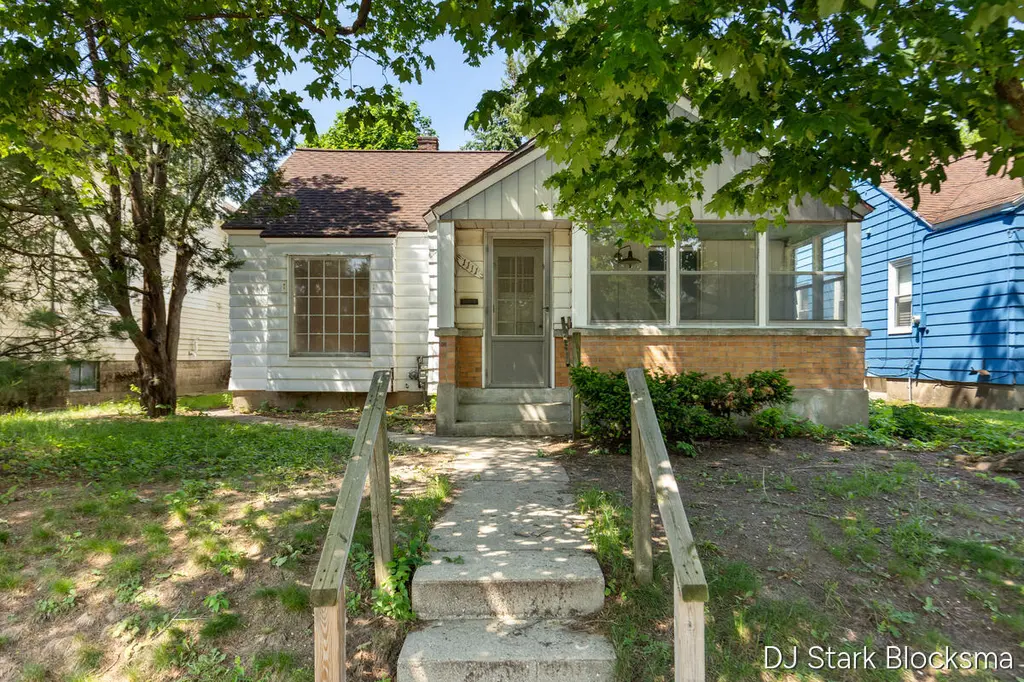
1111 Merritt St SE · Grand Rapids, MI
Flood risk 1/10 · Minimal
- FEMA flood zone
- X (unshaded)
- Chance of flooding over 30 yrs
- 0.0%
- Est. flood insurance / yr
- $473 – $860
Fire risk 1/10 · Minimal
- Est. fire insurance / yr
- $784 – $1,456
Heat risk 2/10 · Minimal
- Hot days now (above 96°F)
- 7 days/yr
- Hot days in 30 yrs
- 16 days/yr
Wind risk 2/10 · Minimal
- Chance of severe wind over 30 yrs
- —
Air-quality risk 2/10 · Minimal
- Unhealthy air days now
- 2 days/yr
- Unhealthy air days in 30 yrs
- 2 days/yr
Risk factors via First Street. Map © Google.
Why this score? — see what drove the C- grade
The composite is a weighted blend of 9 inputs, each scored 0–100. Each bar is that input's sub-score; the figure is the points it added to the 100-point composite (weight × sub-score).
- Cash flow +20.2/30.0
- ARV discount +7.5/15.0
- DSCR +6.4/10.0
- 1% rule +4.6/10.0
- Livability +4.2/5.0
- Rent growth +3.7/5.0
- Condition / age +2.5/5.0
- Schools +1.9/10.0
- Appreciation +0.0/10.0
$165,000
🖨 Deal sheet (PDF) 📄 Offer letter ✓ Due diligence
Listing remarks MLS
OWN FOR LESS THAN RENT IN ALGER HEIGHTS! Stop renting and start building equity! If you've been searching for an affordable entry into the housing market, this is your golden opportunity. Kitchen and bathroom layouts already upgraded, just bring your own flooring ideas to finish them off! 3-season front porch. Original hardwood floors just waiting to be sanded and shined back to life. You won't have to worry about the big-ticket items. This home features a newer roof (5-10 years old), newer water heater (2022), Goodman furnace and new sump pump (2025). Basement professionally waterproofed. 2 bed with potential for a 3rd bedroom on upper level. Minutes away from parks, breweries, shopping, and dining. Finding a livable home with this much upside in Alger Heights under $200k is nearly impossible in today's market. Vacant and ready for its next owner!
Key facts
- Goodman furnace
- Newer roof
- 3 season front porch
Tags
Property features AI
Exterior
- Parking: Detached garage (1 car)
- Utilities: Public water
- Home design: Single-family residence; Residential property; Other architectural style; Built in 1946
- Construction: Aluminum siding; Composition roof; Living area approximately 977
- Exterior features: Paved road access; Public water
Interior
- Kitchen: Range; Refrigerator
- Bathrooms: 1 full bathroom
- Heating & cooling: Forced air heating
- Interior features: Garage door opener; 6 total rooms; Full basement
Neighborhood map
What this means for you Summary
Snapshot
- This is a 2-bed/1.0-bath single-family listed at $165k.
Deal economics
- At list price, monthly cash flow is $209 ($3k/yr) — positive.
- The deal already cash-flows at list — no discount required.
- To meet the 1% rule (rent ≥ 1% of price), the offer needs to be $158k (4.5% below list).
- Recommended offer: $158k (4.5% below list) — sets the bar for 1% rule.
- Cap rate 7.8% vs local median 4.5% in Grand Rapids — top-decile yield for the area; either an underpriced asset or a hidden risk that comps aren't pricing in. Stress-test before assuming the spread holds.
Location & tenants
- Location reads 83/100 on livability (#44 in MI, #939 nationally) — a professional / high-income tenant draw. Strengths: amenities A+, commute A+, cost of living A+; Watch: employment C-, crime F.
- Grand Rapids Public Schools (urban): math 15% / reading 29% proficiency, ranked #451 of 540 in MI (top 84%) — low school quality limits family demand, transient renter base, plan for 1-2y turnover; 80% free/reduced lunch — lower-income household profile, screen leases tightly.
- Zoned schools: Brookside Elementary (math 2% / reading 8%, grade F, #1,325 of 1,397 statewide, top 99%, 280 students, 85% FRL); Alger Middle School (math 2% / reading 12%, grade F, #481 of 493 statewide, top 98%, 342 students, 95% FRL); City Middlehigh (math 65% / reading 88%, grade A-, #16 of 713 statewide, top 2%, 908 students, 40% FRL).
- Market conditions: Rents rising fast (+4.7%/yr); 178 active listings in the ZIP; 17 comparable units currently listed for rent nearby; rentals lingering (median 46d on market — plan ~5-8 weeks vacancy on turnover, expect pricing pressure); 65% of comp listings sitting > 30 days — soft ceiling on asking rent; 2,253 units permitted in Kent County in 2024 (969 in 5+ unit buildings).
- This rent runs 31% of the median local income ($61k/yr) — at the standard rent-burdened threshold; future hikes will face affordability resistance.
Forward outlook
- Local home prices are declining (-3.0%/yr); year-one equity from $1k of loan paydown is wiped out by about $5k of value loss. Plan a longer hold.
- Kent County population projected at +22% by 2050 — long-run rental-demand tailwind backs the buy-and-hold thesis.
Negotiation context
- Only 2 days on market — expect competitive offers; lowballing is unlikely to land.
- 3 sale attempts with the ask held roughly flat each time — persistent listings suggest the price (not the market) is what's stuck; bring a comps-based counter.
Risks & watch-outs
- Watch-outs: built in 1946 — expect roof / HVAC / electrical / plumbing capex.
Questions for the listing agent
- Built in 1946 — when were the roof, HVAC, electrical panel, plumbing, and water heater last replaced?
- Is there a deadline driving the sale (1031 exchange, divorce, estate, relocation)? That informs how much negotiation room exists.
- Crime grade is F in this area — have there been break-ins, vandalism, or insurance claims at this property in the last 3 years? What carrier currently insures it and at what premium?
- What's the average days-on-market for RENTAL listings here right now (not sales)? A rising rental-DOM trend means longer vacancies and softer asking-rent achievability than the comps imply.
- What's the recent tenant-quality profile in this submarket — average credit score on applications, eviction rate, late-payment / NSF rate, and stable-employment percentage? A property-management company in the area should have these aggregated.
- How much new for-sale + rental construction is in the pipeline within 1–3 miles? Heavy new supply typically softens prices + rents 12–24 months out; constrained supply supports both.
Investment metrics
- 1% rule
- 0.96% ✗
- Cap rate
- 7.81%
- Cash-on-cash
- 5.43%
- DSCR
- 1.24
- GRM
- 8.7
CMA / ARV
No comps found within radius.
Projected returns pro-forma
-3.0% appreciation · 4.74% rent growth · sell at horizon
- IRR
- -6.1%
- Equity multiple
- 0.77×
- Total profit
- $-10,661
- Equity at exit
- $24,602
- IRR
- 5.4%
- Equity multiple
- 1.42×
- Total profit
- $19,628
- Equity at exit
- $14,266
Cash invested: $46,200 (down + closing). Projections, not guarantees.
Landlord ↔ Tenant lean methodology
- Overall (STATE)
- 62 Landlord-Friendly
- State Michigan
- 62 Landlord-Friendly · EVEN
- County
- — inherits STATE
- City
- — inherits STATE
ZIP-level market 49507
- Rents YoY
- 4.7%
- Active inventory
- 178
- Price-to-rent
- 8.7×
Monthly cashflow live
- Estimated rent
- $1,576 high interval (Pro) →
- Mortgage (P&I)
- −$865
- Tax from tax record
- −$102 /mo · $1,228/yr
- Insurance
- −$69
- HOA
- −$0
- Vacancy / Maint / Mgmt
- −$331
- Net cashflow
- $209
Break-even live
Sensitivity live
| Price | -10% $302 | -5% $256 | +0% $209 | +5% $162 | +10% $116 |
|---|---|---|---|---|---|
| Rent | -10% $84 | -5% $147 | +0% $209 | +5% $271 | +10% $333 |
| Rate | -1.0pp $292 | -0.5pp $251 | base $209 | +0.5pp $166 | +1.0pp $123 |
UW: 25.0% down · 7.5% · 30yr · 1.5% tax · 5.0% vac · 8.0% maint · 8.0% mgmt
Financing live
Cash to close
- Down payment
- $41,250
- Closing costs
- $4,950
- Reserves months
- —
- Total cash needed
- —
Loan-product check · same deal, 3 products live
Conventional
25% down · 7.5% · 30yr
- Down + closing
- —
- Monthly P&I
- —
- Monthly cashflow
- —
- DSCR
- —
- Eligible?
- —
Personal DTI + credit; lowest rate.
DSCR
20% down · 8.5% · 30yr
- Down + closing
- —
- Monthly P&I
- —
- Monthly cashflow
- —
- DSCR
- —
- Eligible?
- —
No personal income docs; deal must DSCR.
Hard money
10% down · 12.0% · 12mo
- Down + closing
- —
- Monthly P&I
- —
- Monthly cashflow
- —
- DSCR
- —
- Eligible?
- —
Short-term bridge; refi at stabilization.
Rent comps 17 comps
| Address | Beds | Baths | Sqft | Rent | $/sqft | DOM | Units | Dist |
|---|---|---|---|---|---|---|---|---|
| 950 Merritt St SE Grand Rapids, MI | 3.0 | 1.0 | 1000 | $2,100 | $2.10 | 45d | 1 | 0.13mi |
| 1057 Griggs St SE Grand Rapids, MI | 2.0 | 1.0 | 1100 | $1,550 | $1.41 | 45d | 1 | 0.28mi |
| 1220 Ottillia St SE Unit D Grand Rapids, MI | 2.0 | 1.0 | 750 | $1,150 | $1.53 | 45d | 1 | 0.36mi |
| 2017 Eastern Ave SE Grand Rapids, MI | 1.0 | 1.0 | 900 | $900 | $1.00 | 45d | 1 | 0.39mi |
| 1555 Margaret Ave SE Grand Rapids, MI | 2.0 | 1.0 | 900 | $1,500 | $1.67 | 16d | 1 | 0.69mi |
| 459 Dickinson St SE Grand Rapids, MI | 2.0 | 1.0 | 731 | $1,195 | $1.63 | 45d | 1 | 0.87mi |
| 1966 Burton St SE Unit IVA34 Grand Rapids, MI | 1.0 | 1.0 | 660 | $1,125 | $1.70 | 45d | 1 | 1.09mi |
| 1966 Burton St SE Unit IVA33 Grand Rapids, MI | 2.0 | 1.5 | 860 | $1,350 | $1.57 | 45d | 1 | 1.09mi |
| 1966 Burton St SE Unit IVA24 Grand Rapids, MI | 2.0 | 1.5 | 860 | $1,450 | $1.69 | 45d | 1 | 1.09mi |
| 1970 Burton St SE Unit IVA38 Grand Rapids, MI | 2.0 | 1.0 | 800 | $1,450 | $1.81 | 45d | 1 | 1.10mi |
| 1970 Burton St SE Unit IVA40 Grand Rapids, MI | 2.0 | 1.0 | 800 | $1,100 | $1.38 | 45d | 1 | 1.10mi |
| 1960 Burton St SE Grand Rapids, MI | 1.0–2.0 | 1.0–1.5 | 760 | $1,450 | $1.91 | 4d | 3 | 1.11mi |
| 2928 Vineland Ave SE Unit 2928 Grand Rapids, MI | 2.0 | 1.0 | 1000 | $1,450 | $1.45 | 25d | 1 | 1.22mi |
| 1309 Madison Ave SE Grand Rapids, MI | 1.0–2.0 | 1.0 | 775 | $1,560 | $2.01 | 4d | 1 | 1.24mi |
| 2040 Division Ave S Unit 207 Grand Rapids, MI | 2.0 | 1.0 | 768 | $1,703 | $2.22 | 4d | 1 | 1.28mi |
| 2040 Division Ave S Unit 205 Grand Rapids, MI | 1.0 | 1.0 | 719 | $1,490 | $2.07 | 4d | 1 | 1.28mi |
| 3202 Marshall Ave SE Grand Rapids, MI | 2.0 | 1.0 | 850 | $1,095 | $1.29 | 45d | 1 | 1.49mi |
Listing history 4 events
-
2026-05-31status $165,000 Pending 2 DOM
-
2026-05-28$165,000 Active
Show marketing remark (860 chars)
OWN FOR LESS THAN RENT IN ALGER HEIGHTS! Stop renting and start building equity! If you've been searching for an affordable entry into the housing market, this is your golden opportunity. Kitchen and bathroom layouts already upgraded, just bring your own flooring ideas to finish them off! 3-season front porch. Original hardwood floors just waiting to be sanded and shined back to life. You won't have to worry about the big-ticket items. This home features a newer roof (5-10 years old), newer water heater (2022), Goodman furnace and new sump pump (2025). Basement professionally waterproofed. 2 bed with potential for a 3rd bedroom on upper level. Minutes away from parks, breweries, shopping, and dining. Finding a livable home with this much upside in Alger Heights under $200k is nearly impossible in today's market. Vacant and ready for its next owner!
-
2026-05-28$165,000 Active 861-char remark
Show marketing remark (860 chars)
OWN FOR LESS THAN RENT IN ALGER HEIGHTS! Stop renting and start building equity! If you've been searching for an affordable entry into the housing market, this is your golden opportunity. Kitchen and bathroom layouts already upgraded, just bring your own flooring ideas to finish them off! 3-season front porch. Original hardwood floors just waiting to be sanded and shined back to life. You won't have to worry about the big-ticket items. This home features a newer roof (5-10 years old), newer water heater (2022), Goodman furnace and new sump pump (2025). Basement professionally waterproofed. 2 bed with potential for a 3rd bedroom on upper level. Minutes away from parks, breweries, shopping, and dining. Finding a livable home with this much upside in Alger Heights under $200k is nearly impossible in today's market. Vacant and ready for its next owner!
-
2026-05-28$165,000 Active 860-char remark
Show marketing remark (860 chars)
OWN FOR LESS THAN RENT IN ALGER HEIGHTS! Stop renting and start building equity! If you've been searching for an affordable entry into the housing market, this is your golden opportunity. Kitchen and bathroom layouts already upgraded, just bring your own flooring ideas to finish them off! 3-season front porch. Original hardwood floors just waiting to be sanded and shined back to life. You won't have to worry about the big-ticket items. This home features a newer roof (5-10 years old), newer water heater (2022), Goodman furnace and new sump pump (2025). Basement professionally waterproofed. 2 bed with potential for a 3rd bedroom on upper level. Minutes away from parks, breweries, shopping, and dining. Finding a livable home with this much upside in Alger Heights under $200k is nearly impossible in today's market. Vacant and ready for its next owner!
ⓘ Source: listings_history table (triggers on properties + properties_extension) + one-shot
backfill from property_details.listing_events for pre-trigger history.
Tax reassessment forecast MI · Partial reset (capped growth)
- Current annual tax
- $1,228 · $102/mo
- Projected year-2 tax
- $1,884 · $157/mo
- Expected delta
- +$657/yr (+$55/mo · 53.5%)
ⓘ Screening estimate from a state-policy table — verify with the county assessor before closing.
Climate risk First Street
- Flood 1/10 Low FEMA zone X (unshaded) · 0% chance over 30 yrs
- Wildfire 1/10 Low
- Heat 2/10 Low 7 d/yr ≥96°F today · 16 d/yr by 30 yrs out
- Wind 2/10 Low
- Air quality 2/10 Low 2 unhealthy d/yr today · 2 by 30 yrs out
Nearby sold comps map
Loading sold comps map…
Walkable amenities ~0.75 mi
Loading nearby amenities…
Taxation est. · year 1
- Rental income
- $18,916
- − Mortgage interest
- −$9,243
- − Property taxes
- −$1,228
- − Insurance
- −$825
- − Repairs & maintenance
- −$1,513
- − Management
- −$1,513
- − Depreciation
- −$4,800
- Taxable loss
- −$206
- Est. tax savings @ 24.0%
- +$49
- After-tax cash flow
- $2,557/yr
For passive investors: Depreciation is non-cash, so a rental often shows a tax loss while cash-flowing — sheltering income. Rental losses are passive: they offset passive income freely, and up to $25,000/yr can offset ordinary (W-2) income if you actively participate and your MAGI is under $100k (phasing out to $0 by $150k); unused losses carry forward. On sale, claimed depreciation is recaptured at up to 25%, and gains may owe capital-gains tax (a 1031 exchange can defer both). Figures are a year-1 estimate at your 24.0% rate — not tax advice; consult a CPA.
Schools (NCES district)
- District
- Grand Rapids Public Schools
- NCES district ID
- 2616440
- Math proficiency
- 15% ▼ -5.00%
- Reading proficiency
- 29% ▼ -1.00%
- Median HH income
- $40,612
- Composite
- 18.62/100
- National rank
- #8899
- State rank
- #451 of 540 in MI
Livability — Grand Rapids
- Score
- 83/100
- State rank
- #44
- US rank
- #939
Category grades
Schools grade is shown separately in the Schools card above.
Census & demographics
- Census place
- Grand Rapids, MI
- County
- Kent County · 533,805 people
- City population
- 181,325
- Metro
- Grand Rapids-Kentwood, MI
- Population (ZIP)
- 38,487
- Household income
- $61,461
- Rent vs Own
- Severe rent burden
- 1625.0
Population outlook (Kent County) Hauer SSP2
- Today (2025)
- 712,484 people
- By 2030
- 748,618 · +5.1%
- By 2040
- 814,777 · +14.4%
- By 2050
- 868,556 · +21.9%
- By 2075
- 966,487 · +35.7%
- By 2100
- 967,975 · +35.9%
Race, ethnicity, and origin ACS 2023
- Neighborhood character
- Highly diverse neighborhood (Simpson 0.71)
- Race & ethnicity
- Hispanic / Latino 31% Black 31% White 30% Two or more races 21%
- Hispanic origin (detail)
- Mexican 18% Puerto Rican 3% Dominican 1%
- Common ancestry
- Iranian 8% Romanian 2% Lithuanian 1%
- Foreign-born
- 18% · Canada
- Languages at home
- 71% English-only · Spanish 23% Arabic 1% Other Indo-European 1%
Political lean MEDSL · Kent
- 2024 margin
- Lean D (+5.4) · D 51.8% · R 46.5% · Other 1.7%
- 2008→2024 swing
- +4.8pp toward D · 2008: 0.5pp · 2024: 5.4pp
- All cycles
- 2024: D+5.4 2020: D+6.1 2016: R+3.1 2012: R+7.9 2008: D+0.5
Not yet ingested
- Civics
- —
Market trends
- HPI YoY
- ▼ -301.99%
- Current HPI
- 325.3878
- Rent YoY
- ▲ 4.74%
- Metro
- Grand Rapids-Kentwood, MI
- State GDP YoY
- ▲ 1.37%
- F500 in state
- 28
Industry mix (Fortune 500 HQ in MI)
| Industry | F500 HQs | Revenue |
|---|---|---|
| Automotive Parts | 3 | $48B |
|
||
| Automotive | 2 | $372B |
|
||
| Chemicals | 1 | $45B |
|
||
| Automotive Retail | 1 | $29B |
|
||
| Healthcare / Medical Devices | 1 | $23B |
|
||
| Automotive Technology | 1 | $20B |
|
||
Price history
+0.0% since first listed3 events — show timeline
- 2026-05-28 Listed $165,000 MiRealSource-MiMLS
- 2026-05-28 Listed $165,000 REALCOMP
- 2026-05-28 Listed $165,000 SW Michigan MLS
Property tax history
+1.5%/yrLatest (2025): $1,228 · +8.8% YoY. Source: county tax records.
Cash-flow waterfall
monthlySold comps — $/sqft
last 12 mo · ≤1 miLoading sold comps…