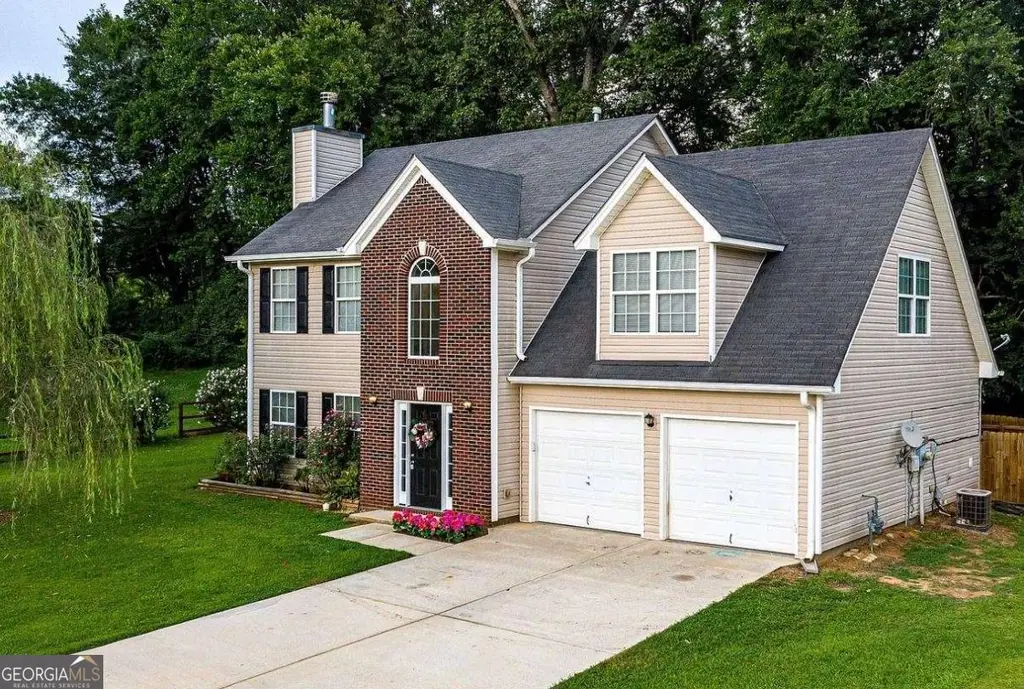
220 Piedmont Ct · Temple, GA
Flood risk 1/10 · Minimal
- FEMA flood zone
- X (unshaded)
- Chance of flooding over 30 yrs
- 0.0%
- Est. flood insurance / yr
- $507 – $1,088
Fire risk 4/10 · Minor
- Est. fire insurance / yr
- $963 – $1,789
Heat risk 5/10 · Moderate
- Hot days now (above 103°F)
- 7 days/yr
- Hot days in 30 yrs
- 19 days/yr
Wind risk 6/10 · Moderate
- Chance of severe wind over 30 yrs
- 27.0%
Air-quality risk 3/10 · Minor
- Unhealthy air days now
- 3 days/yr
- Unhealthy air days in 30 yrs
- 4 days/yr
Risk factors via First Street. Map © Google.
Why this score? — see what drove the D grade
The composite is a weighted blend of 9 inputs, each scored 0–100. Each bar is that input's sub-score; the figure is the points it added to the 100-point composite (weight × sub-score).
- ARV discount +11.0/15.0
- Appreciation +10.0/10.0
- Cash flow +7.9/30.0
- Schools +3.6/10.0
- Livability +3.6/5.0
- Rent growth +2.5/5.0
- Condition / age +2.5/5.0
- DSCR +2.0/10.0
- 1% rule +1.9/10.0
$279,900
🖨 Deal sheet (PDF) 📄 Offer letter ✓ Due diligence
Listing remarks MLS
** Gorgeous** 3 BR/2.5 BH. Beautifully landscaped level yard with a fenced in back yard for your fur babies to play. Only minutes from I-20, restaurants, & shops. Jaw-dropping open kitchen w/breakfast area,fresh paint, fixtures, carpet, and appliances. Open concept Great Room w/fireplace. Luxurious Master Suite. Spacious secondary bedrooms. Supersized 2 car garage with plenty of storage. MOVE IN READY CONDITION! Long Description
Key facts
- Grand entrance
- Spacious kitchen
- Outdoor oasis
Tags
Property features AI
Finance
- Other: Located at 220 Piedmont Ct, Temple, GA 30179; Lot approximately 0.17 acre (about 7,405 sq ft)
- HOA & community: No HOA
Exterior
- Parking: Attached garage; 2 parking spaces; Garage on kitchen level
- Utilities: Public water; Public sewer; Other utilities
- Home design: Single-family house; One-and-one-half stories; Resale property; Subdivision: Azalea Hills
- Construction: Built in 2004; Vinyl siding; Composition roof; Slab foundation
- Exterior features: Patio; Fenced yard; Other exterior features; Cul-de-sac lot
Interior
- Kitchen: Dishwasher; Refrigerator; Breakfast area; Kitchen-level laundry
- Bedrooms: 3 bedrooms
- Flooring: Carpet; Hardwood; Other
- Bathrooms: 2 full bathrooms and 1 half bathroom (3 total)
- Heating & cooling: Natural gas heating; Electric cooling
- Interior features: High ceilings; No common walls; Foyer and great room
- Laundry & utility: Laundry located in the kitchen; Gas water heater
Neighborhood map
What this means for you Summary
Snapshot
- This is a 3-bed/2.5-bath single-family listed at $280k.
Deal economics
- At list price, monthly cash flow is $-298 ($-4k/yr) — negative.
- To cash-flow at today's rent, offer at most $227k (18.8% below list).
- To meet the 1% rule (rent ≥ 1% of price), the offer needs to be $193k (31.1% below list).
- Recommended offer: $193k (31.1% below list) — sets the bar for 1% rule.
Location & tenants
- Location reads 72/100 on livability (#60 in GA) — a middle-class / working-renter tenant base. Strengths: crime A+, cost of living A+, housing A+; Watch: amenities F, commute F.
- Carroll County (rural): math 42% / reading 41% proficiency, ranked #38 of 174 in GA (top 22%) — families likely to look elsewhere, expect single-tenant / working-renter base with shorter leases.
- Zoned schools: Temple Elementary School (math 37% / reading 38%, grade F, #474 of 1,228 statewide, top 39%, 662 students, 75% FRL); Temple Middle School (math 31% / reading 36%, grade F, #206 of 470 statewide, top 45%, 621 students, 67% FRL); Temple High School (math 22% / reading 22%, grade F, #213 of 424 statewide, top 51%, 746 students, 62% FRL).
- Market conditions: 191 active listings in the ZIP; 4 comparable units currently listed for rent nearby; rentals at typical pace (median 17d on market — plan ~3-4 weeks tenant-placement turnaround); solid renter incomes; 876 units permitted in Carroll County in 2024 (150 in 5+ unit buildings).
- This rent runs 30% of the median local income ($77k/yr) — at the standard rent-burdened threshold; future hikes will face affordability resistance.
Forward outlook
- In year one you build about $30k of equity ($2k loan paydown + $28k appreciation (10.0% local appreciation)).
- Carroll County population projected at +12% by 2050 — modest demand growth; plan on rents tracking national, not racing it.
- By year 2, paydown + projected appreciation supports a ~$48k cash-out refi (75% LTV) — recoverable capital for the next deal without selling this one.
Negotiation context
- Only 10 days on market — expect competitive offers; lowballing is unlikely to land.
- 10 sale attempts since 18y ago; this cycle's ask is 67% above the opening price — seller raised mid-cycle; expect resistance to lowballs.
- Current owner paid $164k; list at $280k implies a 71% gain — meaningful room to come down on a strong offer.
Risks & watch-outs
- Climate carrying-cost: major wind risk, 27% chance of damaging wind over 30y; extreme-heat days projected 7→19/yr by 2055 (HVAC capex compounding) — expect insurance premiums to compound above CPI over the hold.
Questions for the listing agent
- What do current leases actually rent for vs. the listed asking? Can we see a recent rent roll and the last 12 months of T-12 income?
- Is there a deadline driving the sale (1031 exchange, divorce, estate, relocation)? That informs how much negotiation room exists.
- Schools are D-rated, which usually means shorter tenancies and higher turnover. Who's the typical renter profile here, and what's been the actual vacancy rate?
- The area grade is low — what's the realistic commute time and amenity access for the typical tenant pool here? Any planned neighborhood developments (good or bad) we should know about?
- What's the average days-on-market for RENTAL listings here right now (not sales)? A rising rental-DOM trend means longer vacancies and softer asking-rent achievability than the comps imply.
- What's the recent tenant-quality profile in this submarket — average credit score on applications, eviction rate, late-payment / NSF rate, and stable-employment percentage? A property-management company in the area should have these aggregated.
- How much new for-sale + rental construction is in the pipeline within 1–3 miles? Heavy new supply typically softens prices + rents 12–24 months out; constrained supply supports both.
Investment metrics
- 1% rule
- 0.69% ✗
- Cap rate
- 5.02%
- Cash-on-cash
- -4.56%
- DSCR
- 0.80
- GRM
- 12.1
CMA / ARV
- ARV (on-the-fly)
- $303,750
- Comps found
- 6
Show comp detail 6 sales within ~0.75 mi
| Address | Dist | Beds/Ba | Sqft | Sold | Price | $/sf | Match |
|---|---|---|---|---|---|---|---|
| 217 Piedmont Ct | 0.04mi | 3/2.5 | 1,620 (-14%) | 3mo | $250,000 | $154 | 73 |
| 425 Abeer St | 0.12mi | 4/3.0 (+1) | 1,826 (-3%) | 15mo | $295,000 | $162 | 70 |
| 416 Robin Hill Ln | 0.15mi | 4/2.5 (+1) | 1,980 (+6%) | 15mo | $280,000 | $141 | 66 |
| 224 Piedmont Ct | 0.01mi | 4/3.0 (+1) | 2,060 (+10%) | 15mo | $231,500 | $112 | 64 |
| 607 Emma Way | 0.59mi | 3/2.0 | 1,599 (-15%) | 16mo | $295,000 | $184 | 33 |
| 500 Grace Ct | 0.59mi | 3/2.0 | 1,601 (-15%) | 21mo | $288,000 | $180 | 29 |
Match score weights: distance 35% · size 25% · config 20% · recency 20%. Top-matched comps best support the ARV.
Projected returns pro-forma
10.0% appreciation · 3.0% rent growth · sell at horizon
- IRR
- 21.0%
- Equity multiple
- 2.70×
- Total profit
- $133,444
- Equity at exit
- $252,156
- IRR
- 19.1%
- Equity multiple
- 6.20×
- Total profit
- $407,795
- Equity at exit
- $543,784
Cash invested: $78,372 (down + closing). Projections, not guarantees.
Landlord ↔ Tenant lean methodology
- Overall (STATE)
- 90 Strongly Landlord-Friendly
- State Georgia
- 90 Strongly Landlord-Friendly · R+3
- County
- — inherits STATE
- City
- — inherits STATE
ZIP-level market 30179
- Home prices YoY
- 6.7%
- Active inventory
- 191
- Price-to-rent
- 12.1×
Monthly cashflow live
- Estimated rent
- $1,927 medium interval (Pro) →
- Mortgage (P&I)
- −$1,468
- Tax from tax record
- −$236 /mo · $2,827/yr
- Insurance
- −$117
- HOA
- −$0
- Vacancy / Maint / Mgmt
- −$405
- Net cashflow
- $-298
Break-even live
Sensitivity live
| Price | -10% $-139 | -5% $-218 | +0% $-298 | +5% $-377 | +10% $-456 |
|---|---|---|---|---|---|
| Rent | -10% $-450 | -5% $-374 | +0% $-298 | +5% $-222 | +10% $-145 |
| Rate | -1.0pp $-157 | -0.5pp $-226 | base $-298 | +0.5pp $-370 | +1.0pp $-444 |
UW: 25.0% down · 7.5% · 30yr · 1.5% tax · 5.0% vac · 8.0% maint · 8.0% mgmt
Financing live
Cash to close
- Down payment
- $69,975
- Closing costs
- $8,397
- Reserves months
- —
- Total cash needed
- —
Loan-product check · same deal, 3 products live
Conventional
25% down · 7.5% · 30yr
- Down + closing
- —
- Monthly P&I
- —
- Monthly cashflow
- —
- DSCR
- —
- Eligible?
- —
Personal DTI + credit; lowest rate.
DSCR
20% down · 8.5% · 30yr
- Down + closing
- —
- Monthly P&I
- —
- Monthly cashflow
- —
- DSCR
- —
- Eligible?
- —
No personal income docs; deal must DSCR.
Hard money
10% down · 12.0% · 12mo
- Down + closing
- —
- Monthly P&I
- —
- Monthly cashflow
- —
- DSCR
- —
- Eligible?
- —
Short-term bridge; refi at stabilization.
Rent comps 4 comps
| Address | Beds | Baths | Sqft | Rent | $/sqft | DOM | Units | Dist |
|---|---|---|---|---|---|---|---|---|
| 133 Glendale Blvd Temple, GA | 4.0 | 2.5 | 2009 | $1,779 | $0.89 | 3d | 1 | 0.13mi |
| 805 Ali St Temple, GA | 4.0 | 2.0 | 1608 | $1,789 | $1.11 | 0d | 1 | 0.22mi |
| 207 Randa Run Temple, GA | 3.0 | 2.5 | 1600 | $1,395 | $0.87 | 46d | 1 | 1.27mi |
| 206 Randa Run Temple, GA | 3.0 | 2.5 | 1600 | $1,295 | $0.81 | 17d | 1 | 1.27mi |
Listing history 7 events
-
2026-06-21days on market $279,900 Coming Soon 10 DOM
-
2026-06-18days on market $279,900 Coming Soon 7 DOM
-
2026-06-17days on market $279,900 Coming Soon 6 DOM
-
2026-06-16days on market $279,900 Coming Soon 5 DOM
-
2026-06-15days on market $279,900 Coming Soon 4 DOM
-
2026-06-13remarks 699-char remark
-
2026-06-13$279,900 Coming Soon 2 DOM
ⓘ Source: listings_history table (triggers on properties + properties_extension) + one-shot
backfill from property_details.listing_events for pre-trigger history.
Tax reassessment forecast GA · Resets to sale price
- Current annual tax
- $2,827 · $236/mo
- Projected year-2 tax
- $2,827 · $236/mo
- Expected delta
- $0/yr ($0/mo · 0.0%)
ⓘ Screening estimate from a state-policy table — verify with the county assessor before closing.
Climate risk First Street
- Flood 1/10 Low FEMA zone X (unshaded) · 0% chance over 30 yrs
- Wildfire 4/10 Moderate
- Heat 5/10 Major 7 d/yr ≥103°F today · 19 d/yr by 30 yrs out
- Wind 6/10 Major 27% chance of damaging wind over 30 yrs
- Air quality 3/10 Moderate 3 unhealthy d/yr today · 4 by 30 yrs out
Nearby sold comps map
Loading sold comps map…
Walkable amenities ~0.75 mi
Loading nearby amenities…
Taxation est. · year 1
- Rental income
- $23,125
- − Mortgage interest
- −$15,679
- − Property taxes
- −$2,827
- − Insurance
- −$1,400
- − Repairs & maintenance
- −$1,850
- − Management
- −$1,850
- − Depreciation
- −$8,143
- Taxable loss
- −$8,623
- Est. tax savings @ 24.0%
- +$2,069
- After-tax cash flow
- $-1,502/yr
For passive investors: Depreciation is non-cash, so a rental often shows a tax loss while cash-flowing — sheltering income. Rental losses are passive: they offset passive income freely, and up to $25,000/yr can offset ordinary (W-2) income if you actively participate and your MAGI is under $100k (phasing out to $0 by $150k); unused losses carry forward. On sale, claimed depreciation is recaptured at up to 25%, and gains may owe capital-gains tax (a 1031 exchange can defer both). Figures are a year-1 estimate at your 24.0% rate — not tax advice; consult a CPA.
Schools (NCES district)
- District
- Carroll County
- NCES district ID
- 1300840
- Math proficiency
- 42% ▼ -7.00%
- Reading proficiency
- 41% ▼ -8.00%
- Median HH income
- $48,692
- Composite
- 35.62/100
- National rank
- #4888
- State rank
- #38 of 174 in GA
Livability — Temple
- Score
- 72/100
- State rank
- #60
- US rank
- #5802
Category grades
Schools grade is shown separately in the Schools card above.
Census & demographics
- County
- Carroll County · 124,888 people
- City population
- 19,882
- Metro
- Atlanta-Sandy Springs-Alpharetta, GA
- Population (ZIP)
- 19,882
- Household income
- $76,571
- Rent vs Own
- Severe rent burden
- 396.0
Population outlook (Carroll County) Hauer SSP2
- Today (2025)
- 123,370 people
- By 2030
- 127,186 · +3.1%
- By 2040
- 133,534 · +8.2%
- By 2050
- 137,612 · +11.5%
- By 2075
- 142,892 · +15.8%
- By 2100
- 136,294 · +10.5%
Race, ethnicity, and origin ACS 2023
- Neighborhood character
- Predominantly White (77%)
- Race & ethnicity
- White 77% Black 15% Hispanic / Latino 5% Two or more races 4%
- Common ancestry
- Italian 1% Lithuanian 1% Serbian 1%
- Foreign-born
- 4% · Canada
- Languages at home
- 95% English-only · Spanish 4%
Political lean MEDSL · Carroll
- 2024 margin
- Solid R (+41.2) · D 29.1% · R 70.3%
- 2008→2024 swing
- -8.2pp toward R · 2008: -32.9pp · 2024: -41.2pp
- All cycles
- 2024: R+41.2 2020: R+39.0 2016: R+40.1 2012: R+37.7 2008: R+32.9
Not yet ingested
- Civics
- —
Market trends
- HPI YoY
- ▲ 27.16%
- Current HPI
- 435.3863
- Rent YoY
- —
- Metro
- Atlanta-Sandy Springs-Alpharetta, GA
- State GDP YoY
- ▲ 2.66%
- F500 in state
- 28
Industry mix (Fortune 500 HQ in GA)
| Industry | F500 HQs | Revenue |
|---|---|---|
| Paper / Packaging | 2 | $29B |
|
||
| Retail | 1 | $160B |
|
||
| Transportation / Logistics | 1 | $91B |
|
||
| Airlines | 1 | $62B |
|
||
| Consumer Goods | 1 | $47B |
|
||
| Utilities | 1 | $25B |
|
||
Price history
+374.4% since first listed40 events — show timeline
- 2026-06-11 Coming Soon $279,900 GAMLS
- 2019-09-23 Sold (Public Records) $164,000 Public Records
- 2019-09-12 Sold (MLS) $164,000 GAMLS
- 2019-09-12 Sold (MLS) $164,000 FMLS
- 2019-08-08 Pending — GAMLS
- 2019-08-08 Pending — FMLS
- 2019-08-02 Listed $168,000 GAMLS
- 2019-08-02 Listed $168,000 FMLS
- 2016-02-10 Price Changed $91,200 FMLS
- 2015-12-28 Sold (Public Records) $109,900 Public Records
- 2015-12-04 Sold (MLS) $109,900 GAMLS
- 2015-12-04 Sold (MLS) $109,900 FMLS
- 2015-11-12 Pending — GAMLS
- 2015-11-12 Contingent — FMLS
- 2015-11-09 Relisted — FMLS
- 2015-11-09 Relisted — GAMLS
- 2015-10-29 Pending — GAMLS
- 2015-10-29 Contingent — FMLS
- 2015-10-14 Price Changed $109,900 GAMLS
- 2015-10-13 Price Changed $109,900 FMLS
- 2015-09-09 Listed $114,900 GAMLS
- 2015-09-09 Listed $114,900 FMLS
- 2015-09-08 Listing Removed — GAMLS
- 2015-08-11 Price Changed $119,900 GAMLS
- 2015-07-16 Price Changed $124,900 GAMLS
- 2015-06-30 Price Changed $95,760 GAMLS
- 2015-06-15 Listed $129,900 GAMLS
- 2015-05-29 Sold (MLS) $95,760 GAMLS
- 2015-05-29 Sold (MLS) $95,760 FMLS
- 2015-04-17 Pending — GAMLS
- 2015-04-17 Price Changed $96,000 GAMLS
- 2015-04-13 Contingent — FMLS
- 2015-03-31 Price Changed $95,760 FMLS
- 2015-03-31 Price Changed $91,200 FMLS
- 2015-02-18 Listed $96,000 FMLS
- 2015-02-18 Listed $96,000 GAMLS
- 2008-07-22 Sold (Public Records) $121,700 Public Records
- 2008-07-15 Sold (MLS) $121,700 FMLS
- 2008-04-21 Listed $124,900 FMLS
- 2004-04-23 Sold (Public Records) $59,000 Public Records
Property tax history
+3.0%/yrLatest (2025): $2,827 · -0.9% YoY. Source: county tax records.
Cash-flow waterfall
monthlySold comps — $/sqft
last 12 mo · ≤1 miLoading sold comps…