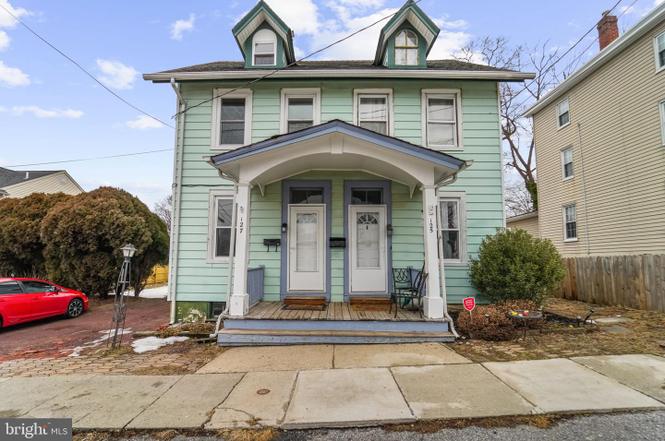
127 Schooley St · Moorestown-Lenola, NJ
Flood risk 1/10 · Minimal
- FEMA flood zone
- X (unshaded)
- Chance of flooding over 30 yrs
- 0.0%
- Est. flood insurance / yr
- $507 – $1,088
Fire risk 1/10 · Minimal
- Est. fire insurance / yr
- $526 – $976
Heat risk 6/10 · Moderate
- Hot days now (above 104°F)
- 7 days/yr
- Hot days in 30 yrs
- 14 days/yr
Wind risk 6/10 · Moderate
- Chance of severe wind over 30 yrs
- 53.0%
Air-quality risk 4/10 · Minor
- Unhealthy air days now
- 5 days/yr
- Unhealthy air days in 30 yrs
- 7 days/yr
Risk factors via First Street. Map © Google.
Why this score? — see what drove the D grade
The composite is a weighted blend of 9 inputs, each scored 0–100. Each bar is that input's sub-score; the figure is the points it added to the 100-point composite (weight × sub-score).
- Cash flow +14.5/30.0
- ARV discount +7.5/15.0
- Schools +5.5/10.0
- DSCR +4.4/10.0
- 1% rule +3.6/10.0
- Rent growth +2.5/5.0
- Livability +2.5/5.0
- Condition / age +2.5/5.0
- Appreciation +0.0/10.0
$330,000
🖨 Deal sheet 📄 Offer letter ✓ Due diligence
Listing remarks
Know that song that goes 'to the left - to the left - everything you own in the house to the left'? Or something along those lines. .. it fits perfectly for 127 Schooley! This is a 3-bed 1-bath semi-detached home (to the left) that was recently refreshed and is ready for you to break into the Moorestown market at a price that doesn't make you question your career choices, all while being walkable to downtown for that extra flex when you tell people where your new home is. This home is situated in one of New Jersey's destination towns, offering convenient access to major roadways, shopping, and dining. There is a good-sized unfinished basement perfect for a beat laboratory, along with storag
Key facts
- 2 parking spots
- Built 1876
- Listed 64 days
Property features AI
Finance
- Other: Ownership is fee simple; Above-grade finished area approximately 838 (source: assessor)
Exterior
- Parking: Driveway with 2 parking spaces (total 2 garage/parking spaces)
- Utilities: Public water; Public sewer; Electric service
- Home design: Semi-detached structure; Above-grade and below-grade usable areas
- Construction: Frame construction; Concrete perimeter foundation
- Exterior features: Partially fenced rear yard with wood fencing; Lot dimensions approximately 34 x 94
Interior
- Bedrooms: Three bedrooms on the first upper level
- Flooring: Hardwood
- Bathrooms: One full bathroom (all upper levels)
- Heating & cooling: 90% forced air heating; Natural gas heating and hot water; Central air conditioning (electric)
- Interior features: Hardwood flooring; Basement with connecting stairway
Neighborhood map
What this means for you Summary
Snapshot
- This is a 3-bed/1.0-bath single-family listed at $330k.
Deal economics
- At list price, monthly cash flow is $70 ($842/yr) — positive.
- The deal already cash-flows at list — no discount required.
- To meet the 1% rule (rent ≥ 1% of price), the offer needs to be $283k (14.3% below list).
- Recommended offer: $283k (14.3% below list) — sets the bar for 1% rule.
- Cap rate 6.5% vs local median 3.0% in Moorestown-Lenola — top-decile yield for the area; either an underpriced asset or a hidden risk that comps aren't pricing in. Stress-test before assuming the spread holds.
Location & tenants
- Location reads: area grade D — affects rentability + tenant quality, not the cash-flow math above.
- Moorestown Township Public School District (suburban): math 51% / reading 63% proficiency, ranked #58 of 472 in NJ (top 12%) — acceptable for families but not a draw, mixed tenant base, ~2y average lease; only 7% free/reduced lunch — higher-income household profile.
- Market conditions: 117 active listings in the ZIP; 3 comparable units currently listed for rent nearby; rentals leasing fast (median 5d on market — plan ~1-2 weeks tenant-placement turnaround); high-income renter base; 2,161 units permitted in Burlington County in 2024 (988 in 5+ unit buildings).
Forward outlook
- Local home prices are declining (-3.0%/yr); year-one equity from $2k of loan paydown is wiped out by about $10k of value loss. Plan a longer hold.
- Burlington County population projected to shrink 5% by 2050 — rents likely to lag national; underwrite the cash flow, not the appreciation.
Negotiation context
- It's been on market 64 days — a 6% lower offer ($310k) is reasonable based on typical stale-listing flexibility.
- 3 sale attempts since 5y ago; this cycle's ask has dropped $45k (12%) from the opening price — seller is motivated, your offer sets the floor, not the list.
- Current owner paid $225k; 47% above their basis — modest negotiation headroom, anchor on the comps not their cost.
Risks & watch-outs
- Watch-outs: built in 1876 — expect roof / HVAC / electrical / plumbing capex.
- Climate carrying-cost: major wind risk, 53% chance of damaging wind over 30y; extreme-heat days projected 7→14/yr by 2055 (HVAC capex compounding) — expect insurance premiums to compound above CPI over the hold.
Questions for the listing agent
- It's been on market 64 days. Have you received any prior offers? Is the seller open to a 14% concession, seller financing, or rate buy-down credit?
- Built in 1876 — when were the roof, HVAC, electrical panel, plumbing, and water heater last replaced?
- Why hasn't it sold? Are there any deal-killer items the seller is aware of (foundation, flood, title, zoning, code violations)?
- Is there a deadline driving the sale (1031 exchange, divorce, estate, relocation)? That informs how much negotiation room exists.
- The area grade is low — what's the realistic commute time and amenity access for the typical tenant pool here? Any planned neighborhood developments (good or bad) we should know about?
- What's the average days-on-market for RENTAL listings here right now (not sales)? A rising rental-DOM trend means longer vacancies and softer asking-rent achievability than the comps imply.
- What's the recent tenant-quality profile in this submarket — average credit score on applications, eviction rate, late-payment / NSF rate, and stable-employment percentage? A property-management company in the area should have these aggregated.
- How much new for-sale + rental construction is in the pipeline within 1–3 miles? Heavy new supply typically softens prices + rents 12–24 months out; constrained supply supports both.
Investment metrics
- 1% rule
- 0.86% ✗
- Cap rate
- 6.55%
- Cash-on-cash
- 0.91%
- DSCR
- 1.04
- GRM
- 9.7
CMA / ARV
No comps found within radius.
Projected returns pro-forma
-3.0% appreciation · 3.0% rent growth · sell at horizon
- IRR
- -14.9%
- Equity multiple
- 0.47×
- Total profit
- $-49,031
- Equity at exit
- $49,204
- IRR
- -6.2%
- Equity multiple
- 0.60×
- Total profit
- $-37,054
- Equity at exit
- $28,532
Cash invested: $92,400 (down + closing). Projections, not guarantees.
Landlord ↔ Tenant lean methodology
- Overall (STATE)
- 21 Tenant-Leaning
- State New Jersey
- 21 Tenant-Leaning · D+6
- County
- — inherits STATE
- City
- — inherits STATE
ZIP-level market 08057
- Active inventory
- 117
- Price-to-rent
- 9.7×
Monthly cashflow live
- Estimated rent
- $2,829 medium interval (Pro) →
- Mortgage (P&I)
- −$1,731
- Tax from tax record
- −$297 /mo · $3,562/yr
- Insurance
- −$138
- HOA
- −$0
- Vacancy / Maint / Mgmt
- −$594
- Net cashflow
- $70
Break-even live
UW: 25.0% down · 7.5% · 30yr · 1.5% tax · 5.0% vac · 8.0% maint · 8.0% mgmt
Financing live
Cash to close
- Down payment
- $82,500
- Closing costs
- $9,900
- Reserves months
- —
- Total cash needed
- —
Loan-product check · same deal, 3 products live
Conventional
25% down · 7.5% · 30yr
- Down + closing
- —
- Monthly P&I
- —
- Monthly cashflow
- —
- DSCR
- —
- Eligible?
- —
Personal DTI + credit; lowest rate.
DSCR
20% down · 8.5% · 30yr
- Down + closing
- —
- Monthly P&I
- —
- Monthly cashflow
- —
- DSCR
- —
- Eligible?
- —
No personal income docs; deal must DSCR.
Hard money
10% down · 12.0% · 12mo
- Down + closing
- —
- Monthly P&I
- —
- Monthly cashflow
- —
- DSCR
- —
- Eligible?
- —
Short-term bridge; refi at stabilization.
Rent comps 3 comps
| Address | Beds | Baths | Sqft | Rent | $/sqft | DOM | Units | Dist |
|---|---|---|---|---|---|---|---|---|
| 115 E 2nd St Moorestown, NJ | 2.0 | 1.5 | 1088 | $2,950 | $2.71 | 18d | 1 | 0.07mi |
| 115 E 2nd St Moorestown, NJ | 2.0 | 1.5 | 1088 | $2,950 | $2.71 | 1d | 1 | 0.07mi |
| 500 E Camden Ave Moorestown, NJ | 2.0 | 1.0 | 765 | $1,882 | $2.46 | 5d | 6 | 1.38mi |
Listing history 19 events
-
2026-05-04status Pending
-
2026-04-28historical Active Under Contract
-
2026-04-20price $330,000
-
2026-04-14price $335,000
-
2026-04-07price $340,000
-
2026-04-01price $350,000
-
2026-03-25price $355,000
-
2026-03-17price $360,000
-
2026-03-09price $365,000
-
2026-03-04price $370,000
-
2026-02-24$375,000 Active
-
2026-02-20price $375,000
-
2026-02-16historical $425,000
-
2025-07-10soldstatus $225,000
-
2021-09-29historical
-
2021-03-01historical
-
2021-03-01$175,000 Active
-
2021-02-26$175,000 Active
-
1998-12-29soldstatus $89,000
ⓘ Source: listings_history table (triggers on properties + properties_extension) + one-shot
backfill from property_details.listing_events for pre-trigger history.
Tax reassessment forecast NJ · Partial reset (capped growth)
- Current annual tax
- $3,562 · $297/mo
- Projected year-2 tax
- $5,889 · $491/mo
- Expected delta
- +$2,328/yr (+$194/mo · 65.4%)
ⓘ Screening estimate from a state-policy table — verify with the county assessor before closing.
Climate risk First Street
- Flood 1/10 Low FEMA zone X (unshaded) · 0% chance over 30 yrs
- Wildfire 1/10 Low
- Heat 6/10 Major 7 d/yr ≥104°F today · 14 d/yr by 30 yrs out
- Wind 6/10 Major 53% chance of damaging wind over 30 yrs
- Air quality 4/10 Moderate 5 unhealthy d/yr today · 7 by 30 yrs out
Nearby sold comps map
Loading sold comps map…
Walkable amenities ~0.75 mi
Loading nearby amenities…
Taxation est. · year 1
- Rental income
- $33,950
- − Mortgage interest
- −$18,485
- − Property taxes
- −$3,562
- − Insurance
- −$1,650
- − Repairs & maintenance
- −$2,716
- − Management
- −$2,716
- − Depreciation
- −$9,600
- Taxable loss
- −$4,779
- Est. tax savings @ 24.0%
- +$1,147
- After-tax cash flow
- $1,989/yr
For passive investors: Depreciation is non-cash, so a rental often shows a tax loss while cash-flowing — sheltering income. Rental losses are passive: they offset passive income freely, and up to $25,000/yr can offset ordinary (W-2) income if you actively participate and your MAGI is under $100k (phasing out to $0 by $150k); unused losses carry forward. On sale, claimed depreciation is recaptured at up to 25%, and gains may owe capital-gains tax (a 1031 exchange can defer both). Figures are a year-1 estimate at your 24.0% rate — not tax advice; consult a CPA.
Schools (NCES district)
- District
- Moorestown Township Public School District
- NCES district ID
- 3410710
- Math proficiency
- 51% ▼ -19.00%
- Reading proficiency
- 63% ▼ -13.00%
- Median HH income
- $115,968
- Composite
- 54.85/100
- National rank
- #1313
- State rank
- #58 of 472 in NJ
Livability — Moorestown-Lenola
No livability data for this city. (Only ~50 U.S. cities are tracked.)
Census & demographics
- Census place
- Moorestown-Lenola, NJ
- County
- Burlington County · 323,710 people
- City population
- 20,990
- Metro
- Philadelphia-Camden-Wilmington, PA-NJ-DE-MD
- Population (ZIP)
- 21,529
- Household income
- $158,770
- Rent vs Own
- Severe rent burden
- 470.0
Population outlook (Burlington County) Hauer SSP2
- Today (2025)
- 453,425 people
- By 2030
- 452,359 · -0.2%
- By 2040
- 445,033 · -1.9%
- By 2050
- 431,760 · -4.8%
- By 2075
- 406,277 · -10.4%
- By 2100
- 364,732 · -19.6%
Race, ethnicity, and origin ACS 2023
- Neighborhood character
- Predominantly White (77%)
- Race & ethnicity
- White 77% Asian 8% Two or more races 7% Hispanic / Latino 6% Black 5%
- Hispanic origin (detail)
- Mexican 1% Puerto Rican 2%
- Common ancestry
- Romanian 5% Scotch-Irish 2% Italian 2%
- Foreign-born
- 9% · Canada, China, South Korea
- Languages at home
- 86% English-only · Other Indo-European 4% Chinese 4% Spanish 3%
Political lean MEDSL · Burlington
- 2024 margin
- D (+16.6) · D 57.6% · R 41.0% · Other 1.3%
- 2008→2024 swing
- -2.0pp toward R · 2008: 18.6pp · 2024: 16.6pp
- All cycles
- 2024: D+16.6 2020: D+19.5 2016: D+14.8 2012: D+18.7 2008: D+18.6
Not yet ingested
- Civics
- —
Market trends
- HPI YoY
- ▼ -645.09%
- Current HPI
- 293.3163
- Rent YoY
- —
- Metro
- Philadelphia-Camden-Wilmington, PA-NJ-DE-MD
- State GDP YoY
- ▲ 2.05%
- F500 in state
- 34
Industry mix (Fortune 500 HQ in NJ)
| Industry | F500 HQs | Revenue |
|---|---|---|
| Consumer Goods | 3 | $31B |
|
||
| Pharmaceuticals | 2 | $153B |
|
||
| Technology | 2 | $21B |
|
||
| Insurance | 2 | $20B |
|
||
| Healthcare | 2 | $19B |
|
||
| Financial Services | 1 | $70B |
|
||
Price history
+270.8% since first listed19 events — show timeline
- 2026-05-04 Pending — BRIGHT MLS
- 2026-04-28 Contingent — BRIGHT MLS
- 2026-04-20 Price Changed $330,000 BRIGHT MLS
- 2026-04-14 Price Changed $335,000 BRIGHT MLS
- 2026-04-07 Price Changed $340,000 BRIGHT MLS
- 2026-04-01 Price Changed $350,000 BRIGHT MLS
- 2026-03-25 Price Changed $355,000 BRIGHT MLS
- 2026-03-17 Price Changed $360,000 BRIGHT MLS
- 2026-03-09 Price Changed $365,000 BRIGHT MLS
- 2026-03-04 Price Changed $370,000 BRIGHT MLS
- 2026-02-24 Listed $375,000 BRIGHT MLS
- 2026-02-20 Price Changed $375,000 BRIGHT MLS
- 2026-02-16 Coming Soon $425,000 BRIGHT MLS
- 2025-07-10 Sold (Public Records) $225,000 Public Records
- 2021-09-29 Listing Removed — BRIGHT MLS
- 2021-03-01 Listed $175,000 BRIGHT MLS
- 2021-03-01 Listing Removed — BRIGHT MLS
- 2021-02-26 Listed $175,000 BRIGHT MLS
- 1998-12-29 Sold (Public Records) $89,000 Public Records
Property tax history
+1.0%/yrLatest (2025): $3,562 · +2.2% YoY. Source: county tax records.
Cash-flow waterfall
monthlySold comps — $/sqft
last 12 mo · ≤1 miLoading sold comps…