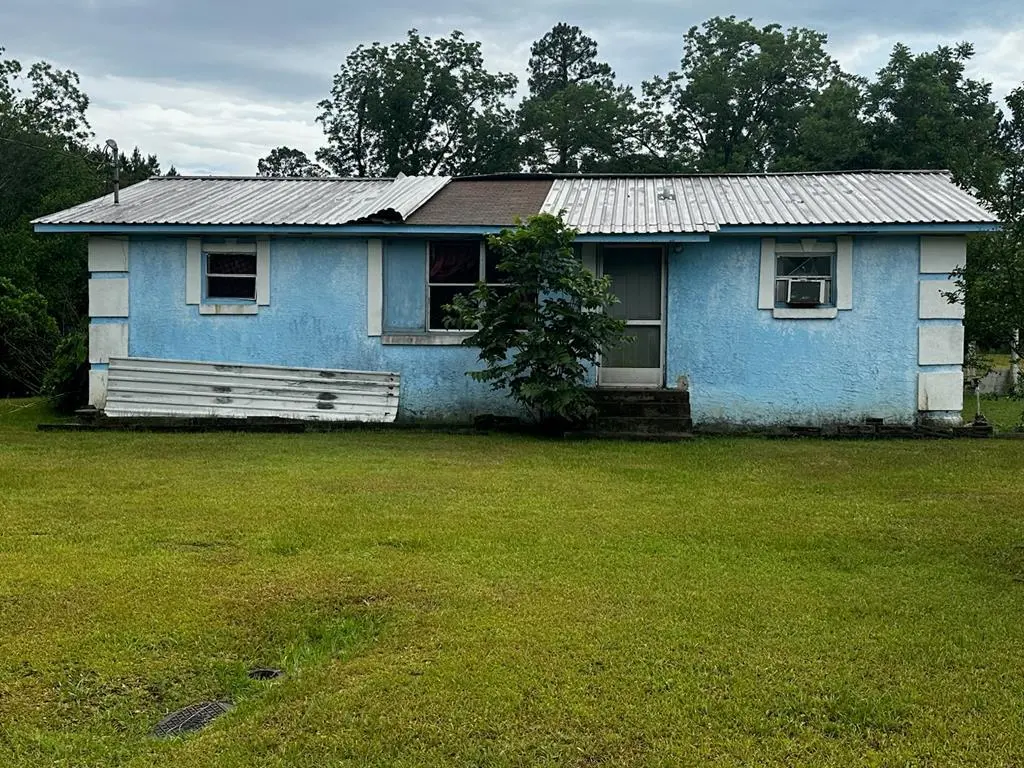
1038 Church St · Barwick, GA
Flood risk 1/10 · Minimal
- FEMA flood zone
- X (unshaded)
- Chance of flooding over 30 yrs
- 0.0%
- Est. flood insurance / yr
- $507 – $1,088
Fire risk 5/10 · Moderate
- Est. fire insurance / yr
- $963 – $1,789
Heat risk 8/10 · Major
- Hot days now (above 107°F)
- 7 days/yr
- Hot days in 30 yrs
- 20 days/yr
Wind risk 8/10 · Major
- Chance of severe wind over 30 yrs
- 99.0%
Air-quality risk 5/10 · Moderate
- Unhealthy air days now
- 9 days/yr
- Unhealthy air days in 30 yrs
- 9 days/yr
Risk factors via First Street. Map © Google.
Why this score? — see what drove the B grade
The composite is a weighted blend of 9 inputs, each scored 0–100. Each bar is that input's sub-score; the figure is the points it added to the 100-point composite (weight × sub-score).
- Cash flow +30.0/30.0
- 1% rule +10.0/10.0
- DSCR +10.0/10.0
- ARV discount +7.5/15.0
- Appreciation +5.0/10.0
- Livability +2.7/5.0
- Rent growth +2.5/5.0
- Schools +2.5/10.0
- Condition / age +2.5/5.0
$49,900
🖨 Deal sheet (PDF) 📄 Offer letter ✓ Due diligence
Listing remarks MLS
Investor Special! This 3-bedroom, 2-bath home is being sold as-is and is perfect for anyone looking to flip, rent, or renovate for instant equity. Located in a neighborhood with strong rental potential, this property offers solid bones and tons of upside. Bring your vision and your toolbox, repairs are needed, but the possibilities are endless. Don't miss this opportunity to turn a fixer-upper into a profitable investment!
Key facts
- 0.33 acre lot
- Built 1986
- Listed 380 days
Neighborhood map
What this means for you Summary
Snapshot
- This is a 3-bed/1.0-bath single-family listed at $50k.
Deal economics
- At list price, monthly cash flow is $483 ($6k/yr) — positive.
- The deal already cash-flows at list — no discount required.
- Meets the 1% rule at list price ($1k rent vs $50k).
- Recommended offer: $44k (12.0% below list) — sets the bar for market timing.
Location & tenants
- Location reads 54/100 on livability (#547 in GA) — a working-class tenant base; expect higher turnover. Strengths: cost of living A+; Watch: health & safety D, crime D-, amenities F.
- Thomas County (rural): math 27% / reading 32% proficiency, ranked #97 of 174 in GA (top 56%) — low school quality limits family demand, transient renter base, plan for 1-2y turnover.
- Zoned schools: Garrison-Pilcher Elementary School (781 students, 93% FRL); Thomas County Middle School (math 25% / reading 34%, grade F, #249 of 470 statewide, top 55%, 1,714 students, 93% FRL); Thomas County Central High School (math 21% / reading 28%, grade F, #184 of 424 statewide, top 48%, 1,517 students, 77% FRL) — zoned schools average 87% FRL vs 58% district-wide (30 pts higher); higher-poverty schools than district average — tighter screening recommended.
- Market conditions: 1 active listings in the ZIP; 213 units permitted in Thomas County in 2024 (72 in 5+ unit buildings).
Forward outlook
- In year one you build about $2k of equity ($345 loan paydown + $1k appreciation (3.0% local appreciation)).
- Thomas County population projected to shrink 7% by 2050 — rents likely to lag national; underwrite the cash flow, not the appreciation.
- At projected returns (3.0% appreciation + 3.0% rent growth), your $14k cash investment doubles in ~2 years — after that, you're playing with house money.
Negotiation context
- It's been on market 380 days — a 12% lower offer ($44k) is reasonable based on typical stale-listing flexibility.
- Current owner paid $30k; list at $50k implies a 66% gain — meaningful room to come down on a strong offer.
Risks & watch-outs
- Climate carrying-cost: severe wind risk, 99% chance of damaging wind over 30y; moderate wildfire risk; extreme-heat days projected 7→20/yr by 2055 (HVAC capex compounding) — expect insurance premiums to compound above CPI over the hold.
Questions for the listing agent
- It's been on market 380 days. Have you received any prior offers? Is the seller open to a 12% concession, seller financing, or rate buy-down credit?
- Why hasn't it sold? Are there any deal-killer items the seller is aware of (foundation, flood, title, zoning, code violations)?
- Is there a deadline driving the sale (1031 exchange, divorce, estate, relocation)? That informs how much negotiation room exists.
- Schools are F-rated, which usually means shorter tenancies and higher turnover. Who's the typical renter profile here, and what's been the actual vacancy rate?
- Crime grade is D in this area — have there been break-ins, vandalism, or insurance claims at this property in the last 3 years? What carrier currently insures it and at what premium?
- What's the average days-on-market for RENTAL listings here right now (not sales)? A rising rental-DOM trend means longer vacancies and softer asking-rent achievability than the comps imply.
- What's the recent tenant-quality profile in this submarket — average credit score on applications, eviction rate, late-payment / NSF rate, and stable-employment percentage? A property-management company in the area should have these aggregated.
- How much new for-sale + rental construction is in the pipeline within 1–3 miles? Heavy new supply typically softens prices + rents 12–24 months out; constrained supply supports both.
Investment metrics
- 1% rule
- 2.01% ✓
- Cap rate
- 17.90%
- Cash-on-cash
- 41.45%
- DSCR
- 2.84
- GRM
- 4.1
CMA / ARV
- ARV (median comp)
- $138,045
- List price
- $49,900
- Delta
- -63.85%
- Verdict
- UNDERPRICED
- Comps
- 4 within 1.0 mi
Show comp detail 1 sale within ~0.75 mi
| Address | Dist | Beds/Ba | Sqft | Sold | Price | $/sf | Match |
|---|---|---|---|---|---|---|---|
| 2050 S Bubba Christful St | 0.23mi | 3/1.0 | 1,008 (+5%) | 13mo | $148,750 | $148 | 70 |
Match score weights: distance 35% · size 25% · config 20% · recency 20%. Top-matched comps best support the ARV.
Projected returns pro-forma
3.0% appreciation · 3.0% rent growth · sell at horizon
- IRR
- 46.9%
- Equity multiple
- 3.63×
- Total profit
- $36,747
- Equity at exit
- $22,437
- IRR
- 46.6%
- Equity multiple
- 7.28×
- Total profit
- $87,732
- Equity at exit
- $34,578
Cash invested: $13,972 (down + closing). Projections, not guarantees.
Landlord ↔ Tenant lean methodology
- Overall (STATE)
- 90 Strongly Landlord-Friendly
- State Georgia
- 90 Strongly Landlord-Friendly · R+3
- County
- — inherits STATE
- City
- — inherits STATE
ZIP-level market 31720
- Active inventory
- 1
- Price-to-rent
- 4.1×
Monthly cashflow live
- Estimated rent
- $1,005 medium interval (Pro) →
- Mortgage (P&I)
- −$262
- Tax from tax record
- −$28 /mo · $342/yr
- Insurance
- −$21
- HOA
- −$0
- Vacancy / Maint / Mgmt
- −$211
- Net cashflow
- $483
Break-even live
Sensitivity live
| Price | -10% $511 | -5% $497 | +0% $483 | +5% $469 | +10% $454 |
|---|---|---|---|---|---|
| Rent | -10% $403 | -5% $443 | +0% $483 | +5% $522 | +10% $562 |
| Rate | -1.0pp $508 | -0.5pp $495 | base $483 | +0.5pp $470 | +1.0pp $457 |
UW: 25.0% down · 7.5% · 30yr · 1.5% tax · 5.0% vac · 8.0% maint · 8.0% mgmt
Financing live
Cash to close
- Down payment
- $12,475
- Closing costs
- $1,497
- Reserves months
- —
- Total cash needed
- —
Loan-product check · same deal, 3 products live
Conventional
25% down · 7.5% · 30yr
- Down + closing
- —
- Monthly P&I
- —
- Monthly cashflow
- —
- DSCR
- —
- Eligible?
- —
Personal DTI + credit; lowest rate.
DSCR
20% down · 8.5% · 30yr
- Down + closing
- —
- Monthly P&I
- —
- Monthly cashflow
- —
- DSCR
- —
- Eligible?
- —
No personal income docs; deal must DSCR.
Hard money
10% down · 12.0% · 12mo
- Down + closing
- —
- Monthly P&I
- —
- Monthly cashflow
- —
- DSCR
- —
- Eligible?
- —
Short-term bridge; refi at stabilization.
Listing history 19 events
-
2026-06-21days on market $49,900 Active 380 DOM
-
2026-06-19days on market $49,900 Active 378 DOM
-
2026-06-18days on market $49,900 Active 377 DOM
-
2026-06-17days on market $49,900 Active 376 DOM
-
2026-06-16days on market $49,900 Active 375 DOM
-
2026-06-15days on market $49,900 Active 374 DOM
-
2026-06-14days on market $49,900 Active 372 DOM
-
2026-06-12days on market $49,900 Active 371 DOM
-
2026-06-09days on market $49,900 Active 368 DOM
-
2026-06-08days on market $49,900 Active 367 DOM
-
2026-06-07days on market $49,900 Active 366 DOM
-
2026-06-07days on market $49,900 Active 365 DOM
-
2026-06-03days on market $49,900 Active 362 DOM
-
2026-06-02days on market $49,900 Active 361 DOM
-
2026-06-01days on market $49,900 Active 360 DOM
-
2026-05-31days on market $49,900 Active 359 DOM
-
2026-05-31days on market $49,900 Active 358 DOM
-
2025-06-06$49,900 Active 426-char remark
Show marketing remark (426 chars)
Investor Special! This 3-bedroom, 2-bath home is being sold as-is and is perfect for anyone looking to flip, rent, or renovate for instant equity. Located in a neighborhood with strong rental potential, this property offers solid bones and tons of upside. Bring your vision and your toolbox, repairs are needed, but the possibilities are endless. Don't miss this opportunity to turn a fixer-upper into a profitable investment!
-
2001-03-01soldstatus $30,000
ⓘ Source: listings_history table (triggers on properties + properties_extension) + one-shot
backfill from property_details.listing_events for pre-trigger history.
Tax reassessment forecast GA · Resets to sale price
- Current annual tax
- $342 · $28/mo
- Projected year-2 tax
- $459 · $38/mo
- Expected delta
- +$117/yr (+$10/mo · 34.2%)
ⓘ Screening estimate from a state-policy table — verify with the county assessor before closing.
Climate risk First Street
- Flood 1/10 Low FEMA zone X (unshaded) · 0% chance over 30 yrs
- Wildfire 5/10 Major
- Heat 8/10 Severe 7 d/yr ≥107°F today · 20 d/yr by 30 yrs out
- Wind 8/10 Severe 99% chance of damaging wind over 30 yrs
- Air quality 5/10 Major 9 unhealthy d/yr today · 9 by 30 yrs out
Nearby sold comps map
Loading sold comps map…
Walkable amenities ~0.75 mi
Loading nearby amenities…
Taxation est. · year 1
- Rental income
- $12,055
- − Mortgage interest
- −$2,795
- − Property taxes
- −$342
- − Insurance
- −$250
- − Repairs & maintenance
- −$964
- − Management
- −$964
- − Depreciation
- −$1,452
- Taxable income
- $5,288
- Est. tax owed @ 24.0%
- −$1,269
- After-tax cash flow
- $4,523/yr
For passive investors: Depreciation is non-cash, so a rental often shows a tax loss while cash-flowing — sheltering income. Rental losses are passive: they offset passive income freely, and up to $25,000/yr can offset ordinary (W-2) income if you actively participate and your MAGI is under $100k (phasing out to $0 by $150k); unused losses carry forward. On sale, claimed depreciation is recaptured at up to 25%, and gains may owe capital-gains tax (a 1031 exchange can defer both). Figures are a year-1 estimate at your 24.0% rate — not tax advice; consult a CPA.
Schools (NCES district)
- District
- Thomas County
- NCES district ID
- 1304890
- Math proficiency
- 27% ▼ -8.00%
- Reading proficiency
- 32% ▼ -3.00%
- Median HH income
- $41,341
- Composite
- 24.95/100
- National rank
- #7565
- State rank
- #97 of 174 in GA
Livability — Barwick
- Score
- 54/100
- State rank
- #547
- US rank
- #24130
Category grades
Schools grade is shown separately in the Schools card above.
Census & demographics
- Census place
- Barwick, GA
- Population (ZIP)
- 366
Population outlook (Thomas County) Hauer SSP2
- Today (2025)
- 45,303 people
- By 2030
- 45,052 · -0.6%
- By 2040
- 44,034 · -2.8%
- By 2050
- 42,310 · -6.6%
- By 2075
- 37,569 · -17.1%
- By 2100
- 30,676 · -32.3%
Race, ethnicity, and origin ACS 2023
- Neighborhood character
- Majority Black (63%)
- Race & ethnicity
- Black 63% White 37%
- Common ancestry
- Slovak 2% Scottish 1% Serbian 1%
Political lean MEDSL · Thomas
- 2024 margin
- Strong R (+24.1) · D 37.8% · R 61.9%
- 2008→2024 swing
- -8.3pp toward R · 2008: -15.8pp · 2024: -24.1pp
- All cycles
- 2024: R+24.1 2020: R+19.5 2016: R+21.8 2012: R+18.5 2008: R+15.8
Not yet ingested
- Civics
- —
Market trends
- HPI YoY
- —
- Current HPI
- —
- Rent YoY
- —
- Metro
- —
- State GDP YoY
- ▲ 2.66%
- F500 in state
- 28
Industry mix (Fortune 500 HQ in GA)
| Industry | F500 HQs | Revenue |
|---|---|---|
| Paper / Packaging | 2 | $29B |
|
||
| Retail | 1 | $160B |
|
||
| Transportation / Logistics | 1 | $91B |
|
||
| Airlines | 1 | $62B |
|
||
| Consumer Goods | 1 | $47B |
|
||
| Utilities | 1 | $25B |
|
||
Price history
+66.3% since first listed2 events — show timeline
- 2025-06-06 Listed $49,900 TABRMLS
- 2001-03-01 Sold (Public Records) $30,000 Public Records
Property tax history
+6.1%/yrLatest (2025): $342 · +87.8% YoY. Source: county tax records.
Cash-flow waterfall
monthlySold comps — $/sqft
last 12 mo · ≤1 miLoading sold comps…