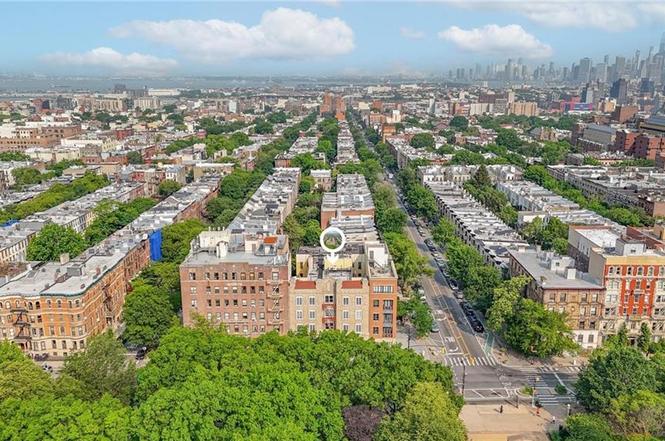
145 Prospect Park W Unit 4D · New York, NY
Flood risk 1/10 · Minimal
- FEMA flood zone
- X (unshaded)
- Chance of flooding over 30 yrs
- 0.0%
- Est. flood insurance / yr
- $507 – $1,088
Fire risk 2/10 · Minimal
- Est. fire insurance / yr
- $691 – $1,283
Heat risk 6/10 · Moderate
- Hot days now (above 99°F)
- 7 days/yr
- Hot days in 30 yrs
- 14 days/yr
Wind risk 6/10 · Moderate
- Chance of severe wind over 30 yrs
- 65.0%
Air-quality risk 4/10 · Minor
- Unhealthy air days now
- 5 days/yr
- Unhealthy air days in 30 yrs
- 7 days/yr
Risk factors via First Street. Map © Google.
Why this score? — see what drove the D grade
The composite is a weighted blend of 9 inputs, each scored 0–100. Each bar is that input's sub-score; the figure is the points it added to the 100-point composite (weight × sub-score).
- Appreciation +10.0/10.0
- ARV discount +7.5/15.0
- Cash flow +6.9/30.0
- Schools +5.0/10.0
- Rent growth +3.9/5.0
- Livability +3.8/5.0
- Condition / age +2.5/5.0
- 1% rule +1.5/10.0
- DSCR +1.2/10.0
$799,999
🖨 Deal sheet (PDF) 📄 Offer letter ✓ Due diligence
Listing remarks
Nestled in one of Brooklyn’s most sought-after locations, this bright and peaceful true 2-bedroom, 1-bath home offers the perfect blend of charm and comfort. Featuring high ceilings, stunning wood-framed windows, and rich hardwood floors, this residence exudes warmth and elegance. Ample closet space complements the modern pass-thru windowed kitchen, which boasts marble countertops, stainless steel appliances, and a convenient breakfast counter. Situated on the top floor of a well-maintained walk-up building with a blonde brick façade, this home offers delightful architectural details, including decorative tiles. Residents enjoy the convenience of a live-in superintendent, on-si
Key facts
- 2-bedroom
- 1-bath home
- Wood-framed windows
Tags
Property features AI
Finance
- Financial info: Financing available: Bank mortgage, cash; exchange considered; 20% down payment typically required
- HOA & community: Monthly maintenance/common fee of $385; Managed by 145 Prospect Park Condo (manager phone available)
Exterior
- Parking: Street parking
- Utilities: Public water; Public sewer
- Home design: Attached building; Residential unit on the 4th floor
- Exterior features: Street parking
Interior
- Kitchen: Dishwasher, Microwave, Refrigerator, Stove
- Bedrooms: Two bedrooms on the first floor
- Flooring: Ceramic floors; Hardwood floors; Tile floors
- Bathrooms: One full bathroom on the first floor
- Interior features: Dishwasher; Microwave; Refrigerator; Stove; Terrace; One AC unit
Neighborhood map
What this means for you Summary
Snapshot
- This is a 2-bed/1.0-bath condo listed at $800k.
Deal economics
- At list price, monthly cash flow is $-1k ($-14k/yr) — negative.
- To cash-flow at today's rent, offer at most $589k (26.4% below list).
- To meet the 1% rule (rent ≥ 1% of price), the offer needs to be $521k (34.9% below list).
- Recommended offer: $521k (34.9% below list) — sets the bar for 1% rule.
- Cap rate 4.5% vs local median 2.6% in New York — top-decile yield for the area; either an underpriced asset or a hidden risk that comps aren't pricing in. Stress-test before assuming the spread holds.
Location & tenants
- Location reads 75/100 on livability (#268 in NY, #4,188 nationally) — a middle-class / working-renter tenant base. Strengths: amenities A+, commute A+, health & safety A; Watch: crime F, cost of living F.
- Zoned schools: Elm Tree Elementary School (math 27% / reading 52%, grade F, #1,444 of 2,108 statewide, top 71%, 806 students, 94% FRL); Ms 51 William Alexander (math 67% / reading 92%, grade A+, #32 of 729 statewide, top 5%, 1,026 students, 61% FRL); Midwood High School (math 94% / reading 96%, grade A+, #83 of 1,100 statewide, top 8%, 4,062 students, 73% FRL).
- Market conditions: Rents rising fast (+5.7%/yr); 250 active listings in the ZIP; 8 comparable units currently listed for rent nearby; rentals leasing fast (median 7d on market — plan ~1-2 weeks tenant-placement turnaround); high-income renter base; 10,063 units permitted in Kings County in 2024 (9,789 in 5+ unit buildings).
- This rent runs 34% of the median local income ($186k/yr) — at the standard rent-burdened threshold; future hikes will face affordability resistance.
Forward outlook
- In year one you build about $86k of equity ($6k loan paydown + $80k appreciation (10.0% local appreciation)).
- Kings County population projected at +13% by 2050 — modest demand growth; plan on rents tracking national, not racing it.
- By year 2, paydown + projected appreciation supports a ~$137k cash-out refi (75% LTV) — recoverable capital for the next deal without selling this one.
Negotiation context
- It's been on market 378 days — a 12% lower offer ($704k) is reasonable based on typical stale-listing flexibility.
- 4 sale attempts since 8y ago; this cycle's ask has dropped $49k (6%) from the opening price — seller is motivated, your offer sets the floor, not the list.
Risks & watch-outs
- Climate carrying-cost: major wind risk, 65% chance of damaging wind over 30y; extreme-heat days projected 7→14/yr by 2055 (HVAC capex compounding) — expect insurance premiums to compound above CPI over the hold.
Questions for the listing agent
- What do current leases actually rent for vs. the listed asking? Can we see a recent rent roll and the last 12 months of T-12 income?
- It's been on market 378 days. Have you received any prior offers? Is the seller open to a 35% concession, seller financing, or rate buy-down credit?
- Any open or pending special assessments — roof, HVAC, plumbing, elevator, façade? What's the per-unit balance and payoff schedule, and is the seller paying it off at close or rolling it to the buyer?
- Why hasn't it sold? Are there any deal-killer items the seller is aware of (foundation, flood, title, zoning, code violations)?
- Is there a deadline driving the sale (1031 exchange, divorce, estate, relocation)? That informs how much negotiation room exists.
- Schools are B-rated — typically a magnet for longer-tenancy family renters. What's the average tenant stay here, and is there a school-zone premium baked into asking?
- Crime grade is F in this area — have there been break-ins, vandalism, or insurance claims at this property in the last 3 years? What carrier currently insures it and at what premium?
- The area grade is low — what's the realistic commute time and amenity access for the typical tenant pool here? Any planned neighborhood developments (good or bad) we should know about?
- What's the average days-on-market for RENTAL listings here right now (not sales)? A rising rental-DOM trend means longer vacancies and softer asking-rent achievability than the comps imply.
- What's the recent tenant-quality profile in this submarket — average credit score on applications, eviction rate, late-payment / NSF rate, and stable-employment percentage? A property-management company in the area should have these aggregated.
- How much new apartment / multifamily construction is in the pipeline within 1–3 miles? Heavy new supply (>2% of stock underway) typically softens rents 12–24 months out; light construction supports rent growth.
Investment metrics
- 1% rule
- 0.65% ✗
- Cap rate
- 4.50%
- Cash-on-cash
- -6.40%
- DSCR
- 0.72
- GRM
- 12.8
CMA / ARV
No comps found within radius.
Projected returns pro-forma
10.0% appreciation · 5.67% rent growth · sell at horizon
- IRR
- 20.4%
- Equity multiple
- 2.67×
- Total profit
- $373,928
- Equity at exit
- $720,702
- IRR
- 19.2%
- Equity multiple
- 6.33×
- Total profit
- $1,193,360
- Equity at exit
- $1,554,222
Cash invested: $224,000 (down + closing). Projections, not guarantees.
Landlord ↔ Tenant lean methodology
- Overall (CITY)
- 0 Strongly Tenant-Friendly
- State New York
- 15 Strongly Tenant-Friendly · D+10
- County
- — inherits STATE
- City New York
- 0 Strongly Tenant-Friendly · D+34
ZIP-level market 11215
- Home prices YoY
- 2.7%
- Rents YoY
- 5.7%
- Active inventory
- 250
- Price-to-rent
- 12.8×
Monthly cashflow live
- Estimated rent
- $5,210 high interval (Pro) →
- Mortgage (P&I)
- −$4,195
- Tax from tax record
- −$782 /mo · $9,381/yr
- Insurance
- −$333
- HOA
- −$0
- Vacancy / Maint / Mgmt
- −$1,094
- Net cashflow
- $-1,195
Break-even live
Sensitivity live
| Price | -10% $-742 | -5% $-968 | +0% $-1,195 | +5% $-1,421 | +10% $-1,647 |
|---|---|---|---|---|---|
| Rent | -10% $-1,606 | -5% $-1,400 | +0% $-1,195 | +5% $-989 | +10% $-783 |
| Rate | -1.0pp $-792 | -0.5pp $-991 | base $-1,195 | +0.5pp $-1,402 | +1.0pp $-1,613 |
UW: 25.0% down · 7.5% · 30yr · 1.5% tax · 5.0% vac · 8.0% maint · 8.0% mgmt
Financing live
Cash to close
- Down payment
- $200,000
- Closing costs
- $24,000
- Reserves months
- —
- Total cash needed
- —
Loan-product check · same deal, 3 products live
Conventional
25% down · 7.5% · 30yr
- Down + closing
- —
- Monthly P&I
- —
- Monthly cashflow
- —
- DSCR
- —
- Eligible?
- —
Personal DTI + credit; lowest rate.
DSCR
20% down · 8.5% · 30yr
- Down + closing
- —
- Monthly P&I
- —
- Monthly cashflow
- —
- DSCR
- —
- Eligible?
- —
No personal income docs; deal must DSCR.
Hard money
10% down · 12.0% · 12mo
- Down + closing
- —
- Monthly P&I
- —
- Monthly cashflow
- —
- DSCR
- —
- Eligible?
- —
Short-term bridge; refi at stabilization.
Rent comps 8 comps
| Address | Beds | Baths | Sqft | Rent | $/sqft | DOM | Units | Dist |
|---|---|---|---|---|---|---|---|---|
| 655 Union St #1846 Brooklyn, NY | 1.0–2.0 | 1.0–2.0 | 727 | $7,810 | $10.74 | 4d | 2 | 1.00mi |
| 755 Washington Ave Brooklyn, NY | 1.0 | 1.0 | 700 | $1,800 | $2.57 | 22d | 1 | 1.02mi |
| 461 Dean St Brooklyn, NY | 1.0 | 1.0 | 781 | $5,320 | $6.81 | 6d | 5 | 1.25mi |
| 552 Prospect Pl Unit 3A Brooklyn, NY | 1.0 | 1.0 | 676 | $4,500 | $6.66 | 26d | 1 | 1.26mi |
| 22 Tehama St Unit 2 Fl Brooklyn, NY | 2.0 | 1.0 | 700 | $2,980 | $4.26 | 26d | 1 | 1.34mi |
| 545 Vanderbilt Ave Brooklyn, NY | 2.0 | 1.0 | 600 | $6,280 | $10.47 | 4d | 3 | 1.36mi |
| 475 Clermont Ave Brooklyn, NY | 2.0 | 1.0–2.0 | 807 | $6,596 | $8.17 | 0d | 6 | 1.41mi |
| 151 S Elliott Pl Brooklyn, NY | 1.0–2.0 | 1.0–2.0 | 655 | $6,380 | $9.74 | 3d | 2 | 1.43mi |
HOA detail condo
- Monthly dues
- $0 · $0/yr
- Assessments
- None detected in remarks — confirm with the listing agent.
Listing history 21 events
-
2026-06-21days on market $799,999 Active 378 DOM
-
2026-06-18days on market $799,999 Active 375 DOM
-
2026-06-17days on market $799,999 Active 374 DOM
-
2026-06-15days on market $799,999 Active 372 DOM
-
2026-06-13days on market $799,999 Active 370 DOM
-
2026-06-10days on market $799,999 Active 366 DOM
-
2026-06-08days on market $799,999 Active 365 DOM
-
2026-06-03days on market $799,999 Active 360 DOM
-
2026-06-01days on market $799,999 Active 358 DOM
-
2026-05-31days on market $799,999 Active 357 DOM
-
2025-07-29price $799,999
-
2025-06-08$849,000 Active
-
2025-04-28price $875,000
-
2018-08-09historical Permanently Off Market
-
2018-08-07soldstatus $699,000
-
2018-08-02soldstatus $699,000
-
2018-06-29status Contract Signed
-
2018-06-09historical Permanently Off Market
-
2018-04-26price $699,000
-
2018-03-12$749,000 Active
-
2018-03-12$699,000
ⓘ Source: listings_history table (triggers on properties + properties_extension) + one-shot
backfill from property_details.listing_events for pre-trigger history.
Tax reassessment forecast NY · Partial reset (capped growth)
- Current annual tax
- $9,381 · $782/mo
- Projected year-2 tax
- $11,450 · $954/mo
- Expected delta
- +$2,070/yr (+$172/mo · 22.1%)
ⓘ Screening estimate from a state-policy table — verify with the county assessor before closing.
Climate risk First Street
- Flood 1/10 Low FEMA zone X (unshaded) · 0% chance over 30 yrs
- Wildfire 2/10 Low
- Heat 6/10 Major 7 d/yr ≥99°F today · 14 d/yr by 30 yrs out
- Wind 6/10 Major 65% chance of damaging wind over 30 yrs
- Air quality 4/10 Moderate 5 unhealthy d/yr today · 7 by 30 yrs out
Nearby sold comps map
Loading sold comps map…
Walkable amenities ~0.75 mi
Loading nearby amenities…
Taxation est. · year 1
- Rental income
- $62,517
- − Mortgage interest
- −$44,812
- − Property taxes
- −$9,381
- − Insurance
- −$4,000
- − Repairs & maintenance
- −$5,001
- − Management
- −$5,001
- − Depreciation
- −$23,273
- Taxable loss
- −$28,951
- Est. tax savings @ 24.0%
- +$6,948
- After-tax cash flow
- $-7,387/yr
For passive investors: Depreciation is non-cash, so a rental often shows a tax loss while cash-flowing — sheltering income. Rental losses are passive: they offset passive income freely, and up to $25,000/yr can offset ordinary (W-2) income if you actively participate and your MAGI is under $100k (phasing out to $0 by $150k); unused losses carry forward. On sale, claimed depreciation is recaptured at up to 25%, and gains may owe capital-gains tax (a 1031 exchange can defer both). Figures are a year-1 estimate at your 24.0% rate — not tax advice; consult a CPA.
Schools (NCES district)
No district data.
Livability — New York
- Score
- 75/100
- State rank
- #268
- US rank
- #4188
Category grades
Schools grade is shown separately in the Schools card above.
Census & demographics
- Census place
- New York, NY
- County
- Kings County · 2,614,986 people
- City population
- 7,731,280
- Metro
- New York-Newark-Jersey City, NY-NJ-PA
- Population (ZIP)
- 70,441
- Household income
- $185,865
- Rent vs Own
- Severe rent burden
- 2372.0
Population outlook (Kings County) Hauer SSP2
- Today (2025)
- 2,847,441 people
- By 2030
- 2,937,006 · +3.1%
- By 2040
- 3,095,491 · +8.7%
- By 2050
- 3,228,968 · +13.4%
- By 2075
- 3,321,723 · +16.7%
- By 2100
- 3,111,387 · +9.3%
Race, ethnicity, and origin ACS 2023
- Neighborhood character
- Predominantly White (67%)
- Race & ethnicity
- White 67% Hispanic / Latino 15% Two or more races 11% Asian 9% Black 3%
- Hispanic origin (detail)
- Mexican 3% Puerto Rican 3%
- Common ancestry
- Romanian 5% Scotch-Irish 5% Italian 3%
- Foreign-born
- 18% · Canada, China, Jamaica
- Languages at home
- 76% English-only · Spanish 9% Other Indo-European 4% Chinese 2%
Political lean MEDSL · Kings
- 2024 margin
- Solid D (+44.0) · D 72.0% · R 28.0%
- 2008→2024 swing
- -15.5pp toward R · 2008: 59.4pp · 2024: 44.0pp
- All cycles
- 2024: D+44.0 2020: D+54.8 2016: D+61.8 2012: D+63.9 2008: D+59.4
Not yet ingested
- Civics
- —
Market trends
- HPI YoY
- ▲ 11.03%
- Current HPI
- 417.4151
- Rent YoY
- ▲ 5.67%
- Metro
- New York-Newark-Jersey City, NY-NJ-PA
- State GDP YoY
- ▲ 2.60%
- F500 in state
- 92
Industry mix (Fortune 500 HQ in NY)
| Industry | F500 HQs | Revenue |
|---|---|---|
| Financial Services | 10 | $950B |
|
||
| Consumer Goods | 9 | $162B |
|
||
| Insurance | 4 | $225B |
|
||
| Telecommunications | 2 | $144B |
|
||
| Pharmaceuticals | 2 | $112B |
|
||
| Media / Entertainment | 2 | $69B |
|
||
Price history
+6.8% since first listed11 events — show timeline
- 2025-07-29 Price Changed $799,999 BNYMLS
- 2025-06-08 Listed $849,000 BNYMLS
- 2025-04-28 Price Changed $875,000 RLS at REBNY
- 2018-08-09 Delisted — RLS at REBNY
- 2018-08-07 Sold (Public Records) $699,000 Public Records
- 2018-08-02 Sold (MLS) $699,000 RLS at REBNY
- 2018-06-29 Relisted — RLS at REBNY
- 2018-06-09 Delisted — RLS at REBNY
- 2018-04-26 Price Changed $699,000 RLS at REBNY
- 2018-03-12 Listed $699,000 RLS at REBNY
- 2018-03-12 Listed $749,000 RLS at REBNY
Property tax history
+16.8%/yrLatest (2024): $9,381 · +4.2% YoY. Source: county tax records.
Cash-flow waterfall
monthlySold comps — $/sqft
last 12 mo · ≤1 miLoading sold comps…