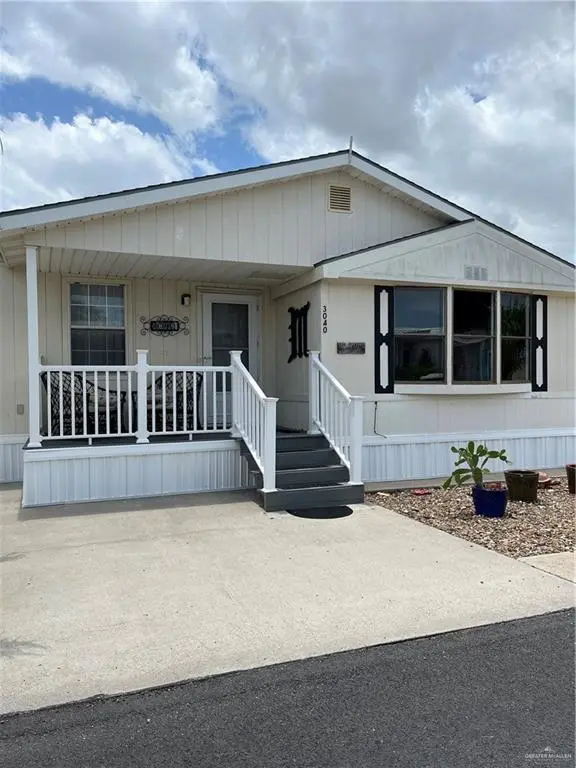
3040 Boca Chica Dr · Llano Grande, TX
Flood risk 3/10 · Minor
- FEMA flood zone
- X (shaded)
- Chance of flooding over 30 yrs
- 0.2%
- Est. flood insurance / yr
- $507 – $1,088
Fire risk 5/10 · Moderate
- Est. fire insurance / yr
- $1,222 – $2,270
Heat risk 9/10 · Severe
- Hot days now (above 110°F)
- 7 days/yr
- Hot days in 30 yrs
- 22 days/yr
Wind risk 8/10 · Major
- Chance of severe wind over 30 yrs
- 99.0%
Air-quality risk 1/10 · Minimal
- Unhealthy air days now
- 0 days/yr
- Unhealthy air days in 30 yrs
- 0 days/yr
Risk factors via First Street. Map © Google.
Why this score? — see what drove the C- grade
The composite is a weighted blend of 9 inputs, each scored 0–100. Each bar is that input's sub-score; the figure is the points it added to the 100-point composite (weight × sub-score).
- Cash flow +18.9/30.0
- ARV discount +7.5/15.0
- DSCR +6.0/10.0
- 1% rule +5.1/10.0
- Appreciation +4.7/10.0
- Livability +2.8/5.0
- Rent growth +2.5/5.0
- Condition / age +2.5/5.0
- Schools +2.2/10.0
$135,000
🖨 Deal sheet 📄 Offer letter ✓ Due diligence
Listing remarks
Spacious 3 bedroom, 2 1/2 bath mobile home, which includes the lot. The kitchen has been updated. The hall bath shower has been upgraded to a nice walk-in shower. The kitchen is located at the front for a nice street view. The property comes mostly furnished. Lots of natural light, which includes a sky light. The side of the mobile has been added on with another bedroom and half bath. There is a nice, covered patio on the back of the mobile. The one car garage is attached. Schedule your showing today.
Key facts
- Added bedroom
- Added half bath
- Natural light
Tags
Property features AI
Finance
- Other: Living area source: HidalgoCAD
- HOA & community: Mandatory association (Siesta Village); Annual association fee $750; POA transfer fee $200; Community pool; Senior community
Exterior
- Parking: Attached garage (1 car); 1 covered parking space; Total of 1 parking space
- Utilities: City sewer; Electric utilities
- Home design: Single-family property; Entry from street
- Construction: Shingle roof; Crawl space foundation; Other construction materials; Building area about 1,400
- Exterior features: Patio; Paved road access; Own lot (45 x 100)
Interior
- Kitchen: Stove/Range
- Flooring: Laminate
- Bathrooms: 2 full bathrooms; 1 half bathroom
- Heating & cooling: Central heating; Central air conditioning
- Interior features: Laminate flooring; Countertops (other); Ceiling fans; Mini blinds
- Laundry & utility: Washer and dryer included; Washer/Dryer connection; Electric water heater
Neighborhood map
What this means for you Summary
Snapshot
- This is a 3-bed/2.5-bath manufactured listed at $135k.
Deal economics
- At list price, monthly cash flow is $138 ($2k/yr) — positive.
- The deal already cash-flows at list — no discount required.
- Meets the 1% rule at list price ($1k rent vs $135k).
- Recommended offer: $133k (1.5% below list) — sets the bar for market timing.
Location & tenants
- Location reads 56/100 on livability (#1,288 in TX) — a working-class tenant base; expect higher turnover. Strengths: cost of living A+, housing A-, crime B; Watch: amenities F, commute F, employment F.
- Weslaco ISD (suburban): math 23% / reading 31% proficiency, ranked #705 of 826 in TX (top 85%) — low school quality limits family demand, transient renter base, plan for 1-2y turnover.
- Zoned schools: Dr R E Margo El (math 17% / reading 22%, grade F, #3,583 of 4,322 statewide, top 86%, 914 students, 87% FRL); Armando Cuellar Middle (math 22% / reading 31%, grade F, #1,200 of 1,662 statewide, top 73%, 626 students, 88% FRL); Weslaco East H S (math 24% / reading 26%, grade F, #1,250 of 1,632 statewide, top 77%, 2,004 students, 86% FRL) — zoned schools average 87% FRL vs 59% district-wide (27 pts higher); higher-poverty schools than district average — tighter screening recommended.
- Market conditions: 708 active listings in the ZIP; 17 comparable units currently listed for rent nearby; rentals lingering (median 44d on market — plan ~5-8 weeks vacancy on turnover, expect pricing pressure); 100% of comp listings sitting > 30 days — soft ceiling on asking rent; 7,378 units permitted in Hidalgo County in 2024 (641 in 5+ unit buildings).
Forward outlook
- In year one you build about $144 of equity ($933 loan paydown + $-789 appreciation (-0.6% local appreciation)).
- Hidalgo County population projected at +28% by 2050 — long-run rental-demand tailwind backs the buy-and-hold thesis.
- At projected returns (-0.6% appreciation + 3.0% rent growth), your $38k cash investment doubles in ~10 years — after that, you're playing with house money.
Negotiation context
- It's been on market 25 days — a 2% lower offer ($133k) is reasonable based on typical stale-listing flexibility.
Risks & watch-outs
- Climate carrying-cost: severe wind risk, 99% chance of damaging wind over 30y; moderate wildfire risk; extreme-heat days projected 7→22/yr by 2055 (HVAC capex compounding) — expect insurance premiums to compound above CPI over the hold.
Questions for the listing agent
- What does the HOA fee cover, when was the last increase, and are there any pending special assessments or reserve-fund shortfalls?
- Is there a deadline driving the sale (1031 exchange, divorce, estate, relocation)? That informs how much negotiation room exists.
- Schools are F-rated, which usually means shorter tenancies and higher turnover. Who's the typical renter profile here, and what's been the actual vacancy rate?
- What's the average days-on-market for RENTAL listings here right now (not sales)? A rising rental-DOM trend means longer vacancies and softer asking-rent achievability than the comps imply.
- What's the recent tenant-quality profile in this submarket — average credit score on applications, eviction rate, late-payment / NSF rate, and stable-employment percentage? A property-management company in the area should have these aggregated.
- How much new for-sale + rental construction is in the pipeline within 1–3 miles? Heavy new supply typically softens prices + rents 12–24 months out; constrained supply supports both.
Investment metrics
- 1% rule
- 1.01% ✓
- Cap rate
- 7.52%
- Cash-on-cash
- 4.39%
- DSCR
- 1.20
- GRM
- 8.2
CMA / ARV
- ARV (on-the-fly)
- $88,708
- Comps found
- 6
Show comp detail 6 sales within ~0.75 mi
| Address | Dist | Beds/Ba | Sqft | Sold | Price | $/sf | Match |
|---|---|---|---|---|---|---|---|
| 3102 Palmetto Dr | 0.09mi | 2/2.0 (-1) | 1,350 (+2%) | 2mo | $59,900 | $44 | 84 |
| 2808 Mesa Verde Dr | 0.18mi | 3/2.0 | 1,372 (+4%) | 3mo | $69,500 | $51 | 81 |
| 3020 Sonora Dr | 0.14mi | 2/2.0 (-1) | 1,372 (+4%) | 15mo | $130,000 | $95 | 68 |
| 2929 San Jose Dr | 0.22mi | 2/2.0 (-1) | 1,454 (+10%) | 5mo | $98,000 | $67 | 62 |
| 3124 Palmetto Dr | 0.11mi | 2/2.0 (-1) | 1,212 (-8%) | 14mo | $85,900 | $71 | 62 |
| 2717 Mesa Verde Dr | 0.24mi | 2/1.5 (-1) | 1,158 (-12%) | 24mo | $60,000 | $52 | 39 |
Match score weights: distance 35% · size 25% · config 20% · recency 20%. Top-matched comps best support the ARV.
Projected returns pro-forma
-0.58% appreciation · 3.0% rent growth · sell at horizon
- IRR
- 0.7%
- Equity multiple
- 1.03×
- Total profit
- $1,224
- Equity at exit
- $35,302
- IRR
- 6.8%
- Equity multiple
- 1.69×
- Total profit
- $26,196
- Equity at exit
- $39,438
Cash invested: $37,800 (down + closing). Projections, not guarantees.
Landlord ↔ Tenant lean methodology
- Overall (STATE)
- 87 Strongly Landlord-Friendly
- State Texas
- 87 Strongly Landlord-Friendly · R+5
- County
- — inherits STATE
- City
- — inherits STATE
ZIP-level market 78596
- Home prices YoY
- -0.2%
- Active inventory
- 708
- Price-to-rent
- 8.2×
Monthly cashflow live
- Estimated rent
- $1,368 high interval (Pro) →
- Mortgage (P&I)
- −$708
- Tax from tax record
- −$115 /mo · $1,378/yr
- Insurance
- −$56
- HOA
- −$63
- Vacancy / Maint / Mgmt
- −$287
- Net cashflow
- $138
Break-even live
UW: 25.0% down · 7.5% · 30yr · 1.5% tax · 5.0% vac · 8.0% maint · 8.0% mgmt
Financing live
Cash to close
- Down payment
- $33,750
- Closing costs
- $4,050
- Reserves months
- —
- Total cash needed
- —
Loan-product check · same deal, 3 products live
Conventional
25% down · 7.5% · 30yr
- Down + closing
- —
- Monthly P&I
- —
- Monthly cashflow
- —
- DSCR
- —
- Eligible?
- —
Personal DTI + credit; lowest rate.
DSCR
20% down · 8.5% · 30yr
- Down + closing
- —
- Monthly P&I
- —
- Monthly cashflow
- —
- DSCR
- —
- Eligible?
- —
No personal income docs; deal must DSCR.
Hard money
10% down · 12.0% · 12mo
- Down + closing
- —
- Monthly P&I
- —
- Monthly cashflow
- —
- DSCR
- —
- Eligible?
- —
Short-term bridge; refi at stabilization.
Rent comps 17 comps
| Address | Beds | Baths | Sqft | Rent | $/sqft | DOM | Units | Dist |
|---|---|---|---|---|---|---|---|---|
| 2801 Laquinta Weslaco, TX | 2.0 | 1.0 | 984 | $1,350 | $1.37 | 43d | 1 | 0.15mi |
| 2004 Ginger Ave Weslaco, TX | 3.0 | 2.0 | 1332 | $1,600 | $1.20 | 43d | 1 | 0.62mi |
| 2101 Brightwood Ave Weslaco, TX | 3.0 | 2.0 | 1494 | $1,750 | $1.17 | 44d | 1 | 0.62mi |
| 2016 Brightwood Ave Weslaco, TX | 4.0 | 2.0 | 1646 | $2,350 | $1.43 | 43d | 1 | 0.63mi |
| 1635 Playa Dr Unit 1 Weslaco, TX | 2.0 | 2.0 | 988 | $1,095 | $1.11 | 43d | 1 | 0.74mi |
| 1630 Playa Dr Unit 1 Weslaco, TX | 2.0 | 2.0 | 935 | $1,095 | $1.17 | 43d | 1 | 0.74mi |
| 1603 Playa Dr Unit 3 Weslaco, TX | 2.0 | 2.0 | 1100 | $1,150 | $1.05 | 43d | 1 | 0.85mi |
| 1511 Playa Dr Unit 2 Progreso Lakes, TX | 3.0 | 2.0 | 987 | $1,250 | $1.27 | 43d | 1 | 0.87mi |
| 3808 Las Vistas Ln Unit 1 Weslaco, TX | 2.0 | 2.0 | 928 | $1,100 | $1.19 | 43d | 1 | 1.01mi |
| 1416 Alta Vista Dr Apt 1 Progreso Lakes, TX | 2.0 | 2.0 | 985 | $1,025 | $1.04 | 43d | 1 | 1.01mi |
| 3918 Las Vistas Ln Unit 4 Weslaco, TX | 2.0 | 2.0 | 1061 | $1,125 | $1.06 | 43d | 1 | 1.02mi |
| 3921 Las Vistas Ln Weslaco, TX | 2.0 | 2.0 | 1067 | $1,050 | $0.98 | 43d | 1 | 1.03mi |
| 1413 Alta Vista Dr Unit 4 Progreso Lakes, TX | 3.0 | 2.0 | 1087 | $1,150 | $1.06 | 43d | 1 | 1.04mi |
| 1404 Alta Vista Dr Unit 3 Progreso Lakes, TX | 2.0 | 2.0 | 985 | $1,075 | $1.09 | 43d | 1 | 1.05mi |
| 3814 Bella Costa Dr Unit 2 Weslaco, TX | 3.0 | 2.0 | 1087 | $1,175 | $1.08 | 43d | 1 | 1.06mi |
| 189 Lago Vista St Mercedes, TX | 2.0 | 2.0 | 1164 | $2,000 | $1.72 | 43d | 1 | 1.26mi |
| 609 Buena Vista Dr Apt 1 Weslaco, TX | 2.0 | 2.0 | 888 | $750 | $0.84 | 43d | 1 | 1.46mi |
HOA detail
- Monthly dues
- $63 · $756/yr
Listing history 17 events
-
2026-06-18days on market $135,000 Active 25 DOM
-
2026-06-17days on market $135,000 Active 24 DOM
-
2026-06-16days on market $135,000 Active 23 DOM
-
2026-06-15days on market $135,000 Active 22 DOM
-
2026-06-15days on market $135,000 Active 21 DOM
-
2026-06-13days on market $135,000 Active 20 DOM
-
2026-06-12days on market $135,000 Active 19 DOM
-
2026-06-09days on market $135,000 Active 16 DOM
-
2026-06-08days on market $135,000 Active 15 DOM
-
2026-06-08days on market $135,000 Active 14 DOM
-
2026-06-07days on market $135,000 Active 13 DOM
-
2026-06-03days on market $135,000 Active 10 DOM
-
2026-06-02days on market $135,000 Active 9 DOM
-
2026-06-01days on market $135,000 Active 8 DOM
-
2026-05-31days on market $135,000 Active 7 DOM
-
2026-05-23$135,000 Active
-
2022-05-23soldstatus
ⓘ Source: listings_history table (triggers on properties + properties_extension) + one-shot
backfill from property_details.listing_events for pre-trigger history.
Tax reassessment forecast TX · Resets to sale price
- Current annual tax
- $1,378 · $115/mo
- Projected year-2 tax
- $2,470 · $206/mo
- Expected delta
- +$1,093/yr (+$91/mo · 79.3%)
ⓘ Screening estimate from a state-policy table — verify with the county assessor before closing.
Climate risk First Street
- Flood 3/10 Moderate FEMA zone X (shaded) · 20% chance over 30 yrs
- Wildfire 5/10 Major
- Heat 9/10 Extreme 7 d/yr ≥110°F today · 22 d/yr by 30 yrs out
- Wind 8/10 Severe 99% chance of damaging wind over 30 yrs
- Air quality 1/10 Low 0 unhealthy d/yr today · 0 by 30 yrs out
Nearby sold comps map
Loading sold comps map…
Walkable amenities ~0.75 mi
Loading nearby amenities…
Taxation est. · year 1
- Rental income
- $16,410
- − Mortgage interest
- −$7,562
- − Property taxes
- −$1,378
- − Insurance
- −$675
- − Repairs & maintenance
- −$1,313
- − Management
- −$1,313
- − HOA
- −$756
- − Depreciation
- −$3,927
- Taxable loss
- −$513
- Est. tax savings @ 24.0%
- +$123
- After-tax cash flow
- $1,783/yr
For passive investors: Depreciation is non-cash, so a rental often shows a tax loss while cash-flowing — sheltering income. Rental losses are passive: they offset passive income freely, and up to $25,000/yr can offset ordinary (W-2) income if you actively participate and your MAGI is under $100k (phasing out to $0 by $150k); unused losses carry forward. On sale, claimed depreciation is recaptured at up to 25%, and gains may owe capital-gains tax (a 1031 exchange can defer both). Figures are a year-1 estimate at your 24.0% rate — not tax advice; consult a CPA.
Schools (NCES district)
- District
- Weslaco ISD
- NCES district ID
- 4844960
- Math proficiency
- 23% ▼ -29.00%
- Reading proficiency
- 31% ▼ -9.00%
- Median HH income
- $32,867
- Composite
- 22.05/100
- National rank
- #8196
- State rank
- #705 of 826 in TX
Livability — Llano Grande
- Score
- 56/100
- State rank
- #1288
- US rank
- #22408
Category grades
Schools grade is shown separately in the Schools card above.
Census & demographics
- Census place
- Llano Grande, TX
- Population (ZIP)
- 38,942
Population outlook (Hidalgo County) Hauer SSP2
- Today (2025)
- 955,232 people
- By 2030
- 1,009,774 · +5.7%
- By 2040
- 1,120,332 · +17.3%
- By 2050
- 1,225,036 · +28.2%
- By 2075
- 1,439,189 · +50.7%
- By 2100
- 1,533,429 · +60.5%
Race, ethnicity, and origin ACS 2023
- Neighborhood character
- Predominantly Hispanic (86%)
- Race & ethnicity
- Hispanic / Latino 86% Two or more races 38% White 13%
- Hispanic origin (detail)
- Mexican 82%
- Common ancestry
- Slovak 1%
- Foreign-born
- 17% · Canada
- Languages at home
- 27% English-only · Spanish 72%
Political lean MEDSL · Hidalgo
- 2024 margin
- Toss-up / Even · D 48.1% · R 51.0%
- 2008→2024 swing
- -41.6pp toward R · 2008: 38.7pp · 2024: -2.9pp
- All cycles
- 2024: R+2.9 2020: D+17.1 2016: D+40.5 2012: D+41.8 2008: D+38.7
Not yet ingested
- Civics
- —
Market trends
- HPI YoY
- ▼ -0.58%
- Current HPI
- 261.5117
- Rent YoY
- —
- Metro
- —
- State GDP YoY
- ▲ 3.95%
- F500 in state
- 110
Industry mix (Fortune 500 HQ in TX)
| Industry | F500 HQs | Revenue |
|---|---|---|
| Energy | 16 | $1,198B |
|
||
| Technology | 5 | $198B |
|
||
| Engineering / Construction | 4 | $72B |
|
||
| Energy Services | 3 | $60B |
|
||
| Utilities | 3 | $41B |
|
||
| Healthcare | 2 | $330B |
|
||
Price history
2 events — show timeline
- 2026-05-23 Listed $135,000 MCALLENMLS
- 2022-05-23 Sold (Public Records) — Public Records
Property tax history
+7.6%/yrLatest (2025): $1,378 · -8.5% YoY. Source: county tax records.
Cash-flow waterfall
monthlySold comps — $/sqft
last 12 mo · ≤1 miLoading sold comps…