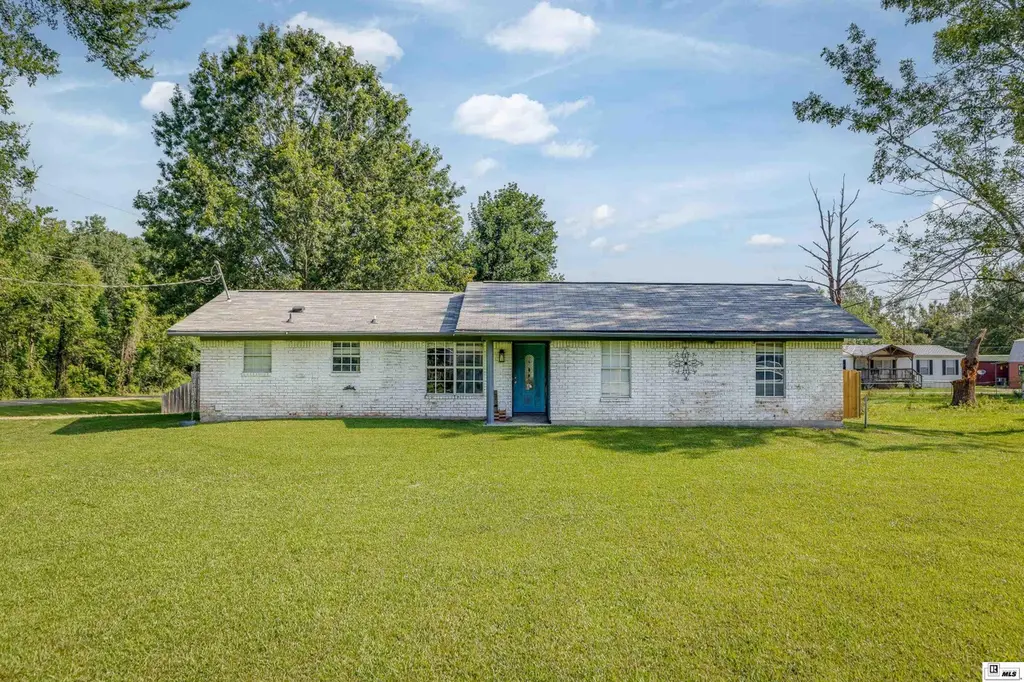
1 Cox Rd · Start, LA
Flood risk 1/10 · Minimal
- FEMA flood zone
- X
- Chance of flooding over 30 yrs
- 0.0%
- Est. flood insurance / yr
- $507 – $1,088
Fire risk 3/10 · Minor
- Est. fire insurance / yr
- $1,269 – $2,357
Heat risk 7/10 · Major
- Hot days now (above 110°F)
- 7 days/yr
- Hot days in 30 yrs
- 20 days/yr
Wind risk 8/10 · Major
- Chance of severe wind over 30 yrs
- 80.0%
Air-quality risk 1/10 · Minimal
- Unhealthy air days now
- 0 days/yr
- Unhealthy air days in 30 yrs
- 0 days/yr
Risk factors via First Street. Map © Google.
Why this score? — see what drove the C grade
The composite is a weighted blend of 9 inputs, each scored 0–100. Each bar is that input's sub-score; the figure is the points it added to the 100-point composite (weight × sub-score).
- Cash flow +26.1/30.0
- DSCR +8.8/10.0
- ARV discount +7.5/15.0
- 1% rule +6.0/10.0
- Livability +3.0/5.0
- Rent growth +2.5/5.0
- Condition / age +2.5/5.0
- Schools +1.4/10.0
- Appreciation +0.0/10.0
$199,900
🖨 Deal sheet 📄 Offer letter ✓ Due diligence
Listing remarks
Welcome home to this beautiful 3 bedroom, 1.5 bath home featuring an inviting floor plan designed for comfortable living. The stunning kitchen is the heart of the home, showcasing custom cabinetry, a stylish backsplash, and stainless steel appliances. Neutral colors throughout create a bright, modern feel, while durable vinyl and tile flooring provide easy maintenance. Situated on a desirable corner lot, this home offers plenty of outdoor space, including a large wood-fenced backyard perfect for pets, play, or gatherings. Step outside and enjoy the covered patio, ideal for relaxing or entertaining. Need extra storage or workspace? The impressive workshop features electricity and a convenien
Key facts
- Custom cabinetry
- Stylish backsplash
- Tile flooring
Tags
Property features AI
Finance
- Other: Directions available: From I-20, take the Start exit and head South. Turn right onto Frost Road, turn left onto Bailey Rd; the house is on the left at the corner of Bailey and Cox Road.
- HOA & community: No association amenities
Exterior
- Parking: 1 garage space; Carport; Open parking
- Utilities: Public water; Sewer: other; Natural gas not available; Electric service
- Home design: Single-family residence (site build); One story; Entry level: 1
- Construction: Brick veneer construction; Asphalt roof; Slab foundation; Built as a site-built single-family home
- Exterior features: Covered patio/porch; Wood fencing; Corner lot; Paved road access; Workshop on property
Interior
- Kitchen: Dishwasher; Microwave; Electric range
- Bedrooms: 3 bedrooms on the main level
- Bathrooms: 1 full bathroom; 1 half bathroom; 2 main-level bathrooms; 1 partial bathroom
- Heating & cooling: Central heating (electric); Central air conditioning (electric); Ceiling fan(s)
- Interior features: Ceiling fan(s); Storm windows
- Laundry & utility: Electric water heater
Neighborhood map
What this means for you Summary
Snapshot
- This is a 3-bed/1.5-bath single-family listed at $200k.
Deal economics
- At list price, monthly cash flow is $506 ($6k/yr) — positive.
- The deal already cash-flows at list — no discount required.
- Meets the 1% rule at list price ($2k rent vs $200k).
Location & tenants
- Location reads 59/100 on livability (#279 in LA) — a working-class tenant base; expect higher turnover. Strengths: cost of living A+; Watch: health & safety D, crime F, amenities F.
- Richland Parish (rural): math 12% / reading 22% proficiency, ranked #73 of 98 in LA (top 74%) — low school quality limits family demand, transient renter base, plan for 1-2y turnover; 76% free/reduced lunch — lower-income household profile, screen leases tightly.
- Zoned schools: Start Elementary School (math 12% / reading 17%, grade F, #516 of 646 statewide, top 82%, 318 students, 56% FRL); Mangham Junior High School (math 19% / reading 35%, grade F, #132 of 218 statewide, top 61%, 211 students, 52% FRL); Rayville High School (math 8% / reading 17%, grade F, #230 of 265 statewide, top 88%, 385 students, 73% FRL) — zoned schools average 60% FRL vs 76% district-wide (15 pts lower); this property's tenant base skews higher-income than the district average.
- Market conditions: 100 active listings in the ZIP; 27 units permitted in Richland Parish in 2024 (0 in 5+ unit buildings).
Forward outlook
- Local home prices are declining (-3.0%/yr); year-one equity from $1k of loan paydown is wiped out by about $6k of value loss. Plan a longer hold.
- Richland County population projected to shrink 9% by 2050 — rents likely to lag national; underwrite the cash flow, not the appreciation.
Negotiation context
- Only 5 days on market — expect competitive offers; lowballing is unlikely to land.
- 5 sale attempts since 14y ago with the ask held roughly flat each time — persistent listings suggest the price (not the market) is what's stuck; bring a comps-based counter.
- Current owner paid $156k; 29% above their basis — modest negotiation headroom, anchor on the comps not their cost.
Risks & watch-outs
- Climate carrying-cost: severe wind risk, 80% chance of damaging wind over 30y; extreme-heat days projected 7→20/yr by 2055 (HVAC capex compounding) — expect insurance premiums to compound above CPI over the hold.
Questions for the listing agent
- Is there a deadline driving the sale (1031 exchange, divorce, estate, relocation)? That informs how much negotiation room exists.
- Crime grade is F in this area — have there been break-ins, vandalism, or insurance claims at this property in the last 3 years? What carrier currently insures it and at what premium?
- What's the average days-on-market for RENTAL listings here right now (not sales)? A rising rental-DOM trend means longer vacancies and softer asking-rent achievability than the comps imply.
- What's the recent tenant-quality profile in this submarket — average credit score on applications, eviction rate, late-payment / NSF rate, and stable-employment percentage? A property-management company in the area should have these aggregated.
- How much new for-sale + rental construction is in the pipeline within 1–3 miles? Heavy new supply typically softens prices + rents 12–24 months out; constrained supply supports both.
Investment metrics
- 1% rule
- 1.10% ✓
- Cap rate
- 9.33%
- Cash-on-cash
- 10.84%
- DSCR
- 1.48
- GRM
- 7.6
CMA / ARV
No comps found within radius.
Projected returns pro-forma
-3.0% appreciation · 3.0% rent growth · sell at horizon
- IRR
- -0.1%
- Equity multiple
- 1.00×
- Total profit
- $-241
- Equity at exit
- $29,806
- IRR
- 9.5%
- Equity multiple
- 1.73×
- Total profit
- $41,015
- Equity at exit
- $17,284
Cash invested: $55,972 (down + closing). Projections, not guarantees.
Landlord ↔ Tenant lean methodology
- Overall (STATE)
- 90 Strongly Landlord-Friendly
- State Louisiana
- 90 Strongly Landlord-Friendly · R+12
- County
- — inherits STATE
- City
- — inherits STATE
ZIP-level market 71269
- Home prices YoY
- -26.4%
- Active inventory
- 100
- Price-to-rent
- 7.6×
Monthly cashflow live
- Estimated rent
- $2,191 medium interval (Pro) →
- Mortgage (P&I)
- −$1,048
- Tax from tax record
- −$93 /mo · $1,119/yr
- Insurance
- −$83
- HOA
- −$0
- Vacancy / Maint / Mgmt
- −$460
- Net cashflow
- $506
Break-even live
UW: 25.0% down · 7.5% · 30yr · 1.5% tax · 5.0% vac · 8.0% maint · 8.0% mgmt
Financing live
Cash to close
- Down payment
- $49,975
- Closing costs
- $5,997
- Reserves months
- —
- Total cash needed
- —
Loan-product check · same deal, 3 products live
Conventional
25% down · 7.5% · 30yr
- Down + closing
- —
- Monthly P&I
- —
- Monthly cashflow
- —
- DSCR
- —
- Eligible?
- —
Personal DTI + credit; lowest rate.
DSCR
20% down · 8.5% · 30yr
- Down + closing
- —
- Monthly P&I
- —
- Monthly cashflow
- —
- DSCR
- —
- Eligible?
- —
No personal income docs; deal must DSCR.
Hard money
10% down · 12.0% · 12mo
- Down + closing
- —
- Monthly P&I
- —
- Monthly cashflow
- —
- DSCR
- —
- Eligible?
- —
Short-term bridge; refi at stabilization.
Listing history 4 events
-
2026-06-09status $199,900 Pending 5 DOM
-
2026-06-08days on market $199,900 Active 5 DOM
-
2026-06-07remarks 699-char remark
-
2026-06-07$199,900 Active 4 DOM
ⓘ Source: listings_history table (triggers on properties + properties_extension) + one-shot
backfill from property_details.listing_events for pre-trigger history.
Tax reassessment forecast LA · Resets to sale price
- Current annual tax
- $1,119 · $93/mo
- Projected year-2 tax
- $1,119 · $93/mo
- Expected delta
- $0/yr ($0/mo · 0.0%)
ⓘ Screening estimate from a state-policy table — verify with the county assessor before closing.
Climate risk First Street
- Flood 1/10 Low FEMA zone X · 0% chance over 30 yrs
- Wildfire 3/10 Moderate
- Heat 7/10 Severe 7 d/yr ≥110°F today · 20 d/yr by 30 yrs out
- Wind 8/10 Severe 80% chance of damaging wind over 30 yrs
- Air quality 1/10 Low 0 unhealthy d/yr today · 0 by 30 yrs out
Nearby sold comps map
Loading sold comps map…
Walkable amenities ~0.75 mi
Loading nearby amenities…
Taxation est. · year 1
- Rental income
- $26,289
- − Mortgage interest
- −$11,198
- − Property taxes
- −$1,119
- − Insurance
- −$1,000
- − Repairs & maintenance
- −$2,103
- − Management
- −$2,103
- − Depreciation
- −$5,815
- Taxable income
- $2,951
- Est. tax owed @ 24.0%
- −$708
- After-tax cash flow
- $5,361/yr
For passive investors: Depreciation is non-cash, so a rental often shows a tax loss while cash-flowing — sheltering income. Rental losses are passive: they offset passive income freely, and up to $25,000/yr can offset ordinary (W-2) income if you actively participate and your MAGI is under $100k (phasing out to $0 by $150k); unused losses carry forward. On sale, claimed depreciation is recaptured at up to 25%, and gains may owe capital-gains tax (a 1031 exchange can defer both). Figures are a year-1 estimate at your 24.0% rate — not tax advice; consult a CPA.
Schools (NCES district)
- District
- Richland Parish
- NCES district ID
- 2201350
- Math proficiency
- 12% ▼ -36.00%
- Reading proficiency
- 22% ▼ -31.00%
- Median HH income
- $36,097
- Composite
- 14.06/100
- National rank
- #9464
- State rank
- #73 of 98 in LA
Livability — Start
- Score
- 59/100
- State rank
- #279
- US rank
- #20272
Category grades
Schools grade is shown separately in the Schools card above.
Census & demographics
- City population
- 68
- Population (ZIP)
- 12,475
Population outlook (Richland County) Hauer SSP2
- Today (2025)
- 20,283 people
- By 2030
- 19,990 · -1.4%
- By 2040
- 19,240 · -5.1%
- By 2050
- 18,497 · -8.8%
- By 2075
- 16,626 · -18.0%
- By 2100
- 14,204 · -30.0%
Race, ethnicity, and origin ACS 2023
- Neighborhood character
- Majority White (60%)
- Race & ethnicity
- White 60% Black 36% Two or more races 3% Hispanic / Latino 2%
- Common ancestry
- Slovak 3% Lithuanian 2% Romanian 1%
- Foreign-born
- 0% · Canada
- Languages at home
- 98% English-only · Spanish 1%
Political lean MEDSL · Richland
- 2024 margin
- Solid R (+39.4) · D 29.7% · R 69.1% · Other 1.2%
- 2008→2024 swing
- -12.8pp toward R · 2008: -26.6pp · 2024: -39.4pp
- All cycles
- 2024: R+39.4 2020: R+34.0 2016: R+32.6 2012: R+28.2 2008: R+26.6
Not yet ingested
- Civics
- —
Market trends
- HPI YoY
- ▼ -56.82%
- Current HPI
- 158.2193
- Rent YoY
- —
- Metro
- —
- State GDP YoY
- ▲ 3.29%
- F500 in state
- 10
Industry mix (Fortune 500 HQ in LA)
| Industry | F500 HQs | Revenue |
|---|---|---|
| Telecommunications | 2 | $23B |
|
||
| Utilities | 1 | $12B |
|
||
| Wholesale / Distribution | 1 | $5B |
|
||
| Advertising | 1 | $2B |
|
||
Price history
+122.4% since first listed11 events — show timeline
- 2026-06-03 Listed $199,900 NELABOR
- 2023-09-01 Sold (Public Records) $155,500 Public Records
- 2023-08-31 Sold (MLS) — NELABOR
- 2023-08-08 Pending — NELABOR
- 2023-08-04 Listed $149,900 NELABOR
- 2021-11-18 Sold (Public Records) $131,500 Public Records
- 2021-11-15 Sold (MLS) — NELABOR
- 2021-09-15 Listed $129,000 NELABOR
- 2018-03-21 Sold (Public Records) $82,700 Public Records
- 2013-05-10 Listed $85,500 NELABOR
- 2012-09-19 Listed $89,900 NELABOR
Property tax history
+5.1%/yrLatest (2025): $1,119 · -1.1% YoY. Source: county tax records.
Cash-flow waterfall
monthlySold comps — $/sqft
last 12 mo · ≤1 miLoading sold comps…