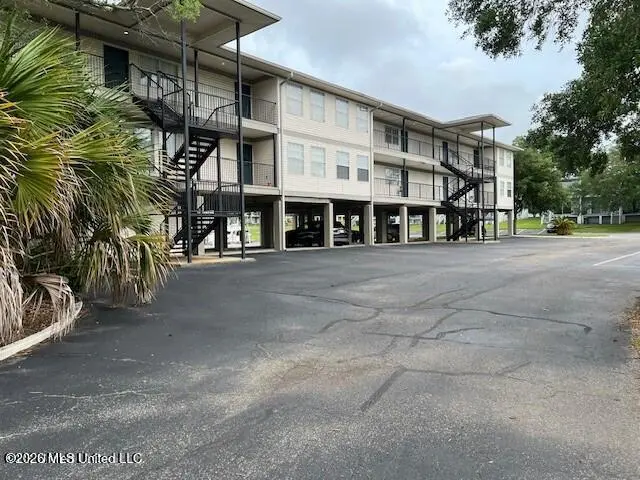
3230 Cumberland (213) Rd #213 · Ocean Springs, MS
Flood risk 9/10 · Severe
- FEMA flood zone
- X
- Chance of flooding over 30 yrs
- 0.99%
- Est. flood insurance / yr
- $507 – $1,088
Fire risk 4/10 · Minor
- Est. fire insurance / yr
- $1,241 – $2,305
Heat risk 10/10 · Severe
- Hot days now (above 107°F)
- 7 days/yr
- Hot days in 30 yrs
- 23 days/yr
Wind risk 9/10 · Severe
- Chance of severe wind over 30 yrs
- 99.0%
Air-quality risk 2/10 · Minimal
- Unhealthy air days now
- 1 days/yr
- Unhealthy air days in 30 yrs
- 2 days/yr
Risk factors via First Street. Map © Google.
Why this score? — see what drove the C- grade
The composite is a weighted blend of 9 inputs, each scored 0–100. Each bar is that input's sub-score; the figure is the points it added to the 100-point composite (weight × sub-score).
- Cash flow +13.2/30.0
- ARV discount +11.2/15.0
- 1% rule +8.5/10.0
- Schools +5.3/10.0
- Livability +4.3/5.0
- DSCR +4.0/10.0
- Condition / age +3.8/5.0
- Rent growth +2.8/5.0
- Appreciation +0.0/10.0
$125,000
🖨 Deal sheet 📄 Offer letter ✓ Due diligence
Listing remarks
Maintenance free coastal living at its finest! This is a one bedroom, one bath condo on the top floor with awesome views of the bayou and the marina. Located just a short drive to downtown, this condo is part of a waterfront community that includes amenities such as including a gated pool, clubhouse with kitchen, pool table and exercise room, volleyball and tennis courts, fishing pier, putting green and kayak launch. There is a boat launch less than a quarter mile away which makes this the perfect waterfront oasis. Enjoy boating, waterskiing, or jet skis right in front of your condo. HOA dues include water, sewer, trash, landscaping and pool maintenance. Covered parking is assigned to eac
Key facts
- Fishing pier
- Gated pool
- Exercise room
Tags
Property features AI
Finance
- Other: Pets allowed
- HOA & community: Association with monthly fee; Monthly association fee covers accounting/legal, insurance, grounds maintenance, management, pest control, pool service, and salaries/payroll
Exterior
- Parking: Assigned covered parking (carport) for 1 vehicle; Guest parking; Paved parking
- Security: Smoke detector(s)
- Utilities: Public water; Public sewer; Electricity connected; Cable available; Water connected; Sewer connected
- Home design: Condominium; Lowrise (1–2 floors); One level; Move-in ready; Facing top-floor unit in a marina building on stilts
- Construction: Lap siding exterior; Pilings/steel/wood foundation; Flat roof; Built per public records
- Exterior features: Private in-ground fenced outdoor pool; Balcony; Dock; Tennis court(s); Marina access; Boating and fishing amenities; Street lights; Clubhouse; Fitness center; RV/boat storage
Interior
- Kitchen: Dishwasher; Disposal; Electric range; Microwave; Refrigerator; Eat-in kitchen layout
- Bedrooms: Bedroom(s) with walk-in closet(s)
- Flooring: Luxury vinyl
- Bathrooms: 1 full bathroom
- Heating & cooling: Central heating (electric); Central air (electric); Ceiling fan(s)
- Interior features: Ceiling fan(s); Eat-in kitchen; Walk-in closet(s); Metal insulated door(s); Blinds
- Laundry & utility: Washer; Dryer; Laundry inside (in bathroom)
Neighborhood map
What this means for you Summary
Snapshot
- This is a 1-bed/1.0-bath single-family listed at $125k. Condition is rated good.
Deal economics
- At list price, monthly cash flow is $-68 ($-813/yr) — negative.
- To cash-flow at today's rent, offer at most $115k (7.8% below list).
- Meets the 1% rule at list price ($2k rent vs $125k).
- Recommended offer: $115k (7.8% below list) — sets the bar for cash-flow.
- Cap rate 6.3% vs local median 4.2% in Ocean Springs — top-decile yield for the area; either an underpriced asset or a hidden risk that comps aren't pricing in. Stress-test before assuming the spread holds.
Location & tenants
- Location reads 86/100 on livability (#2 in MS, #420 nationally) — a professional / high-income tenant draw. Strengths: crime A+, amenities A+, cost of living A+; Watch: commute F.
- Ocean Springs School District (suburban): math 64% / reading 59% proficiency, ranked #1 of 130 in MS (top 1%) — acceptable for families but not a draw, mixed tenant base, ~2y average lease.
- Zoned schools: Pecan Park Elementary School (math 62% / reading 57%, grade B-, #27 of 375 statewide, top 8%, 530 students, 99% FRL); Ocean Springs Middle School (math 66% / reading 61%, grade B+, #3 of 179 statewide, top 2%, 967 students, 100% FRL); Ocean Springs High School (math 77% / reading 64%, grade B+, #1 of 197 statewide, top 0%, 1,899 students, 100% FRL) — zoned schools average 100% FRL vs 33% district-wide (67 pts higher); higher-poverty schools than district average — tighter screening recommended.
- Market conditions: Rents rising (+1.3%/yr); 714 active listings in the ZIP; 4 comparable units currently listed for rent nearby; rentals leasing fast (median 14d on market — plan ~1-2 weeks tenant-placement turnaround); solid renter incomes; 516 units permitted in Jackson County in 2024 (6 in 5+ unit buildings).
Forward outlook
- Local home prices are declining (-3.0%/yr); year-one equity from $864 of loan paydown is wiped out by about $4k of value loss. Plan a longer hold.
Negotiation context
- It's been on market 43 days — a 3% lower offer ($121k) is reasonable based on typical stale-listing flexibility.
- 7 sale attempts since 2y ago with the ask held roughly flat each time — persistent listings suggest the price (not the market) is what's stuck; bring a comps-based counter.
Risks & watch-outs
- Watch-outs: flood insurance adds $66/mo; HOA is 28% of rent.
- Climate carrying-cost: severe flood risk; severe wind risk, 99% chance of damaging wind over 30y; extreme-heat days projected 7→23/yr by 2055 (HVAC capex compounding) — expect insurance premiums to compound above CPI over the hold.
Questions for the listing agent
- What do current leases actually rent for vs. the listed asking? Can we see a recent rent roll and the last 12 months of T-12 income?
- It's been on market 43 days. Have you received any prior offers? Is the seller open to a 8% concession, seller financing, or rate buy-down credit?
- What's the actual annual flood-insurance premium (NFIP or private), and is the property in a SFHA with mandatory coverage?
- What does the HOA fee cover, when was the last increase, and are there any pending special assessments or reserve-fund shortfalls?
- Is there a deadline driving the sale (1031 exchange, divorce, estate, relocation)? That informs how much negotiation room exists.
- Schools are B-rated — typically a magnet for longer-tenancy family renters. What's the average tenant stay here, and is there a school-zone premium baked into asking?
- What's the average days-on-market for RENTAL listings here right now (not sales)? A rising rental-DOM trend means longer vacancies and softer asking-rent achievability than the comps imply.
- What's the recent tenant-quality profile in this submarket — average credit score on applications, eviction rate, late-payment / NSF rate, and stable-employment percentage? A property-management company in the area should have these aggregated.
- How much new for-sale + rental construction is in the pipeline within 1–3 miles? Heavy new supply typically softens prices + rents 12–24 months out; constrained supply supports both.
Investment metrics
- 1% rule
- 1.35% ✓
- Cap rate
- 6.28%
- Cash-on-cash
- -0.04%
- DSCR
- 1.00
- GRM
- 6.2
CMA / ARV
- ARV (median comp)
- $136,345
- List price
- $125,000
- Delta
- -8.32%
- Verdict
- FAIR
- Comps
- 20 within 1.0 mi
Projected returns pro-forma
-3.0% appreciation · 1.31% rent growth · sell at horizon
- IRR
- -23.0%
- Equity multiple
- 0.23×
- Total profit
- $-27,043
- Equity at exit
- $18,638
- IRR
- -26.1%
- Equity multiple
- -0.11×
- Total profit
- $-38,879
- Equity at exit
- $10,808
Cash invested: $35,000 (down + closing). Projections, not guarantees.
Landlord ↔ Tenant lean methodology
- Overall (STATE)
- 90 Strongly Landlord-Friendly
- State Mississippi
- 90 Strongly Landlord-Friendly · R+11
- County
- — inherits STATE
- City
- — inherits STATE
ZIP-level market 39564
- Home prices YoY
- -26.8%
- Rents YoY
- 1.3%
- Active inventory
- 714
- Price-to-rent
- 6.2×
Monthly cashflow live
- Estimated rent
- $1,693 medium interval (Pro) →
- Mortgage (P&I)
- −$656
- Tax est. 1.5%
- −$156 /mo · $1,875/yr
- Insurance
- −$52
- Flood insurance flood zone
- −$66 /mo · $798/yr
- HOA
- −$475
- Vacancy / Maint / Mgmt
- −$356
- Net cashflow
- $-68
Break-even live
UW: 25.0% down · 7.5% · 30yr · 1.5% tax · 5.0% vac · 8.0% maint · 8.0% mgmt
Financing live
Cash to close
- Down payment
- $31,250
- Closing costs
- $3,750
- Reserves months
- —
- Total cash needed
- —
Loan-product check · same deal, 3 products live
Conventional
25% down · 7.5% · 30yr
- Down + closing
- —
- Monthly P&I
- —
- Monthly cashflow
- —
- DSCR
- —
- Eligible?
- —
Personal DTI + credit; lowest rate.
DSCR
20% down · 8.5% · 30yr
- Down + closing
- —
- Monthly P&I
- —
- Monthly cashflow
- —
- DSCR
- —
- Eligible?
- —
No personal income docs; deal must DSCR.
Hard money
10% down · 12.0% · 12mo
- Down + closing
- —
- Monthly P&I
- —
- Monthly cashflow
- —
- DSCR
- —
- Eligible?
- —
Short-term bridge; refi at stabilization.
Rent comps 4 comps
| Address | Beds | Baths | Sqft | Rent | $/sqft | DOM | Units | Dist |
|---|---|---|---|---|---|---|---|---|
| 2501 Bienville Blvd Unit 432 Ocean Springs, MS | 2.0 | 2.0 | 1095 | $2,300 | $2.10 | 43d | 1 | 0.74mi |
| 2501 Bienville Blvd Ocean Springs, MS | 1.0 | 1.0 | 855 | $1,900 | $2.22 | 13d | 1 | 0.83mi |
| 3500 Groveland Rd Ocean Springs, MS | 2.0–3.0 | 2.0 | 1173 | $1,350 | $1.15 | 13d | 1 | 0.98mi |
| 600 Bechtel Blvd Ocean Springs, MS | 2.0 | 2.0 | 944 | $1,500 | $1.59 | 13d | 1 | 1.24mi |
HOA detail
- Monthly dues
- $475 · $5,700/yr
- Likely covers
- watersewertrashlandscapingpoolsecurity
Listing history 29 events
-
2026-06-18days on market $125,000 Active 43 DOM
-
2026-06-17days on market $125,000 Active 42 DOM
-
2026-06-16days on market $125,000 Active 41 DOM
-
2026-06-15days on market $125,000 Active 40 DOM
-
2026-06-14days on market $125,000 Active 38 DOM
-
2026-06-13days on market $125,000 Active 37 DOM
-
2026-06-10days on market $125,000 Active 35 DOM
-
2026-06-09days on market $125,000 Active 34 DOM
-
2026-06-08days on market $125,000 Active 33 DOM
-
2026-06-07days on market $125,000 Active 32 DOM
-
2026-06-02days on market $125,000 Active 27 DOM
-
2026-06-01days on market $125,000 Active 26 DOM
-
2026-05-31days on market $125,000 Active 25 DOM
-
2026-05-30days on market $125,000 Active 24 DOM
-
2026-05-06$125,000 Active 745-char remark
-
2025-04-23historical $1,300
-
2025-03-08$1,300
-
2025-03-08historical $1,300
-
2025-01-01$1,300
-
2025-01-01historical $1,300
-
2024-12-10price $1,300
-
2024-12-09historical $1,300
-
2024-11-28$1,300
-
2024-09-23historical
-
2024-09-19$1,500
-
2024-09-19historical $1,500
-
2024-09-06$1,500
-
2024-06-13price $139,900
-
2024-05-14$146,900 Active
ⓘ Source: listings_history table (triggers on properties + properties_extension) + one-shot
backfill from property_details.listing_events for pre-trigger history.
Climate risk First Street
- Flood 9/10 Extreme FEMA zone X · 99% chance over 30 yrs
- Wildfire 4/10 Moderate
- Heat 10/10 Extreme 7 d/yr ≥107°F today · 23 d/yr by 30 yrs out
- Wind 9/10 Extreme 99% chance of damaging wind over 30 yrs
- Air quality 2/10 Low 1 unhealthy d/yr today · 2 by 30 yrs out
Nearby sold comps map
Loading sold comps map…
Walkable amenities ~0.75 mi
Loading nearby amenities…
Taxation est. · year 1
- Rental income
- $20,317
- − Mortgage interest
- −$7,002
- − Property taxes
- −$1,875
- − Insurance
- −$1,422
- − Repairs & maintenance
- −$1,625
- − Management
- −$1,625
- − HOA
- −$5,700
- − Depreciation
- −$3,636
- Taxable loss
- −$2,569
- Est. tax savings @ 24.0%
- +$617
- After-tax cash flow
- $-196/yr
For passive investors: Depreciation is non-cash, so a rental often shows a tax loss while cash-flowing — sheltering income. Rental losses are passive: they offset passive income freely, and up to $25,000/yr can offset ordinary (W-2) income if you actively participate and your MAGI is under $100k (phasing out to $0 by $150k); unused losses carry forward. On sale, claimed depreciation is recaptured at up to 25%, and gains may owe capital-gains tax (a 1031 exchange can defer both). Figures are a year-1 estimate at your 24.0% rate — not tax advice; consult a CPA.
Condition & rehab AI · 12 photos
This one-bedroom, one-bath condo is in good condition with minimal repairs needed. It offers a maintenance-free waterfront lifestyle with community amenities.
Value-add opportunities
- Both Paint exterior siding — Enhances curb appeal and value
- Both Replace ceiling fan — Improves energy efficiency and aesthetics
Renovation cost estimate screening
Value-add ROI direction
- Both Paint exterior siding — Enhances curb appeal and value ↑
- Both Replace ceiling fan — Improves energy efficiency and aesthetics ↑
ⓘ Cost ranges are severity-bucket heuristics (US national rule-of-thumb). Get contractor quotes + a written scope before underwriting a rehab budget.
Schools (NCES district)
- District
- Ocean Springs School District
- NCES district ID
- 2803360
- Math proficiency
- 64% ▼ -3.00%
- Reading proficiency
- 59% ▲ 1.00%
- Median HH income
- $60,485
- Composite
- 53.35/100
- National rank
- #1477
- State rank
- #1 of 130 in MS
Livability — Ocean Springs
- Score
- 86/100
- State rank
- #2
- US rank
- #420
Category grades
Schools grade is shown separately in the Schools card above.
Census & demographics
- Census place
- Ocean Springs, MS
- County
- Jackson County · 82,196 people
- City population
- 43,240
- Metro
- Gulfport-Biloxi, MS
- Population (ZIP)
- 43,240
- Household income
- $78,596
- Rent vs Own
- Severe rent burden
- 734.0
Population outlook (Jackson County) Hauer SSP2
- Today (2025)
- 146,926 people
- By 2030
- 148,442 · +1.0%
- By 2040
- 149,631 · +1.8%
- By 2050
- 148,723 · +1.2%
- By 2075
- 147,845 · +0.6%
- By 2100
- 144,510 · -1.6%
Race, ethnicity, and origin ACS 2023
- Neighborhood character
- Predominantly White (74%)
- Race & ethnicity
- White 74% Black 10% Hispanic / Latino 8% Two or more races 7% Asian 4%
- Hispanic origin (detail)
- Mexican 3% Puerto Rican 2%
- Common ancestry
- Lithuanian 5% Slovak 4% Romanian 2%
- Foreign-born
- 5% · Canada, South Korea, Vietnam
- Languages at home
- 93% English-only · Spanish 3% Vietnamese 2% Tagalog/Filipino 1%
Political lean MEDSL · Jackson
- 2024 margin
- Solid R (+39.9) · D 29.5% · R 69.4% · Other 1.1%
- 2008→2024 swing
- -6.4pp toward R · 2008: -33.5pp · 2024: -39.9pp
- All cycles
- 2024: R+39.9 2020: R+34.6 2016: R+39.9 2012: R+36.1 2008: R+33.5
Not yet ingested
- Civics
- —
Market trends
- HPI YoY
- ▼ -74.77%
- Current HPI
- 204.2244
- Rent YoY
- ▲ 1.31%
- Metro
- Gulfport-Biloxi, MS
- State GDP YoY
- —
- F500 in state
- 0
Price history
-14.9% since first listed15 events — show timeline
- 2026-05-06 Listed $125,000 MLSU
- 2025-04-23 Rental Removed $1,300 MLSU
- 2025-03-08 Listed for Rent $1,300 MLSU
- 2025-03-08 Rental Removed $1,300 BUILDIUM
- 2025-01-01 Listed for Rent $1,300 BUILDIUM
- 2025-01-01 Rental Removed $1,300 MLSU
- 2024-12-10 Price Changed $1,300 MLSU
- 2024-12-09 Rental Removed $1,300 BUILDIUM
- 2024-11-28 Listed for Rent $1,300 BUILDIUM
- 2024-09-23 Listing Removed — MLSU
- 2024-09-19 Listed for Rent $1,500 MLSU
- 2024-09-19 Rental Removed $1,500 BUILDIUM
- 2024-09-06 Listed for Rent $1,500 BUILDIUM
- 2024-06-13 Price Changed $139,900 MLSU
- 2024-05-14 Listed $146,900 MLSU
Cash-flow waterfall
monthlySold comps — $/sqft
last 12 mo · ≤1 miLoading sold comps…