303 W South St · Cumberland, PA
Flood risk 1/10 · Minimal
- FEMA flood zone
- X (unshaded)
- Chance of flooding over 30 yrs
- 0.0%
- Est. flood insurance / yr
- $473 – $860
Fire risk 1/10 · Minimal
- Est. fire insurance / yr
- $511 – $949
Heat risk 4/10 · Minor
- Hot days now (above 98°F)
- 7 days/yr
- Hot days in 30 yrs
- 19 days/yr
Wind risk 2/10 · Minimal
- Chance of severe wind over 30 yrs
- —
Air-quality risk 2/10 · Minimal
- Unhealthy air days now
- 1 days/yr
- Unhealthy air days in 30 yrs
- 2 days/yr
Risk factors via First Street. Map © Google.
Why this score? — see what drove the B grade
The composite is a weighted blend of 9 inputs, each scored 0–100. Each bar is that input's sub-score; the figure is the points it added to the 100-point composite (weight × sub-score).
- Cash flow +29.5/30.0
- DSCR +10.0/10.0
- 1% rule +9.2/10.0
- ARV discount +7.5/15.0
- Appreciation +6.7/10.0
- Rent growth +2.5/5.0
- Livability +2.5/5.0
- Condition / age +2.5/5.0
- Schools +2.2/10.0
$60,000
🖨 Deal sheet 📄 Offer letter ✓ Due diligence
Listing remarks
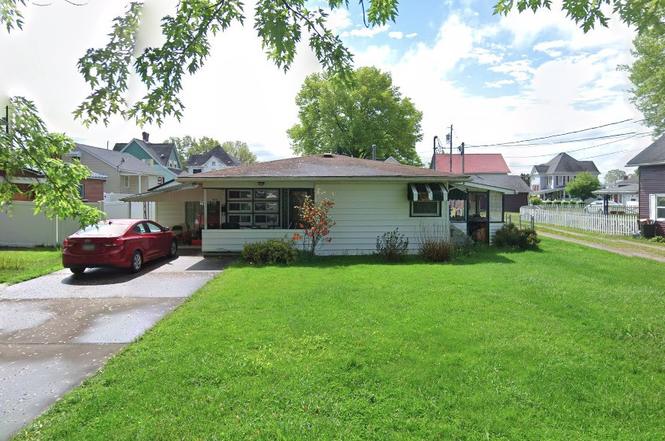
Charming 2-bedroom, 1-bath ranch offering convenient one-level living in a quiet residential setting. The home features a covered carport, off-street parking, and a large, level yard with plenty of outdoor space for recreation or future improvements. Interior access has not been granted, and the property is being sold as-is based on exterior viewing only. Buyer to perform all due diligence. Great opportunity for investors or buyers looking for a property with potential. Conveniently located near local amenities, schools, and everyday conveniences.
Key facts
- Large level yard
- Off street parking
- Covered carport
Tags
Property features AI
Exterior
- Utilities: Public water; Public sewer
- Home design: Frame construction
- Construction: Asphalt roof; Frame construction
- Exterior features: Public transportation nearby
Interior
- Bathrooms: 1 full bathroom
- Heating & cooling: Forced air heating (gas); Central air conditioning
- Interior features: Resale condition
Neighborhood map
What this means for you Summary
Snapshot
- This is a 2-bed/1.0-bath single-family listed at $60k.
Deal economics
- At list price, monthly cash flow is $215 ($3k/yr) — positive.
- The deal already cash-flows at list — no discount required.
- Meets the 1% rule at list price ($852 rent vs $60k).
- Recommended offer: $58k (3.0% below list) — sets the bar for market timing.
Location & tenants
- Location reads: area grade B — affects rentability + tenant quality, not the cash-flow math above.
- Carmichaels Area SD (rural): math 17% / reading 36% proficiency, ranked #465 of 539 in PA (top 86%) — low school quality limits family demand, transient renter base, plan for 1-2y turnover.
- Market conditions: 20 active listings in the ZIP; 30 units permitted in Greene County in 2024 (0 in 5+ unit buildings).
Forward outlook
- In year one you build about $2k of equity ($415 loan paydown + $2k appreciation (3.4% local appreciation)).
- Greene County population projected at -20% by 2050 — secular population decline; favor cash flow + early exit over multi-decade hold.
- At projected returns (3.4% appreciation + 3.0% rent growth), your $17k cash investment doubles in ~4 years — after that, you're playing with house money.
Negotiation context
- It's been on market 44 days — a 3% lower offer ($58k) is reasonable based on typical stale-listing flexibility.
Risks & watch-outs
- Watch-outs: built in 1952 — expect roof / HVAC / electrical / plumbing capex.
Questions for the listing agent
- It's been on market 44 days. Have you received any prior offers? Is the seller open to a 3% concession, seller financing, or rate buy-down credit?
- Built in 1952 — when were the roof, HVAC, electrical panel, plumbing, and water heater last replaced?
- Is there a deadline driving the sale (1031 exchange, divorce, estate, relocation)? That informs how much negotiation room exists.
- What's the average days-on-market for RENTAL listings here right now (not sales)? A rising rental-DOM trend means longer vacancies and softer asking-rent achievability than the comps imply.
- What's the recent tenant-quality profile in this submarket — average credit score on applications, eviction rate, late-payment / NSF rate, and stable-employment percentage? A property-management company in the area should have these aggregated.
- How much new for-sale + rental construction is in the pipeline within 1–3 miles? Heavy new supply typically softens prices + rents 12–24 months out; constrained supply supports both.
Investment metrics
- 1% rule
- 1.42% ✓
- Cap rate
- 10.60%
- Cash-on-cash
- 15.37%
- DSCR
- 1.68
- GRM
- 5.9
CMA / ARV
- ARV (median comp)
- $131,525
- List price
- $60,000
- Delta
- -54.38%
- Verdict
- UNDERPRICED
- Comps
- 7 within 1.0 mi
Show comp detail 2 sales within ~0.75 mi
| Address | Dist | Beds/Ba | Sqft | Sold | Price | $/sf | Match |
|---|---|---|---|---|---|---|---|
| 637 Browns Ferry Rd | 0.61mi | 2/1.0 | 768 (-2%) | 13mo | $130,000 | $169 | 58 |
| 535 Old Waynesburg Rd | 0.42mi | 2/1.5 | 753 (-4%) | 22mo | $150,001 | $199 | 54 |
Match score weights: distance 35% · size 25% · config 20% · recency 20%. Top-matched comps best support the ARV.
Projected returns pro-forma
3.42% appreciation · 3.0% rent growth · sell at horizon
- IRR
- 22.9%
- Equity multiple
- 2.33×
- Total profit
- $22,306
- Equity at exit
- $28,396
- IRR
- 23.5%
- Equity multiple
- 4.49×
- Total profit
- $58,640
- Equity at exit
- $44,898
Cash invested: $16,800 (down + closing). Projections, not guarantees.
Landlord ↔ Tenant lean methodology
- Overall (STATE)
- 62 Landlord-Friendly
- State Pennsylvania
- 62 Landlord-Friendly · EVEN
- County
- — inherits STATE
- City
- — inherits STATE
ZIP-level market 15320
- Home prices YoY
- 2.2%
- Active inventory
- 20
- Price-to-rent
- 5.9×
Monthly cashflow live
- Estimated rent
- $852 medium interval (Pro) →
- Mortgage (P&I)
- −$315
- Tax from tax record
- −$118 /mo · $1,418/yr
- Insurance
- −$25
- HOA
- −$0
- Vacancy / Maint / Mgmt
- −$179
- Net cashflow
- $215
Break-even live
UW: 25.0% down · 7.5% · 30yr · 1.5% tax · 5.0% vac · 8.0% maint · 8.0% mgmt
Financing live
Cash to close
- Down payment
- $15,000
- Closing costs
- $1,800
- Reserves months
- —
- Total cash needed
- —
Loan-product check · same deal, 3 products live
Conventional
25% down · 7.5% · 30yr
- Down + closing
- —
- Monthly P&I
- —
- Monthly cashflow
- —
- DSCR
- —
- Eligible?
- —
Personal DTI + credit; lowest rate.
DSCR
20% down · 8.5% · 30yr
- Down + closing
- —
- Monthly P&I
- —
- Monthly cashflow
- —
- DSCR
- —
- Eligible?
- —
No personal income docs; deal must DSCR.
Hard money
10% down · 12.0% · 12mo
- Down + closing
- —
- Monthly P&I
- —
- Monthly cashflow
- —
- DSCR
- —
- Eligible?
- —
Short-term bridge; refi at stabilization.
Listing history 17 events
-
2026-06-18days on market $60,000 Active 44 DOM
-
2026-06-17days on market $60,000 Active 43 DOM
-
2026-06-16days on market $60,000 Active 42 DOM
-
2026-06-15days on market $60,000 Active 41 DOM
-
2026-06-13days on market $60,000 Active 39 DOM
-
2026-06-12days on market $60,000 Active 38 DOM
-
2026-06-09days on market $60,000 Active 35 DOM
-
2026-06-08days on market $60,000 Active 34 DOM
-
2026-06-08days on market $60,000 Active 33 DOM
-
2026-06-05days on market $60,000 Active 31 DOM
-
2026-06-04days on market $60,000 Active 29 DOM
-
2026-06-02days on market $60,000 Active 28 DOM
-
2026-06-01days on market $60,000 Active 27 DOM
-
2026-05-31days on market $60,000 Active 26 DOM
-
2026-05-05$60,000 Active 553-char remark
-
2008-05-09soldstatus $68,900
-
2000-02-09soldstatus $32,000
ⓘ Source: listings_history table (triggers on properties + properties_extension) + one-shot
backfill from property_details.listing_events for pre-trigger history.
Tax reassessment forecast PA · Partial reset (capped growth)
- Current annual tax
- $1,418 · $118/mo
- Projected year-2 tax
- $1,418 · $118/mo
- Expected delta
- $0/yr ($0/mo · 0.0%)
ⓘ Screening estimate from a state-policy table — verify with the county assessor before closing.
Climate risk First Street
- Flood 1/10 Low FEMA zone X (unshaded) · 0% chance over 30 yrs
- Wildfire 1/10 Low
- Heat 4/10 Moderate 7 d/yr ≥98°F today · 19 d/yr by 30 yrs out
- Wind 2/10 Low
- Air quality 2/10 Low 1 unhealthy d/yr today · 2 by 30 yrs out
Nearby sold comps map
Loading sold comps map…
Walkable amenities ~0.75 mi
Loading nearby amenities…
Taxation est. · year 1
- Rental income
- $10,223
- − Mortgage interest
- −$3,361
- − Property taxes
- −$1,418
- − Insurance
- −$300
- − Repairs & maintenance
- −$818
- − Management
- −$818
- − Depreciation
- −$1,745
- Taxable income
- $1,763
- Est. tax owed @ 24.0%
- −$423
- After-tax cash flow
- $2,159/yr
For passive investors: Depreciation is non-cash, so a rental often shows a tax loss while cash-flowing — sheltering income. Rental losses are passive: they offset passive income freely, and up to $25,000/yr can offset ordinary (W-2) income if you actively participate and your MAGI is under $100k (phasing out to $0 by $150k); unused losses carry forward. On sale, claimed depreciation is recaptured at up to 25%, and gains may owe capital-gains tax (a 1031 exchange can defer both). Figures are a year-1 estimate at your 24.0% rate — not tax advice; consult a CPA.
Schools (NCES district)
- District
- Carmichaels Area SD
- NCES district ID
- 4205070
- Math proficiency
- 17% ▼ -19.00%
- Reading proficiency
- 36% ▼ -20.00%
- Median HH income
- $39,060
- Composite
- 22.18/100
- National rank
- #8164
- State rank
- #465 of 539 in PA
Livability — Cumberland
No livability data for this city. (Only ~50 U.S. cities are tracked.)
Census & demographics
- Census place
- Fairdale, PA
- Population (ZIP)
- 4,578
Population outlook (Greene County) Hauer SSP2
- Today (2025)
- 34,975 people
- By 2030
- 33,554 · -4.1%
- By 2040
- 30,615 · -12.5%
- By 2050
- 27,819 · -20.5%
- By 2075
- 21,678 · -38.0%
- By 2100
- 16,318 · -53.3%
Race, ethnicity, and origin ACS 2023
- Neighborhood character
- Predominantly White (98%)
- Race & ethnicity
- White 98% Two or more races 2%
- Common ancestry
- Romanian 11% Slovak 3% Serbian 2%
- Foreign-born
- 1% · Canada
- Languages at home
- 99% English-only · Spanish 1%
Political lean MEDSL · Greene
- 2024 margin
- Solid R (+44.8) · D 26.6% · R 71.5% · Other 1.9%
- 2008→2024 swing
- -44.4pp toward R · 2008: -0.4pp · 2024: -44.8pp
- All cycles
- 2024: R+44.8 2020: R+43.4 2016: R+41.7 2012: R+17.6 2008: R+0.4
Not yet ingested
- Civics
- —
Market trends
- HPI YoY
- ▲ 3.42%
- Current HPI
- 157.0795
- Rent YoY
- —
- Metro
- —
- State GDP YoY
- ▲ 1.68%
- F500 in state
- 34
Industry mix (Fortune 500 HQ in PA)
| Industry | F500 HQs | Revenue |
|---|---|---|
| Healthcare | 2 | $309B |
|
||
| Insurance | 2 | $27B |
|
||
| Telecommunications / Media | 1 | $124B |
|
||
| Industrial Distribution | 1 | $22B |
|
||
| Financial Services | 1 | $20B |
|
||
| Chemicals / Materials | 1 | $18B |
|
||
Price history
+87.5% since first listed3 events — show timeline
- 2026-05-05 Listed $60,000 West Penn MLS
- 2008-05-09 Sold (Public Records) $68,900 Public Records
- 2000-02-09 Sold (Public Records) $32,000 Public Records
Property tax history
+1.4%/yrLatest (2025): $1,418 · +0.0% YoY. Source: county tax records.
Cash-flow waterfall
monthlySold comps — $/sqft
last 12 mo · ≤1 miLoading sold comps…