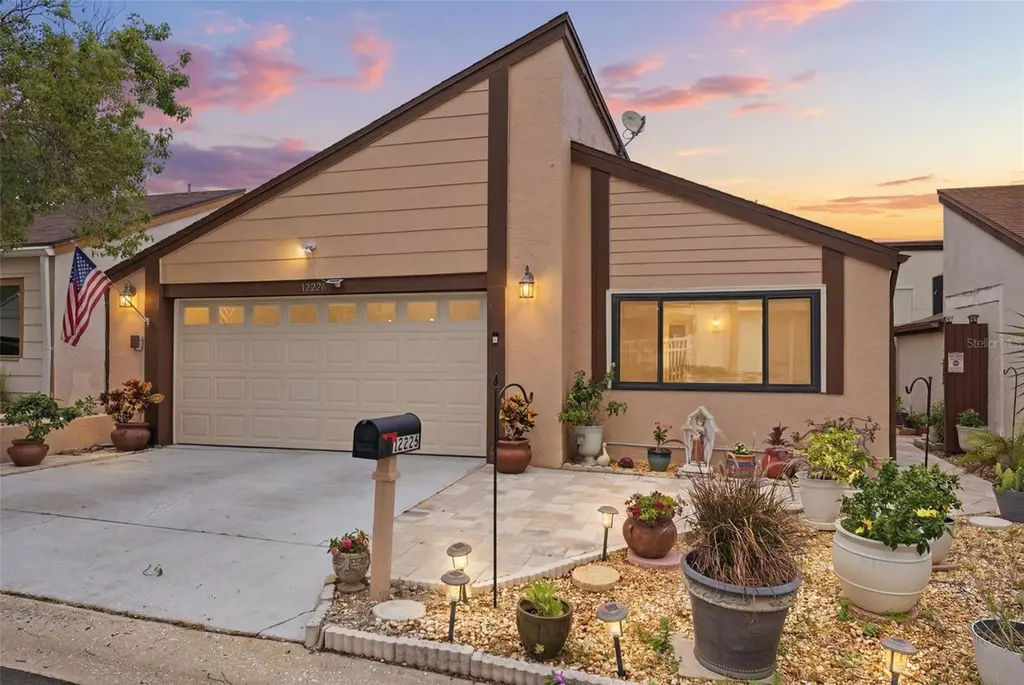
12226 Cider Mill Ln · Bayonet Point, FL
Flood risk 1/10 · Minimal
- FEMA flood zone
- X (unshaded)
- Chance of flooding over 30 yrs
- 0.0%
- Est. flood insurance / yr
- $507 – $1,088
Fire risk 3/10 · Minor
- Est. fire insurance / yr
- $947 – $1,759
Heat risk 10/10 · Severe
- Hot days now (above 108°F)
- 7 days/yr
- Hot days in 30 yrs
- 25 days/yr
Wind risk 10/10 · Severe
- Chance of severe wind over 30 yrs
- 99.0%
Air-quality risk 2/10 · Minimal
- Unhealthy air days now
- 1 days/yr
- Unhealthy air days in 30 yrs
- 3 days/yr
Risk factors via First Street. Map © Google.
Why this score? — see what drove the D grade
The composite is a weighted blend of 9 inputs, each scored 0–100. Each bar is that input's sub-score; the figure is the points it added to the 100-point composite (weight × sub-score).
- Cash flow +13.4/30.0
- ARV discount +9.0/15.0
- Schools +4.3/10.0
- DSCR +4.0/10.0
- Livability +3.5/5.0
- 1% rule +2.5/10.0
- Condition / age +2.5/5.0
- Rent growth +1.9/5.0
- Appreciation +0.0/10.0
$250,000
🖨 Deal sheet (PDF) 📄 Offer letter ✓ Due diligence
Listing remarks
Welcome to this beautifully maintained gem in the highly desirable community of Beacon Woods! From the moment you arrive at 12226 Cider Mill Lane, you will appreciate the pride of ownership and thoughtful upgrades throughout. This inviting home offers a bright, open feel with stylish “Lifestyle Vinyl” flooring installed in 2023, creating a modern and seamless flow perfect for everyday living and entertaining. The flexible second bedroom, currently utilized as a home office, features Newly tinted office/bedroom window featuring a modern electric shade for added privacy, comfort, and convenience. (2023) allowing for abundant natural light and added convenience — ideal for t
Key facts
- 3,000 sq ft lot
- 2 garage spots
- Community pool
Property features AI
Finance
- Other: Partially furnished; Living area reported as 1,998 square feet; Property listed as residential single family residence; Homestead exemption indicated
- HOA & community: Member of Beacon Woods Civic Association; Quarterly HOA fee (approximately $28.33); Monthly HOA amount reported as $9.44; Community amenities include clubhouse and pool; Pets allowed: cats and dogs
Exterior
- Parking: Attached garage; 2-car garage
- Utilities: Public water; Public sewer; Cable available; Electricity connected; Water connected
- Home design: Single family residence (residential); Planned Unit Development (PUD); One-story; Faces east; Entry level: One
- Construction: Block, concrete and stucco construction; Shingle roof; Slab foundation; Built on a lot of approximately 0.07 acres
- Exterior features: Private mailbox; Sliding doors; Asphalt road access
Interior
- Kitchen: Refrigerator
- Bedrooms: 2 bedrooms
- Flooring: Vinyl flooring
- Bathrooms: 2 full bathrooms
- Heating & cooling: Central heating; Central air conditioning
- Interior features: Ceiling fans
- Laundry & utility: Laundry area in the garage
Neighborhood map
What this means for you Summary
Snapshot
- This is a 3-bed/2.0-bath single-family listed at $250k.
Deal economics
- At list price, monthly cash flow is $2 ($29/yr) — positive.
- The deal already cash-flows at list — no discount required.
- To meet the 1% rule (rent ≥ 1% of price), the offer needs to be $187k (25.1% below list).
- Recommended offer: $187k (25.1% below list) — sets the bar for 1% rule.
Location & tenants
- Location reads 69/100 on livability (#485 in FL) — a middle-class / working-renter tenant base. Strengths: cost of living A+, housing A+, health & safety A+; Watch: crime D+, amenities D+, commute F.
- Pasco (suburban): math 50% / reading 52% proficiency, ranked #32 of 73 in FL (top 44%) — acceptable for families but not a draw, mixed tenant base, ~2y average lease.
- Zoned schools: Hudson Academy (math 35% / reading 30%, grade F, #443 of 571 statewide, top 78%, 964 students, 80% FRL); Fivay High School (math 20% / reading 28%, grade F, #529 of 667 statewide, top 80%, 1,610 students, 78% FRL) — zoned schools average 79% FRL vs 48% district-wide (30 pts higher); higher-poverty schools than district average — tighter screening recommended.
- Zoned-school proficiency averages 28% at this address vs 51% district-wide (-23 pts) — the specific schools serving this property underperform the Pasco average; the district grade overstates school quality for this exact location.
- Market conditions: Rents soft (-2.3%/yr); 800 active listings in the ZIP; 40 comparable units currently listed for rent nearby; rentals at typical pace (median 23d on market — plan ~3-4 weeks tenant-placement turnaround); 6,765 units permitted in Pasco County in 2024 (1,250 in 5+ unit buildings).
- This rent runs 44% of the median local income ($51k/yr) — at the standard rent-burdened threshold; future hikes will face affordability resistance.
Forward outlook
- Local home prices are declining (-3.0%/yr); year-one equity from $2k of loan paydown is wiped out by about $8k of value loss. Plan a longer hold.
- Pasco County population projected at +29% by 2050 — long-run rental-demand tailwind backs the buy-and-hold thesis.
Negotiation context
- It's been on market 38 days — a 3% lower offer ($242k) is reasonable based on typical stale-listing flexibility.
- 3 sale attempts since 19y ago with the ask held roughly flat each time — persistent listings suggest the price (not the market) is what's stuck; bring a comps-based counter.
- Current owner paid $82k; list at $250k implies a 203% gain — meaningful room to come down on a strong offer.
Risks & watch-outs
- Climate carrying-cost: severe wind risk, 99% chance of damaging wind over 30y; extreme-heat days projected 7→25/yr by 2055 (HVAC capex compounding) — expect insurance premiums to compound above CPI over the hold.
Questions for the listing agent
- It's been on market 38 days. Have you received any prior offers? Is the seller open to a 25% concession, seller financing, or rate buy-down credit?
- Built in 1978 — when were the roof, HVAC, electrical panel, plumbing, and water heater last replaced?
- What does the HOA fee cover, when was the last increase, and are there any pending special assessments or reserve-fund shortfalls?
- Is there a deadline driving the sale (1031 exchange, divorce, estate, relocation)? That informs how much negotiation room exists.
- Schools are F-rated, which usually means shorter tenancies and higher turnover. Who's the typical renter profile here, and what's been the actual vacancy rate?
- Crime grade is D in this area — have there been break-ins, vandalism, or insurance claims at this property in the last 3 years? What carrier currently insures it and at what premium?
- The area grade is low — what's the realistic commute time and amenity access for the typical tenant pool here? Any planned neighborhood developments (good or bad) we should know about?
- What's the average days-on-market for RENTAL listings here right now (not sales)? A rising rental-DOM trend means longer vacancies and softer asking-rent achievability than the comps imply.
- What's the recent tenant-quality profile in this submarket — average credit score on applications, eviction rate, late-payment / NSF rate, and stable-employment percentage? A property-management company in the area should have these aggregated.
- How much new for-sale + rental construction is in the pipeline within 1–3 miles? Heavy new supply typically softens prices + rents 12–24 months out; constrained supply supports both.
Investment metrics
- 1% rule
- 0.75% ✗
- Cap rate
- 6.30%
- Cash-on-cash
- 0.04%
- DSCR
- 1.00
- GRM
- 11.1
CMA / ARV
- ARV (on-the-fly)
- $258,456
- Comps found
- 12
Show comp detail 12 sales within ~0.75 mi
| Address | Dist | Beds/Ba | Sqft | Sold | Price | $/sf | Match |
|---|---|---|---|---|---|---|---|
| 8204 Heartwood Ln | 0.24mi | 3/2.0 | 1,519 (+5%) | 2mo | $270,000 | $178 | 80 |
| 8200 Mill Creek Ln | 0.25mi | 3/2.0 | 1,519 (+5%) | 2mo | $242,500 | $160 | 79 |
| 8026 Hunters Whip Row Cir | 0.11mi | 3/2.0 | 1,308 (-10%) | 1mo | $270,000 | $206 | 77 |
| 12711 Shell Point Dr | 0.64mi | 3/2.0 | 1,464 (+1%) | 1mo | $92,500 | $63 | 68 |
| 12302 Quail Run Row | 0.41mi | 2/2.0 (-1) | 1,517 (+4%) | 0mo | $160,000 | $105 | 68 |
| 8401 Clover Hill Loop | 0.47mi | 3/2.0 | 1,334 (-8%) | 4mo | $249,900 | $187 | 62 |
| 12412 Rodeo Ln | 0.52mi | 3/2.0 | 1,320 (-9%) | 2mo | $216,000 | $164 | 59 |
| 8501 Mill Creek Ln | 0.55mi | 3/2.0 | 1,615 (+11%) | 0mo | $260,000 | $161 | 55 |
| 7901 Bell Dr | 0.54mi | 2/2.0 (-1) | 1,310 (-10%) | 0mo | $240,000 | $183 | 53 |
| 8510 Wagon Wheel Ln | 0.65mi | 2/2.0 (-1) | 1,334 (-8%) | 3mo | $250,000 | $187 | 48 |
| 11703 Oceanside Dr | 0.62mi | 3/2.5 | 1,655 (+14%) | 1mo | $330,000 | $199 | 45 |
| 11718 Newell Dr | 0.69mi | 2/2.0 (-1) | 1,310 (-10%) | 3mo | $203,000 | $155 | 44 |
Match score weights: distance 35% · size 25% · config 20% · recency 20%. Top-matched comps best support the ARV.
Projected returns pro-forma
-3.0% appreciation · 0.0% rent growth · sell at horizon
- IRR
- -19.2%
- Equity multiple
- 0.34×
- Total profit
- $-45,968
- Equity at exit
- $37,276
- IRR
- -18.4%
- Equity multiple
- 0.12×
- Total profit
- $-61,540
- Equity at exit
- $21,615
Cash invested: $70,000 (down + closing). Projections, not guarantees.
Landlord ↔ Tenant lean methodology
- Overall (STATE)
- 87 Strongly Landlord-Friendly
- State Florida
- 87 Strongly Landlord-Friendly · R+3
- County
- — inherits STATE
- City
- — inherits STATE
ZIP-level market 34667
- Rents YoY
- -2.3%
- Active inventory
- 800
- Price-to-rent
- 11.1×
Monthly cashflow live
- Estimated rent
- $1,872 high interval (Pro) →
- Mortgage (P&I)
- −$1,311
- Tax from tax record
- −$52 /mo · $623/yr
- Insurance
- −$104
- HOA
- −$9
- Vacancy / Maint / Mgmt
- −$393
- Net cashflow
- $2
Break-even live
Sensitivity live
| Price | -10% $144 | -5% $73 | +0% $2 | +5% $-68 | +10% $-139 |
|---|---|---|---|---|---|
| Rent | -10% $-145 | -5% $-72 | +0% $2 | +5% $76 | +10% $150 |
| Rate | -1.0pp $128 | -0.5pp $66 | base $2 | +0.5pp $-62 | +1.0pp $-128 |
UW: 25.0% down · 7.5% · 30yr · 1.5% tax · 5.0% vac · 8.0% maint · 8.0% mgmt
Financing live
Cash to close
- Down payment
- $62,500
- Closing costs
- $7,500
- Reserves months
- —
- Total cash needed
- —
Loan-product check · same deal, 3 products live
Conventional
25% down · 7.5% · 30yr
- Down + closing
- —
- Monthly P&I
- —
- Monthly cashflow
- —
- DSCR
- —
- Eligible?
- —
Personal DTI + credit; lowest rate.
DSCR
20% down · 8.5% · 30yr
- Down + closing
- —
- Monthly P&I
- —
- Monthly cashflow
- —
- DSCR
- —
- Eligible?
- —
No personal income docs; deal must DSCR.
Hard money
10% down · 12.0% · 12mo
- Down + closing
- —
- Monthly P&I
- —
- Monthly cashflow
- —
- DSCR
- —
- Eligible?
- —
Short-term bridge; refi at stabilization.
Rent comps 40 comps
| Address | Beds | Baths | Sqft | Rent | $/sqft | DOM | Units | Dist |
|---|---|---|---|---|---|---|---|---|
| 12213 Saddle Strap Row Hudson, FL | 3.0 | 2.0 | 1684 | $1,990 | $1.18 | 20d | 1 | 0.12mi |
| 7602 Danube Dr Unit 7602 Hudson, FL | 2.0 | 2.0 | 1125 | $1,600 | $1.42 | 26d | 1 | 0.29mi |
| 7616 Danube Dr Hudson, FL | 2.0 | 2.0 | 1125 | $1,350 | $1.20 | 26d | 1 | 0.32mi |
| 12215 Meadowbrook Ln Hudson, FL | 2.0 | 2.0 | 1519 | $1,850 | $1.22 | 26d | 1 | 0.32mi |
| 12041 Hoosier Ct #204 Hudson, FL | 2.0 | 2.0 | 1103 | $1,495 | $1.36 | 26d | 1 | 0.34mi |
| 12041 Hoosier Ct #204 Hudson, FL | 2.0 | 2.0 | 1103 | $1,495 | $1.36 | 20d | 1 | 0.34mi |
| 12027 Hoosier Ct #203 Hudson, FL | 2.0 | 2.0 | 1103 | $1,550 | $1.41 | 26d | 1 | 0.37mi |
| 8304 Mill Creek Ln Hudson, FL | 2.0 | 2.0 | 1000 | $1,650 | $1.65 | 26d | 1 | 0.37mi |
| 12200 Hudson Ridge Dr Port Richey, FL | 2.0–3.0 | 2.0 | 1107 | $1,704 | $1.54 | 5d | 10 | 0.41mi |
| 8312 Mill Creek Ln Hudson, FL | 2.0 | 2.0 | 1152 | $1,600 | $1.39 | 26d | 1 | 0.42mi |
| 8312 Mill Creek Ln Hudson, FL | 2.0 | 2.0 | 1152 | $1,600 | $1.39 | 1d | 1 | 0.42mi |
| 11902 Oceanside Dr Port Richey, FL | 4.0 | 2.0 | 1200 | $1,800 | $1.50 | 5d | 1 | 0.44mi |
| 7924 Halsey Dr Port Richey, FL | 3.0 | 2.0 | 1272 | $1,800 | $1.42 | 7d | 1 | 0.53mi |
| 7924 Halsey Dr Port Richey, FL | 3.0 | 2.0 | 1272 | $1,800 | $1.42 | 24d | 1 | 0.53mi |
| 7433 Greystone Dr #7433 Hudson, FL | 2.0 | 2.0 | 1029 | $1,300 | $1.26 | 20d | 1 | 0.61mi |
| 11630 Paige Dr Port Richey, FL | 3.0 | 1.0 | 1152 | $1,680 | $1.46 | 14d | 1 | 0.64mi |
| 11611 Constance Dr Port Richey, FL | 3.0 | 1.0 | 984 | $1,540 | $1.57 | 13d | 1 | 0.69mi |
| 11611 Constance Dr Port Richey, FL | 3.0 | 1.0 | 984 | $1,540 | $1.57 | 26d | 1 | 0.69mi |
| 11610 Meadow Dr Port Richey, FL | 2.0 | 2.0 | 1128 | $1,570 | $1.39 | 14d | 1 | 0.70mi |
| 12809 College Hill Dr Hudson, FL | 3.0 | 2.0 | 1114 | $1,780 | $1.60 | 7d | 1 | 0.74mi |
| 12702 Social Dr Hudson, FL | 2.0 | 1.0 | 1032 | $1,500 | $1.45 | 7d | 1 | 0.74mi |
| 8305 Sandwedge Cir Unit A Hudson, FL | 2.0 | 2.0 | 1144 | $1,450 | $1.27 | 24d | 1 | 0.76mi |
| 7715 Sue Ellen Dr Port Richey, FL | 2.0 | 2.0 | 1080 | $1,495 | $1.38 | 5d | 1 | 0.78mi |
| 7539 Gulf Highlands Dr Port Richey, FL | 2.0 | 1.5 | 936 | $1,550 | $1.66 | 7d | 1 | 0.79mi |
| 7804 Topay Ln Port Richey, FL | 3.0 | 2.0 | 1125 | $1,795 | $1.60 | 1d | 1 | 0.83mi |
| 7608 Sue Ellen Dr Port Richey, FL | 3.0 | 2.0 | 1310 | $2,400 | $1.83 | 26d | 1 | 0.85mi |
| 7300 Country Club Dr Hudson, FL | 2.0 | 1.0 | 926 | $1,400 | $1.51 | 5d | 1 | 0.88mi |
| 7530 Judith Cres Port Richey, FL | 2.0 | 2.0 | 1446 | $1,695 | $1.17 | 22d | 1 | 0.95mi |
| 7530 Judith Cres Port Richey, FL | 2.0 | 2.0 | 1446 | $2,200 | $1.52 | 26d | 1 | 0.95mi |
| 8161 Braddock Cir #1 Port Richey, FL | 2.0 | 2.0 | 1000 | $1,595 | $1.59 | 20d | 1 | 0.97mi |
| 7730 Greybirch Ter Port Richey, FL | 3.0 | 2.5 | 1773 | $1,850 | $1.04 | 26d | 1 | 1.01mi |
| 13306 Lakeshore Blvd Hudson, FL | 3.0 | 2.0 | 1700 | $1,500 | $0.88 | 1d | 1 | 1.01mi |
| 13121 Shadberry Ln Hudson, FL | 3.0 | 2.0 | 1771 | $1,889 | $1.07 | 5d | 1 | 1.01mi |
| 7520 Hawthorn Dr Unit NA Port Richey, FL | 2.0 | 2.0 | 1303 | $1,900 | $1.46 | 26d | 1 | 1.04mi |
| 7520 Hawthorn Dr Port Richey, FL | 2.0 | 2.0 | 1303 | $1,800 | $1.38 | 26d | 1 | 1.04mi |
| 7531 Greybirch Ter Port Richey, FL | 3.0 | 2.0 | 1400 | $2,000 | $1.43 | 26d | 1 | 1.04mi |
| 11241 Yewtree Ave Port Richey, FL | 3.0 | 2.0 | 1306 | $1,950 | $1.49 | 26d | 1 | 1.05mi |
| 13102 Pembrook Ct Hudson, FL | 2.0 | 2.0 | 1221 | $1,575 | $1.29 | 26d | 1 | 1.07mi |
| 13013 Sawmill Way Hudson, FL | 2.0 | 2.0 | 1519 | $1,790 | $1.18 | 7d | 1 | 1.08mi |
| 11138 Yellowwood Ln Unit NA Port Richey, FL | 3.0 | 1.0 | 1000 | $1,800 | $1.80 | 26d | 1 | 1.12mi |
HOA detail
- Monthly dues
- $9 · $108/yr
- Likely covers
- electric
Listing history 20 events
-
2026-06-22days on market $250,000 Active 38 DOM
-
2026-06-18days on market $250,000 Active 35 DOM
-
2026-06-17days on market $250,000 Active 34 DOM
-
2026-06-16days on market $250,000 Active 33 DOM
-
2026-06-15days on market $250,000 Active 32 DOM
-
2026-06-13days on market $250,000 Active 30 DOM
-
2026-06-09days on market $250,000 Active 26 DOM
-
2026-06-08days on market $250,000 Active 25 DOM
-
2026-06-07days on market $250,000 Active 24 DOM
-
2026-06-04days on market $250,000 Active 21 DOM
-
2026-06-03days on market $250,000 Active 20 DOM
-
2026-06-02days on market $250,000 Active 19 DOM
-
2026-06-01days on market $250,000 Active 18 DOM
-
2026-05-31days on market $250,000 Active 17 DOM
-
2026-05-15status Active
-
2026-05-14$250,000 Active
-
2007-01-11$169,900
-
2001-09-10soldstatus $82,500
-
1997-02-05soldstatus $55,000
-
1987-04-01soldstatus $61,500
ⓘ Source: listings_history table (triggers on properties + properties_extension) + one-shot
backfill from property_details.listing_events for pre-trigger history.
Tax reassessment forecast FL · Resets to sale price
- Current annual tax
- $623 · $52/mo
- Projected year-2 tax
- $2,075 · $173/mo
- Expected delta
- +$1,452/yr (+$121/mo · 233.2%)
ⓘ Screening estimate from a state-policy table — verify with the county assessor before closing.
Climate risk First Street
- Flood 1/10 Low FEMA zone X (unshaded) · 0% chance over 30 yrs
- Wildfire 3/10 Moderate
- Heat 10/10 Extreme 7 d/yr ≥108°F today · 25 d/yr by 30 yrs out
- Wind 10/10 Extreme 99% chance of damaging wind over 30 yrs
- Air quality 2/10 Low 1 unhealthy d/yr today · 3 by 30 yrs out
Nearby sold comps map
Loading sold comps map…
Walkable amenities ~0.75 mi
Loading nearby amenities…
Taxation est. · year 1
- Rental income
- $22,458
- − Mortgage interest
- −$14,004
- − Property taxes
- −$623
- − Insurance
- −$1,250
- − Repairs & maintenance
- −$1,797
- − Management
- −$1,797
- − HOA
- −$108
- − Depreciation
- −$7,273
- Taxable loss
- −$4,392
- Est. tax savings @ 24.0%
- +$1,054
- After-tax cash flow
- $1,083/yr
For passive investors: Depreciation is non-cash, so a rental often shows a tax loss while cash-flowing — sheltering income. Rental losses are passive: they offset passive income freely, and up to $25,000/yr can offset ordinary (W-2) income if you actively participate and your MAGI is under $100k (phasing out to $0 by $150k); unused losses carry forward. On sale, claimed depreciation is recaptured at up to 25%, and gains may owe capital-gains tax (a 1031 exchange can defer both). Figures are a year-1 estimate at your 24.0% rate — not tax advice; consult a CPA.
Schools (NCES district)
- District
- Pasco
- NCES district ID
- 1201530
- Math proficiency
- 50% ▼ -10.00%
- Reading proficiency
- 52% ▼ -5.00%
- Median HH income
- $45,039
- Composite
- 43.14/100
- National rank
- #3074
- State rank
- #32 of 73 in FL
Livability — Bayonet Point
- Score
- 69/100
- State rank
- #485
- US rank
- #8934
Category grades
Schools grade is shown separately in the Schools card above.
Census & demographics
- Census place
- Bayonet Point, FL
- County
- Pasco County · 524,098 people
- Metro
- Tampa-St. Petersburg-Clearwater, FL
- Population (ZIP)
- 30,689
- Household income
- $51,280
- Rent vs Own
- Severe rent burden
- 946.0
Population outlook (Pasco County) Hauer SSP2
- Today (2025)
- 570,045 people
- By 2030
- 605,844 · +6.3%
- By 2040
- 674,806 · +18.4%
- By 2050
- 736,022 · +29.1%
- By 2075
- 862,900 · +51.4%
- By 2100
- 906,364 · +59.0%
Race, ethnicity, and origin ACS 2023
- Neighborhood character
- Predominantly White (86%)
- Race & ethnicity
- White 86% Hispanic / Latino 7% Two or more races 6% Black 2% Asian 2%
- Hispanic origin (detail)
- Mexican 1% Puerto Rican 2%
- Common ancestry
- Romanian 4% Lithuanian 3% Slovak 2%
- Foreign-born
- 7% · Canada, Jamaica, Vietnam
- Languages at home
- 91% English-only · Spanish 5% Other Indo-European 2% French/Haitian/Cajun 0%
Political lean MEDSL · Pasco
- 2024 margin
- Strong R (+25.2) · D 36.9% · R 62.1% · Other 1.0%
- 2008→2024 swing
- -21.6pp toward R · 2008: -3.6pp · 2024: -25.2pp
- All cycles
- 2024: R+25.2 2020: R+20.1 2016: R+21.6 2012: R+6.7 2008: R+3.6
Not yet ingested
- Civics
- —
Market trends
- HPI YoY
- ▼ -183.96%
- Current HPI
- 307.5552
- Rent YoY
- ▼ -2.26%
- Metro
- Tampa-St. Petersburg-Clearwater, FL
- State GDP YoY
- ▲ 3.28%
- F500 in state
- 36
Industry mix (Fortune 500 HQ in FL)
| Industry | F500 HQs | Revenue |
|---|---|---|
| Industrial Technology | 2 | $29B |
|
||
| Insurance | 2 | $17B |
|
||
| Retail | 1 | $60B |
|
||
| Technology Distribution | 1 | $58B |
|
||
| Homebuilding | 1 | $35B |
|
||
| Technology Manufacturing | 1 | $35B |
|
||
Price history
+306.5% since first listed6 events — show timeline
- 2026-05-15 Relisted — Stellar MLS as Distributed by MLS Grid
- 2026-05-14 Listed $250,000 Stellar MLS as Distributed by MLS Grid
- 2007-01-11 Listed $169,900 Stellar MLS as Distributed by MLS Grid
- 2001-09-10 Sold (Public Records) $82,500 Public Records
- 1997-02-05 Sold (Public Records) $55,000 Public Records
- 1987-04-01 Sold (Public Records) $61,500 Public Records
Property tax history
+0.5%/yrLatest (2025): $623 · +2.3% YoY. Source: county tax records.
Cash-flow waterfall
monthlySold comps — $/sqft
last 12 mo · ≤1 miLoading sold comps…