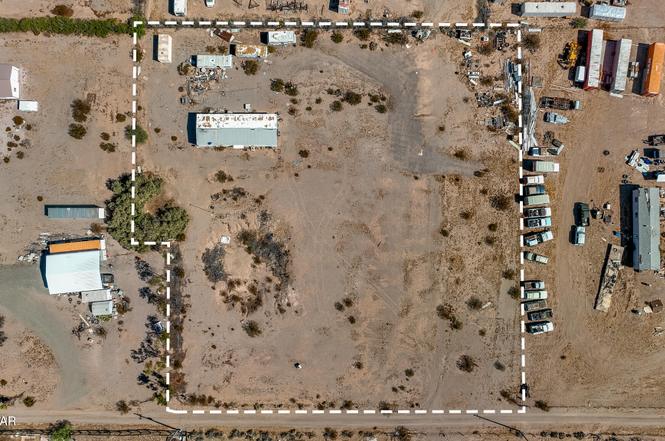
44129 Sandy Loam Ln · Bouse, AZ
Flood risk 1/10 · Minimal
- FEMA flood zone
- AE
- Chance of flooding over 30 yrs
- 0.0%
- Est. flood insurance / yr
- $1,737 – $8,500
Fire risk 5/10 · Moderate
- Est. fire insurance / yr
- $610 – $1,132
Heat risk 9/10 · Severe
- Hot days now (above 115°F)
- 7 days/yr
- Hot days in 30 yrs
- 17 days/yr
Wind risk 1/10 · Minimal
- Chance of severe wind over 30 yrs
- —
Air-quality risk 2/10 · Minimal
- Unhealthy air days now
- 1 days/yr
- Unhealthy air days in 30 yrs
- 1 days/yr
Risk factors via First Street. Map © Google.
Why this score? — see what drove the B grade
The composite is a weighted blend of 9 inputs, each scored 0–100. Each bar is that input's sub-score; the figure is the points it added to the 100-point composite (weight × sub-score).
- Cash flow +30.0/30.0
- 1% rule +10.0/10.0
- DSCR +10.0/10.0
- ARV discount +7.5/15.0
- Appreciation +6.6/10.0
- Livability +3.1/5.0
- Rent growth +2.5/5.0
- Condition / age +2.5/5.0
- Schools +2.1/10.0
$55,000
🖨 Deal sheet 📄 Offer letter ✓ Due diligence
Listing remarks
Nestled in the stark beauty of the Sonoran Desert, 44129 Sandy Loam Lane, offers a captivating desert oasis that serves as a serene escape from the arid landscape. Handyman Special on 2 Acres! Remodel or put a brand new home. 2 Acres of vast land in scenic Bouse. Shipping container included with the sell of the property. Electric to the property. Bouse is a small and charming town surrounded by a network of trails that wind through rugged terrain and offer breathtaking vistas of the desert's rugged beauty. Just a short drive away lies the Kofa National Wildlife Refuge, a sprawling sanctuary that provides a haven for a diverse array of wildlife, including desert bighorn sheep and rare bird s
Key facts
- Desert oasis
- Septic put in 2004
- 2 acres land
Tags
Property features AI
Finance
- Other: Zoned P-RA (Rural Area); Lot about 2.12 acres
Exterior
- Parking: No parking specified
- Utilities: 200+ amp electrical service; Septic tank; Other water source
- Home design: Single-story manufactured home; Manufactured by Lancer
- Construction: Vertical siding; Built as a manufactured home; Mobile dimensions approximately 24 ft wide by 68 ft long
- Exterior features: Chain link fencing; Shingle roof; Unimproved road frontage
Interior
- Bathrooms: 2 full bathrooms
- Heating & cooling: No central heating; No central cooling
- Interior features: Has a view
Neighborhood map
What this means for you Summary
Snapshot
- This is a 3-bed/2.0-bath manufactured listed at $55k.
Deal economics
- At list price, monthly cash flow is $253 ($3k/yr) — positive.
- The deal already cash-flows at list — no discount required.
- Meets the 1% rule at list price ($1k rent vs $55k).
- Recommended offer: $48k (12.0% below list) — sets the bar for market timing.
Location & tenants
- Location reads 62/100 on livability (#136 in AZ) — a middle-class / working-renter tenant base. Strengths: cost of living A+, crime A-, housing B+; Watch: health & safety C-, schools F, amenities F.
- Bouse Elementary District (4513) (rural): math 21% / reading 21% proficiency, ranked #364 of 501 in AZ (top 73%) — low school quality limits family demand, transient renter base, plan for 1-2y turnover.
- Market conditions: 64 active listings in the ZIP; 92 units permitted in La Paz County in 2024 (0 in 5+ unit buildings).
Forward outlook
- In year one you build about $2k of equity ($380 loan paydown + $2k appreciation (3.1% local appreciation)).
- La Paz County population projected at -11% by 2050 — secular population decline; favor cash flow + early exit over multi-decade hold.
- At projected returns (3.1% appreciation + 3.0% rent growth), your $15k cash investment doubles in ~3 years — after that, you're playing with house money.
Negotiation context
- It's been on market 476 days — a 12% lower offer ($48k) is reasonable based on typical stale-listing flexibility.
- 4 sale attempts since 2y ago; this cycle's ask has dropped $80k (59%) from the opening price — seller is motivated, your offer sets the floor, not the list.
Risks & watch-outs
- Watch-outs: flood insurance adds $427/mo.
- Climate carrying-cost: in FEMA flood zone AE (mandatory federal flood insurance); moderate wildfire risk; extreme-heat days projected 7→17/yr by 2055 (HVAC capex compounding) — expect insurance premiums to compound above CPI over the hold.
Questions for the listing agent
- It's been on market 476 days. Have you received any prior offers? Is the seller open to a 12% concession, seller financing, or rate buy-down credit?
- Built in 1972 — when were the roof, HVAC, electrical panel, plumbing, and water heater last replaced?
- What's the actual annual flood-insurance premium (NFIP or private), and is the property in a SFHA with mandatory coverage?
- Why hasn't it sold? Are there any deal-killer items the seller is aware of (foundation, flood, title, zoning, code violations)?
- Is there a deadline driving the sale (1031 exchange, divorce, estate, relocation)? That informs how much negotiation room exists.
- Schools are F-rated, which usually means shorter tenancies and higher turnover. Who's the typical renter profile here, and what's been the actual vacancy rate?
- What's the average days-on-market for RENTAL listings here right now (not sales)? A rising rental-DOM trend means longer vacancies and softer asking-rent achievability than the comps imply.
- What's the recent tenant-quality profile in this submarket — average credit score on applications, eviction rate, late-payment / NSF rate, and stable-employment percentage? A property-management company in the area should have these aggregated.
- How much new for-sale + rental construction is in the pipeline within 1–3 miles? Heavy new supply typically softens prices + rents 12–24 months out; constrained supply supports both.
Investment metrics
- 1% rule
- 2.44% ✓
- Cap rate
- 21.12%
- Cash-on-cash
- 52.95%
- DSCR
- 3.36
- GRM
- 3.4
CMA / ARV
- ARV (on-the-fly)
- $35,328
- Comps found
- 1
Show comp detail 1 sale within ~0.75 mi
| Address | Dist | Beds/Ba | Sqft | Sold | Price | $/sf | Match |
|---|---|---|---|---|---|---|---|
| 44129 Sandy Loam Ln | 0.00mi | 3/2.0 | 1,536 (0%) | 0mo | $35,000 | $23 | 100 |
Match score weights: distance 35% · size 25% · config 20% · recency 20%. Top-matched comps best support the ARV.
Projected returns pro-forma
3.12% appreciation · 3.0% rent growth · sell at horizon
- IRR
- 26.5%
- Equity multiple
- 2.52×
- Total profit
- $23,367
- Equity at exit
- $25,096
- IRR
- 27.3%
- Equity multiple
- 4.93×
- Total profit
- $60,572
- Equity at exit
- $38,964
Cash invested: $15,400 (down + closing). Projections, not guarantees.
Landlord ↔ Tenant lean methodology
- Overall (STATE)
- 87 Strongly Landlord-Friendly
- State Arizona
- 87 Strongly Landlord-Friendly · R+3
- County
- — inherits STATE
- City
- — inherits STATE
ZIP-level market 85325
- Home prices YoY
- 2.6%
- Active inventory
- 64
- Price-to-rent
- 3.4×
Monthly cashflow live
- Estimated rent
- $1,341 medium interval (Pro) →
- Mortgage (P&I)
- −$288
- Tax est. 1.5%
- −$69 /mo · $825/yr
- Insurance
- −$23
- Flood insurance flood zone
- −$427 /mo · $5,118/yr
- HOA
- −$0
- Vacancy / Maint / Mgmt
- −$282
- Net cashflow
- $253
Break-even live
UW: 25.0% down · 7.5% · 30yr · 1.5% tax · 5.0% vac · 8.0% maint · 8.0% mgmt
Financing live
Cash to close
- Down payment
- $13,750
- Closing costs
- $1,650
- Reserves months
- —
- Total cash needed
- —
Loan-product check · same deal, 3 products live
Conventional
25% down · 7.5% · 30yr
- Down + closing
- —
- Monthly P&I
- —
- Monthly cashflow
- —
- DSCR
- —
- Eligible?
- —
Personal DTI + credit; lowest rate.
DSCR
20% down · 8.5% · 30yr
- Down + closing
- —
- Monthly P&I
- —
- Monthly cashflow
- —
- DSCR
- —
- Eligible?
- —
No personal income docs; deal must DSCR.
Hard money
10% down · 12.0% · 12mo
- Down + closing
- —
- Monthly P&I
- —
- Monthly cashflow
- —
- DSCR
- —
- Eligible?
- —
Short-term bridge; refi at stabilization.
Listing history 20 events
-
2026-06-07statusdays on market $55,000 Pending 476 DOM
-
2026-06-03days on market $55,000 Active 475 DOM
-
2026-06-02days on market $55,000 Active 474 DOM
-
2026-06-01days on market $55,000 Active 473 DOM
-
2026-05-31days on market $55,000 Active 472 DOM
-
2026-05-30days on market $55,000 Active 471 DOM
-
2026-03-05status Active
-
2026-02-26price $55,000
-
2026-01-14price $64,500
-
2025-11-07price $69,500
-
2025-10-30status Active
-
2025-09-10status Pending
-
2025-09-02status Active
-
2025-07-16price $75,000
-
2025-04-22price $79,750
-
2025-03-18price $85,000
-
2025-02-13price $90,000
-
2025-01-06price $96,500
-
2024-09-25price $112,500
-
2024-08-19$135,000 Active
ⓘ Source: listings_history table (triggers on properties + properties_extension) + one-shot
backfill from property_details.listing_events for pre-trigger history.
Climate risk First Street
- Flood 1/10 Low FEMA zone AE · 0% chance over 30 yrs
- Wildfire 5/10 Major
- Heat 9/10 Extreme 7 d/yr ≥115°F today · 17 d/yr by 30 yrs out
- Wind 1/10 Low
- Air quality 2/10 Low 1 unhealthy d/yr today · 1 by 30 yrs out
Nearby sold comps map
Loading sold comps map…
Walkable amenities ~0.75 mi
Loading nearby amenities…
Taxation est. · year 1
- Rental income
- $16,096
- − Mortgage interest
- −$3,081
- − Property taxes
- −$825
- − Insurance
- −$5,394
- − Repairs & maintenance
- −$1,288
- − Management
- −$1,288
- − Depreciation
- −$1,600
- Taxable income
- $2,621
- Est. tax owed @ 24.0%
- −$629
- After-tax cash flow
- $2,407/yr
For passive investors: Depreciation is non-cash, so a rental often shows a tax loss while cash-flowing — sheltering income. Rental losses are passive: they offset passive income freely, and up to $25,000/yr can offset ordinary (W-2) income if you actively participate and your MAGI is under $100k (phasing out to $0 by $150k); unused losses carry forward. On sale, claimed depreciation is recaptured at up to 25%, and gains may owe capital-gains tax (a 1031 exchange can defer both). Figures are a year-1 estimate at your 24.0% rate — not tax advice; consult a CPA.
Schools (NCES district)
- District
- Bouse Elementary District (4513)
- NCES district ID
- 0401290
- Math proficiency
- 21% ▬ 0.00%
- Reading proficiency
- 21% ▬ 0.00%
- Median HH income
- $35,929
- Composite
- 20.6/100
- National rank
- #13764
- State rank
- #364 of 501 in AZ
Livability — Bouse
- Score
- 62/100
- State rank
- #136
- US rank
- #16589
Category grades
Schools grade is shown separately in the Schools card above.
Census & demographics
- Census place
- Bouse, AZ
- Population (ZIP)
- 1,123
Population outlook (La Paz County) Hauer SSP2
- Today (2025)
- 18,409 people
- By 2030
- 17,592 · -4.4%
- By 2040
- 16,600 · -9.8%
- By 2050
- 16,328 · -11.3%
- By 2075
- 17,075 · -7.2%
- By 2100
- 17,042 · -7.4%
Race, ethnicity, and origin ACS 2023
- Neighborhood character
- Predominantly White (99%)
- Race & ethnicity
- White 99% Two or more races 1%
- Common ancestry
- Iranian 3% Romanian 3% Slovak 3%
- Foreign-born
- 1%
Political lean MEDSL · La Paz
- 2024 margin
- Solid R (+44.2) · D 27.6% · R 71.8%
- 2008→2024 swing
- -15.7pp toward R · 2008: -28.5pp · 2024: -44.2pp
- All cycles
- 2024: R+44.2 2020: R+38.8 2016: R+41.8 2012: R+32.2 2008: R+28.5
Not yet ingested
- Civics
- —
Market trends
- HPI YoY
- ▲ 3.12%
- Current HPI
- 121.9498
- Rent YoY
- —
- Metro
- —
- State GDP YoY
- ▲ 4.54%
- F500 in state
- 20
Industry mix (Fortune 500 HQ in AZ)
| Industry | F500 HQs | Revenue |
|---|---|---|
| Technology | 2 | $13B |
|
||
| Mining / Metals | 1 | $23B |
|
||
| Environmental Services | 1 | $16B |
|
||
| Metals / Steel | 1 | $14B |
|
||
| Technology Distribution | 1 | $9B |
|
||
| Homebuilding | 1 | $8B |
|
||
Price history
-59.3% since first listed14 events — show timeline
- 2026-03-05 Relisted — LHAR
- 2026-02-26 Price Changed $55,000 LHAR
- 2026-01-14 Price Changed $64,500 LHAR
- 2025-11-07 Price Changed $69,500 LHAR
- 2025-10-30 Relisted — LHAR
- 2025-09-10 Pending — LHAR
- 2025-09-02 Relisted — LHAR
- 2025-07-16 Price Changed $75,000 LHAR
- 2025-04-22 Price Changed $79,750 LHAR
- 2025-03-18 Price Changed $85,000 LHAR
- 2025-02-13 Price Changed $90,000 LHAR
- 2025-01-06 Price Changed $96,500 LHAR
- 2024-09-25 Price Changed $112,500 LHAR
- 2024-08-19 Listed $135,000 LHAR
Cash-flow waterfall
monthlySold comps — $/sqft
last 12 mo · ≤1 miLoading sold comps…