 Triplex
304 Anderson Ct · Sacramento, CA
Flood risk 5/10 · Moderate
- FEMA flood zone
- X (unshaded)
- Chance of flooding over 30 yrs
- 0.64%
- Est. flood insurance / yr
- $507 – $1,088
Fire risk 1/10 · Minimal
- Est. fire insurance / yr
- $659 – $1,223
Heat risk 7/10 · Major
- Hot days now (above 102°F)
- 7 days/yr
- Hot days in 30 yrs
- 15 days/yr
Wind risk 1/10 · Minimal
- Chance of severe wind over 30 yrs
- —
Air-quality risk 10/10 · Severe
- Unhealthy air days now
- 33 days/yr
- Unhealthy air days in 30 yrs
- 38 days/yr
Risk factors via First Street. Map © Google.
Why this score? — see what drove the B+ grade
The composite is a weighted blend of 9 inputs, each scored 0–100. Each bar is that input's sub-score; the figure is the points it added to the 100-point composite (weight × sub-score).
- Cash flow +30.0/30.0
- ARV discount +15.0/15.0
- 1% rule +10.0/10.0
- DSCR +10.0/10.0
- Livability +3.6/5.0
- Schools +3.2/10.0
- Condition / age +2.5/5.0
- Rent growth +1.8/5.0
- Appreciation +0.0/10.0
$300,000
🖨 Deal sheet 📄 Offer letter ✓ Due diligence
Multi-family units
County records classify this as Multi-Family (2-4 Unit). Listing-text estimate: 3 units. confirmed
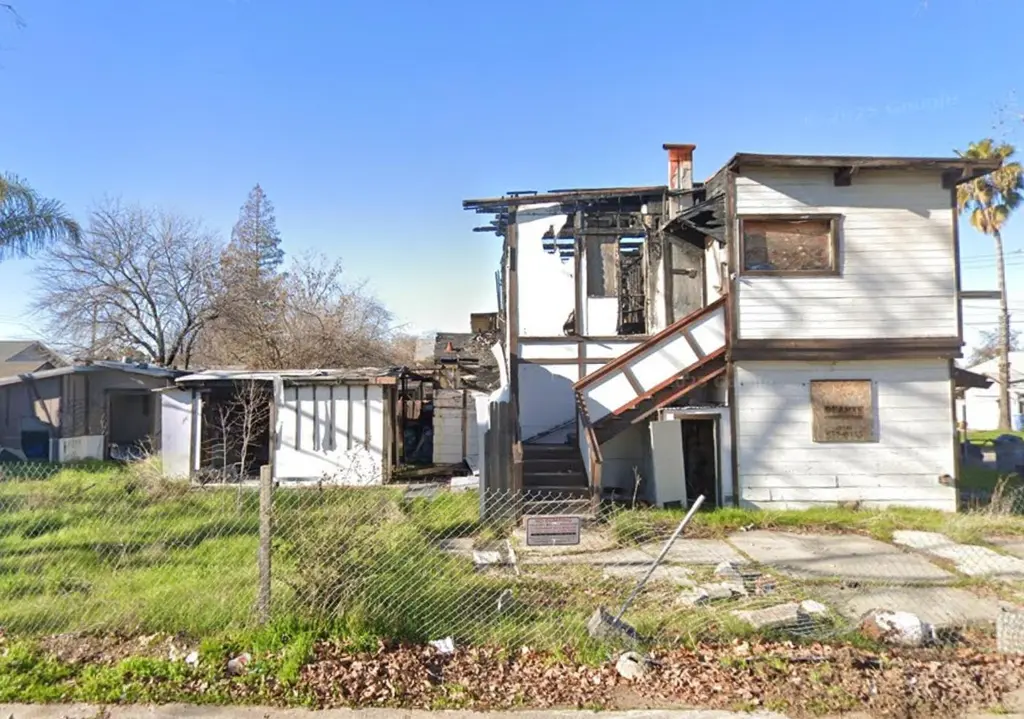
Listing remarks
Investor Special! Rare opportunity to acquire a fire-damaged triplex on a corner lot in Sacramento. The property consists of three 2-bedroom, 1-bath units with the existing structure still in place. Seller has completed all necessary cleanup, providing a head start for redevelopment or restoration. Included are plans for a potential 4th unit, offering added value and future upside. Situated on a 3,920 SF corner lot with a 1,483 SF building, this is an ideal project for investors, contractors, and developers looking to unlock the property's full potential.
Key facts
- 3
- Existing structure
- 920 sf corner lot
Tags
Property features AI
Finance
- Other: Zoning: R-1A-SPD
- Financial info: Property is a 3-unit triplex; all 3 units currently vacant
- HOA & community: No association fee
Exterior
- Parking: Parking: see remarks
- Security: Security features: see remarks
- Utilities: Utilities: other; Sewer: see remarks; Water source: see remarks
- Home design: Residential income property (triplex); 2 stories; 1 building
- Construction: Built in 1942; Composition roof; Construction materials: see remarks; Foundation details: see remarks
- Exterior features: Corner lot; Property condition: fixer; Security features: see remarks
Interior
- Bedrooms: Total of 6 bedrooms
- Flooring: Flooring: see remarks
- Bathrooms: 3 full bathrooms
- Heating & cooling: Heating: see remarks; Cooling: see remarks
- Interior features: Laundry features listed as 'Other'; Heating: see remarks; Cooling: see remarks
- Laundry & utility: Laundry features listed as 'Other'
Neighborhood map
What this means for you Summary
Snapshot
- This is a 3 × 2-bed/1.0-bath units multifamily listed at $300k.
Deal economics
- At list price, monthly cash flow is $1k ($18k/yr) — positive. Per door: $492/mo.
- The deal already cash-flows at list — no discount required.
- Meets the 1% rule at list price ($5k rent vs $300k).
- Cap rate 12.2% vs local median 3.0% in Sacramento — top-decile yield for the area; either an underpriced asset or a hidden risk that comps aren't pricing in. Stress-test before assuming the spread holds.
Location & tenants
- Location reads 71/100 on livability (#218 in CA) — a middle-class / working-renter tenant base. Strengths: amenities A+, commute A+, housing A; Watch: schools D+, crime F, cost of living F.
- Robla Elementary (urban): math 29% / reading 38% proficiency, ranked #923 of 1,400 in CA (top 66%) — families likely to look elsewhere, expect single-tenant / working-renter base with shorter leases; 77% free/reduced lunch — lower-income household profile, screen leases tightly.
- Market conditions: Rents soft (-2.7%/yr); 162 active listings in the ZIP; 11 comparable units currently listed for rent nearby; rentals at typical pace (median 16d on market — plan ~3-4 weeks tenant-placement turnaround); 6,825 units permitted in Sacramento County in 2024 (1,752 in 5+ unit buildings).
- At $4,558/mo this rent would consume 80% of the median local household income ($68k/yr) (locally 1834% of renters already pay >50% of income on rent) — very limited rent-growth headroom before tenants either downsize or default.
Forward outlook
- Local home prices are declining (-3.0%/yr); year-one equity from $2k of loan paydown is wiped out by about $9k of value loss. Plan a longer hold.
- Sacramento County population projected at +17% by 2050 — long-run rental-demand tailwind backs the buy-and-hold thesis.
- At projected returns (-3.0% appreciation + 0.0% rent growth), your $84k cash investment doubles in ~8 years — after that, you're playing with house money.
Negotiation context
- Only 5 days on market — expect competitive offers; lowballing is unlikely to land.
- Current owner paid $199k; list at $300k implies a 51% gain — meaningful room to come down on a strong offer.
Risks & watch-outs
- Watch-outs: built in 1942 — expect roof / HVAC / electrical / plumbing capex.
- Climate carrying-cost: moderate flood risk; extreme-heat days projected 7→15/yr by 2055 (HVAC capex compounding) — expect insurance premiums to compound above CPI over the hold.
Questions for the listing agent
- Can we see the unit-by-unit rent roll, current vacancy, and any below-market leases? What's the average tenancy length?
- What capital expenditures (roof, boiler, parking lot, exteriors) have been made in the last 5 years, and what's planned in the next 2?
- Built in 1942 — when were the roof, HVAC, electrical panel, plumbing, and water heater last replaced?
- Is there a deadline driving the sale (1031 exchange, divorce, estate, relocation)? That informs how much negotiation room exists.
- Schools are D-rated, which usually means shorter tenancies and higher turnover. Who's the typical renter profile here, and what's been the actual vacancy rate?
- Crime grade is F in this area — have there been break-ins, vandalism, or insurance claims at this property in the last 3 years? What carrier currently insures it and at what premium?
- What's the average days-on-market for RENTAL listings here right now (not sales)? A rising rental-DOM trend means longer vacancies and softer asking-rent achievability than the comps imply.
- What's the recent tenant-quality profile in this submarket — average credit score on applications, eviction rate, late-payment / NSF rate, and stable-employment percentage? A property-management company in the area should have these aggregated.
- How much new apartment / multifamily construction is in the pipeline within 1–3 miles? Heavy new supply (>2% of stock underway) typically softens rents 12–24 months out; light construction supports rent growth.
Investment metrics
- 1% rule
- 1.52% ✓
- Cap rate
- 12.19%
- Cash-on-cash
- 21.07%
- DSCR
- 1.94
- GRM
- 5.5
CMA / ARV
- ARV (on-the-fly)
- $498,288
- Comps found
- 4
Show comp detail 4 sales within ~0.75 mi
| Address | Dist | Beds/Ba | Sqft | Sold | Price | $/sf | Match |
|---|---|---|---|---|---|---|---|
| 1962 Grand Ave | 0.37mi | 4/2.0 (+1) | 1,414 (-5%) | 10mo | $475,000 | $336 | 58 |
| 1744 - 1748 South Ave | 0.55mi | 4/2.0 (+1) | 1,500 (+1%) | 12mo | $542,000 | $361 | 54 |
| 121 Tinker Way | 0.35mi | 4/2.0 (+1) | 1,369 (-8%) | 15mo | $450,000 | $329 | 49 |
| 4100 Wheatley Cir | 0.56mi | 4/2.0 (+1) | 1,657 (+12%) | 19mo | $415,000 | $250 | 30 |
Match score weights: distance 35% · size 25% · config 20% · recency 20%. Top-matched comps best support the ARV.
Projected returns pro-forma
-3.0% appreciation · 0.0% rent growth · sell at horizon
- IRR
- 10.0%
- Equity multiple
- 1.38×
- Total profit
- $32,074
- Equity at exit
- $44,731
- IRR
- 16.5%
- Equity multiple
- 2.16×
- Total profit
- $97,684
- Equity at exit
- $25,939
Cash invested: $84,000 (down + closing). Projections, not guarantees.
Landlord ↔ Tenant lean methodology
- Overall (STATE)
- 18 Strongly Tenant-Friendly
- State California
- 18 Strongly Tenant-Friendly · D+13
- County
- — inherits STATE
- City
- — inherits STATE
ZIP-level market 95838
- Rents YoY
- -2.7%
- Active inventory
- 162
- Price-to-rent
- 16.5×
Monthly cashflow live
- Estimated rent
- $4,558 medium interval (Pro) →
- Mortgage (P&I)
- −$1,573
- Tax from tax record
- −$428 /mo · $5,131/yr
- Insurance
- −$125
- HOA
- −$0
- Vacancy / Maint / Mgmt
- −$957
- Net cashflow
- $1,475
Break-even live
3-unit breakdown (identical units grouped — click to expand)
| Units | Beds | Baths | Est. rent |
|---|---|---|---|
| 3× units | 2 | 1 | $4,557 |
| #1 | 2 | 1 | $1,519 |
| #2 | 2 | 1 | $1,519 |
| #3 | 2 | 1 | $1,519 |
| Total (3 units) | $4,558 | ||
UW: 25.0% down · 7.5% · 30yr · 1.5% tax · 5.0% vac · 8.0% maint · 8.0% mgmt
Financing live
Cash to close
- Down payment
- $75,000
- Closing costs
- $9,000
- Reserves months
- —
- Total cash needed
- —
Loan-product check · same deal, 3 products live
Conventional
25% down · 7.5% · 30yr
- Down + closing
- —
- Monthly P&I
- —
- Monthly cashflow
- —
- DSCR
- —
- Eligible?
- —
Personal DTI + credit; lowest rate.
DSCR
20% down · 8.5% · 30yr
- Down + closing
- —
- Monthly P&I
- —
- Monthly cashflow
- —
- DSCR
- —
- Eligible?
- —
No personal income docs; deal must DSCR.
Hard money
10% down · 12.0% · 12mo
- Down + closing
- —
- Monthly P&I
- —
- Monthly cashflow
- —
- DSCR
- —
- Eligible?
- —
Short-term bridge; refi at stabilization.
Rent comps 11 comps
| Address | Beds | Baths | Sqft | Rent | $/sqft | DOM | Units | Dist |
|---|---|---|---|---|---|---|---|---|
| 3720 Astoria St Unit 8 Sacramento, CA | 2.0 | 1.0 | 950 | $1,395 | $1.47 | 1d | 1 | 0.63mi |
| 1138 North Ave Unit A Sacramento, CA | 3.0 | 2.0 | 900 | $2,000 | $2.22 | 1d | 1 | 0.83mi |
| 4426 Dry Creek Rd Sacramento, CA | 3.0 | 2.5 | 1408 | $2,700 | $1.92 | 1d | 1 | 0.90mi |
| 3829 Belden St Sacramento, CA | 2.0 | 2.0 | 1001 | $2,126 | $2.12 | 43d | 1 | 0.94mi |
| 3226 Pilgrim Ct Sacramento, CA | 3.0 | 1.0 | 1300 | $2,700 | $2.08 | 1d | 1 | 0.95mi |
| 4015 May St Sacramento, CA | 2.0 | 1.5 | 875 | $1,850 | $2.11 | 23d | 1 | 0.99mi |
| 917 Blaine Ave Sacramento, CA | 4.0 | 2.0 | 1558 | $3,000 | $1.93 | 1d | 1 | 1.10mi |
| 3231 Del Mar Way Sacramento, CA | 3.0 | 1.0 | 1380 | $2,095 | $1.52 | 16d | 1 | 1.11mi |
| 2256 Frazier Ct Unit ADU Sacramento, CA | 3.0 | 1.5 | 917 | $2,350 | $2.56 | 43d | 1 | 1.39mi |
| 2253 Edison Ave Sacramento, CA | 3.0 | 1.0 | 980 | $2,400 | $2.45 | 43d | 1 | 1.42mi |
| 2344 Jill Way Sacramento, CA | 3.0 | 1.0 | 950 | $1,850 | $1.95 | 43d | 1 | 1.49mi |
Listing history 6 events
-
2026-06-18days on market $300,000 Active 5 DOM
-
2026-06-17days on market $300,000 Active 4 DOM
-
2026-06-16days on market $300,000 Active 3 DOM
-
2026-06-15days on market $300,000 Active 2 DOM
-
2026-06-13remarks 561-char remark
-
2026-06-13$300,000 Active 1 DOM
ⓘ Source: listings_history table (triggers on properties + properties_extension) + one-shot
backfill from property_details.listing_events for pre-trigger history.
Tax reassessment forecast CA · Resets to sale price
- Current annual tax
- $5,131 · $428/mo
- Projected year-2 tax
- $5,131 · $428/mo
- Expected delta
- $0/yr ($0/mo · 0.0%)
ⓘ Screening estimate from a state-policy table — verify with the county assessor before closing.
Climate risk First Street
- Flood 5/10 Major FEMA zone X (unshaded) · 64% chance over 30 yrs
- Wildfire 1/10 Low
- Heat 7/10 Severe 7 d/yr ≥102°F today · 15 d/yr by 30 yrs out
- Wind 1/10 Low
- Air quality 10/10 Extreme 33 unhealthy d/yr today · 38 by 30 yrs out
Nearby sold comps map
Loading sold comps map…
Walkable amenities ~0.75 mi
Loading nearby amenities…
Taxation est. · year 1
- Rental income
- $54,696
- − Mortgage interest
- −$16,805
- − Property taxes
- −$5,131
- − Insurance
- −$1,500
- − Repairs & maintenance
- −$4,376
- − Management
- −$4,376
- − Depreciation
- −$8,727
- Taxable income
- $13,782
- Est. tax owed @ 24.0%
- −$3,308
- After-tax cash flow
- $14,392/yr
For passive investors: Depreciation is non-cash, so a rental often shows a tax loss while cash-flowing — sheltering income. Rental losses are passive: they offset passive income freely, and up to $25,000/yr can offset ordinary (W-2) income if you actively participate and your MAGI is under $100k (phasing out to $0 by $150k); unused losses carry forward. On sale, claimed depreciation is recaptured at up to 25%, and gains may owe capital-gains tax (a 1031 exchange can defer both). Figures are a year-1 estimate at your 24.0% rate — not tax advice; consult a CPA.
Schools (NCES district)
- District
- Robla Elementary
- NCES district ID
- 0633240
- Math proficiency
- 29% ▲ 1.00%
- Reading proficiency
- 38% ▲ 3.00%
- Median HH income
- $48,481
- Composite
- 31.64/100
- National rank
- #11126
- State rank
- #923 of 1400 in CA
Livability — Sacramento
- Score
- 71/100
- State rank
- #218
- US rank
- #6957
Category grades
Schools grade is shown separately in the Schools card above.
Census & demographics
- Census place
- Sacramento, CA
- County
- Sacramento County · 1,539,646 people
- City population
- 761,410
- Metro
- Sacramento-Roseville-Folsom, CA
- Population (ZIP)
- 40,677
- Household income
- $68,349
- Rent vs Own
- Severe rent burden
- 1834.0
Population outlook (Sacramento County) Hauer SSP2
- Today (2025)
- 1,660,763 people
- By 2030
- 1,732,990 · +4.3%
- By 2040
- 1,855,755 · +11.7%
- By 2050
- 1,941,335 · +16.9%
- By 2075
- 2,046,162 · +23.2%
- By 2100
- 1,961,444 · +18.1%
Race, ethnicity, and origin ACS 2023
- Neighborhood character
- Highly diverse neighborhood (Simpson 0.77)
- Race & ethnicity
- Hispanic / Latino 37% White 21% Asian 18% Two or more races 15% Black 13% Pacific Islander 2%
- Hispanic origin (detail)
- Mexican 33%
- Common ancestry
- Scotch-Irish 2% Subsaharan African 1% Scottish 1%
- Foreign-born
- 25% · Canada, Vietnam, China
- Languages at home
- 55% English-only · Spanish 22% Other Asian/Pacific 10% Other Indo-European 5%
Political lean MEDSL · Sacramento
- 2024 margin
- D (+19.7) · D 58.1% · R 38.4% · Other 3.5%
- 2008→2024 swing
- +0.7pp no change · 2008: 19.0pp · 2024: 19.7pp
- All cycles
- 2024: D+19.7 2020: D+25.3 2016: D+23.7 2012: D+16.3 2008: D+19.0
Not yet ingested
- Civics
- —
Market trends
- HPI YoY
- ▼ -391.80%
- Current HPI
- 415.1804
- Rent YoY
- ▼ -2.74%
- Metro
- Sacramento-Roseville-Folsom, CA
- State GDP YoY
- ▲ 3.21%
- F500 in state
- 116
Industry mix (Fortune 500 HQ in CA)
| Industry | F500 HQs | Revenue |
|---|---|---|
| Technology | 27 | $1,492B |
|
||
| Financial Services | 3 | $174B |
|
||
| Retail | 3 | $44B |
|
||
| Insurance | 3 | $26B |
|
||
| Media / Entertainment | 2 | $115B |
|
||
| Pharmaceuticals / Biotech | 2 | $62B |
|
||
Price history
+103.4% since first listed4 events — show timeline
- 2026-06-13 Listed $300,000 San Francisco MLS
- 2023-10-27 Sold (Public Records) $199,000 Public Records
- 2020-06-26 Sold (Public Records) $227,000 Public Records
- 2016-07-11 Sold (Public Records) $147,500 Public Records
Property tax history
+16.1%/yrLatest (2025): $5,131 · +87.2% YoY. Source: county tax records.
Cash-flow waterfall
monthlySold comps — $/sqft
last 12 mo · ≤1 miLoading sold comps…