 Multi-family
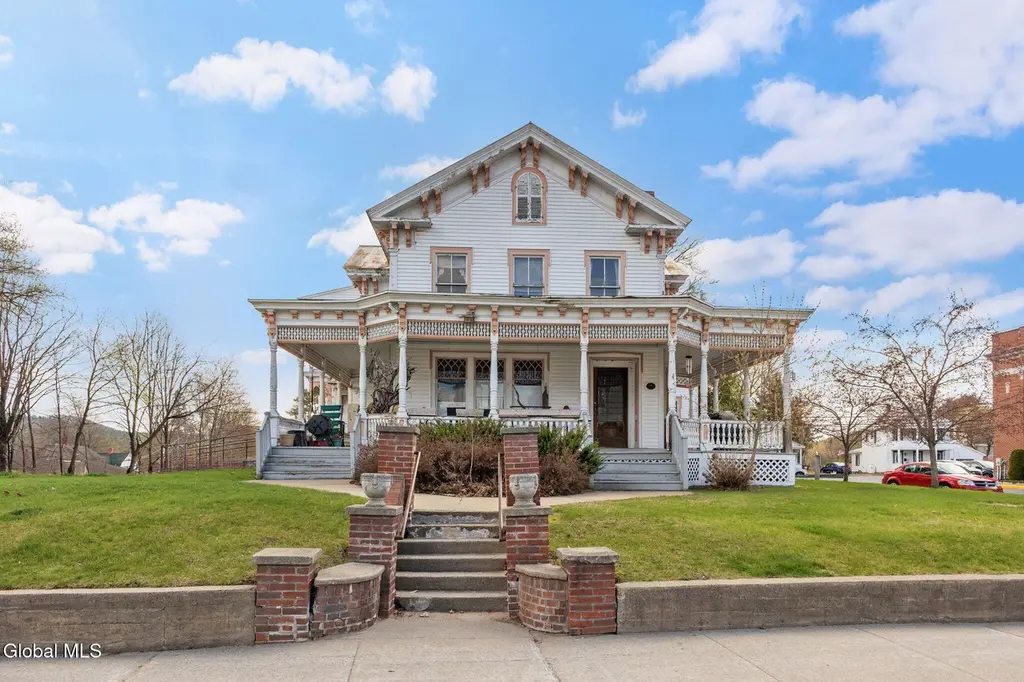
3847 Main St · Warrensburg, NY
Flood risk 1/10 · Minimal
- FEMA flood zone
- X
- Chance of flooding over 30 yrs
- 0.0%
- Est. flood insurance / yr
- $473 – $860
Fire risk 4/10 · Minor
- Est. fire insurance / yr
- $691 – $1,283
Heat risk 2/10 · Minimal
- Hot days now (above 92°F)
- 7 days/yr
- Hot days in 30 yrs
- 17 days/yr
Wind risk 2/10 · Minimal
- Chance of severe wind over 30 yrs
- 2.0%
Air-quality risk 1/10 · Minimal
- Unhealthy air days now
- 0 days/yr
- Unhealthy air days in 30 yrs
- 0 days/yr
Risk factors via First Street. Map © Google.
Why this score? — see what drove the B- grade
The composite is a weighted blend of 9 inputs, each scored 0–100. Each bar is that input's sub-score; the figure is the points it added to the 100-point composite (weight × sub-score).
- Cash flow +19.9/30.0
- ARV discount +15.0/15.0
- Appreciation +10.0/10.0
- DSCR +6.3/10.0
- 1% rule +5.1/10.0
- Schools +4.1/10.0
- Livability +3.2/5.0
- Rent growth +2.5/5.0
- Condition / age +2.5/5.0
$245,000
🖨 Deal sheet (PDF) 📄 Offer letter ✓ Due diligence
Multi-family units
County records classify this as Multi-Family (2-4 Unit). Listing-text estimate: 1 unit. estimate disagrees with records
Listing remarks
History and charm mix with versatile use at this oversized historic Victorian style home. This property is located in the heart of the quaint town of Warrensburg just north of Lake George in the Adirondacks mountains of New York State. Originally built by Miles Thomas, a local merchant, there may be potential for state restoration funding. Currently used as two apartment on first floor with vacant second story that could be office space or converted to more apartments. Road frontage on two streets, with a large parking area and public utilities make this ideal for mixed use as retail, apartments, office or bring your own vision! High traffic count for both local and tourists headed to vaca
Key facts
- Mixed use as retail
- Vacant second story
- Public utilities
Tags
Property features AI
Finance
- Other: Lot is approximately 0.72 acres with road frontage and sloped terrain
Exterior
- Parking: 16 off-street paved parking spaces accessed via driveway
- Utilities: Public water; Public sewer; Cable available; Electric: Other
- Home design: Triplex; Multiple stories (multi-level units)
- Construction: Plaster, vinyl siding and wood siding exterior materials; Stone foundation
- Exterior features: Wrap-around covered front porch
Interior
- Bedrooms: Unit 1: 2 bedrooms; Unit 2: 1 bedroom; Unit 3: 2–3 bedrooms (records list both 2 and 3 for Unit 3)
- Flooring: Tile; Carpet; Hardwood
- Bathrooms: 2 full bathrooms total; Full bath on 1st level; Full bath on 2nd level; Each unit includes a full bath (Unit 1: 1, Unit 2: 1, Unit 3: 1)
- Heating & cooling: Ductless heating; Electric heating; Other heating; Window air conditioning units
- Interior features: Built-in features; Crown molding; Bilco doors and exterior basement entry; Wood-framed windows; Fireplace in the family room
Neighborhood map
What this means for you Summary
Snapshot
- This is a 4-bed/2.0-bath multifamily listed at $245k.
Deal economics
- At list price, monthly cash flow is $297 ($4k/yr) — positive.
- The deal already cash-flows at list — no discount required.
- Meets the 1% rule at list price ($2k rent vs $245k).
- Recommended offer: $238k (3.0% below list) — sets the bar for market timing.
- Cap rate 7.7% vs local median 2.6% in Warrensburg — top-decile yield for the area; either an underpriced asset or a hidden risk that comps aren't pricing in. Stress-test before assuming the spread holds.
Location & tenants
- Location reads 63/100 on livability (#823 in NY) — a middle-class / working-renter tenant base. Strengths: housing A+, cost of living B+, crime B; Watch: amenities F, commute F, health & safety D-.
- Warrensburg Central School District (town): math 47% / reading 44% proficiency, ranked #552 of 755 in NY (top 73%) — families likely to look elsewhere, expect single-tenant / working-renter base with shorter leases.
- Zoned schools: Warrensburg Elementary School (math 37% / reading 52%, grade F, #1,277 of 2,108 statewide, top 64%, 361 students, 58% FRL); Warrensburg Junior-Senior High School (math 62% / reading 57%, grade C+, #851 of 1,100 statewide, top 80%, 302 students, 64% FRL) — zoned schools average 61% FRL vs 39% district-wide (21 pts higher); higher-poverty schools than district average — tighter screening recommended.
- Market conditions: 49 active listings in the ZIP; 180 units permitted in Warren County in 2024 (40 in 5+ unit buildings).
Forward outlook
- In year one you build about $26k of equity ($2k loan paydown + $24k appreciation (10.0% local appreciation)).
- Warren County population projected at -19% by 2050 — secular population decline; favor cash flow + early exit over multi-decade hold.
- At projected returns (10.0% appreciation + 3.0% rent growth), your $69k cash investment doubles in ~3 years — after that, you're playing with house money.
- By year 2, paydown + projected appreciation supports a ~$42k cash-out refi (75% LTV) — recoverable capital for the next deal without selling this one.
Negotiation context
- It's been on market 56 days — a 3% lower offer ($238k) is reasonable based on typical stale-listing flexibility.
- 2 sale attempts with the ask held roughly flat each time — persistent listings suggest the price (not the market) is what's stuck; bring a comps-based counter.
Risks & watch-outs
- Watch-outs: built in 1873 — expect roof / HVAC / electrical / plumbing capex.
Questions for the listing agent
- It's been on market 56 days. Have you received any prior offers? Is the seller open to a 3% concession, seller financing, or rate buy-down credit?
- Built in 1873 — when were the roof, HVAC, electrical panel, plumbing, and water heater last replaced?
- Is there a deadline driving the sale (1031 exchange, divorce, estate, relocation)? That informs how much negotiation room exists.
- Schools are D-rated, which usually means shorter tenancies and higher turnover. Who's the typical renter profile here, and what's been the actual vacancy rate?
- What's the average days-on-market for RENTAL listings here right now (not sales)? A rising rental-DOM trend means longer vacancies and softer asking-rent achievability than the comps imply.
- What's the recent tenant-quality profile in this submarket — average credit score on applications, eviction rate, late-payment / NSF rate, and stable-employment percentage? A property-management company in the area should have these aggregated.
- How much new apartment / multifamily construction is in the pipeline within 1–3 miles? Heavy new supply (>2% of stock underway) typically softens rents 12–24 months out; light construction supports rent growth.
Investment metrics
- 1% rule
- 1.01% ✓
- Cap rate
- 7.75%
- Cash-on-cash
- 5.19%
- DSCR
- 1.23
- GRM
- 8.3
CMA / ARV
- ARV (median comp)
- $480,336
- List price
- $245,000
- Delta
- -48.99%
- Verdict
- UNDERPRICED
- Comps
- 3 within 1.0 mi
Projected returns pro-forma
10.0% appreciation · 3.0% rent growth · sell at horizon
- IRR
- 28.0%
- Equity multiple
- 3.22×
- Total profit
- $152,337
- Equity at exit
- $220,715
- IRR
- 24.4%
- Equity multiple
- 7.32×
- Total profit
- $433,771
- Equity at exit
- $475,981
Cash invested: $68,600 (down + closing). Projections, not guarantees.
Landlord ↔ Tenant lean methodology
- Overall (STATE)
- 15 Strongly Tenant-Friendly
- State New York
- 15 Strongly Tenant-Friendly · D+10
- County
- — inherits STATE
- City
- — inherits STATE
ZIP-level market 12885
- Home prices YoY
- 19.6%
- Active inventory
- 49
- Price-to-rent
- 16.6×
Monthly cashflow live
- Estimated rent
- $2,464 medium interval (Pro) →
- Mortgage (P&I)
- −$1,285
- Tax from tax record
- −$263 /mo · $3,156/yr
- Insurance
- −$102
- HOA
- −$0
- Vacancy / Maint / Mgmt
- −$517
- Net cashflow
- $297
Break-even live
Sensitivity live
| Price | -10% $435 | -5% $366 | +0% $297 | +5% $227 | +10% $158 |
|---|---|---|---|---|---|
| Rent | -10% $102 | -5% $199 | +0% $297 | +5% $394 | +10% $491 |
| Rate | -1.0pp $420 | -0.5pp $359 | base $297 | +0.5pp $233 | +1.0pp $169 |
2-unit breakdown (identical units grouped — click to expand)
| Units | Beds | Baths | Est. rent |
|---|---|---|---|
| 2× units | 2 | 1 | $2,464 |
| #1 | 2 | 1 | $1,232 |
| #2 | 2 | 1 | $1,232 |
| Total (2 units) | $2,464 | ||
UW: 25.0% down · 7.5% · 30yr · 1.5% tax · 5.0% vac · 8.0% maint · 8.0% mgmt
Financing live
Cash to close
- Down payment
- $61,250
- Closing costs
- $7,350
- Reserves months
- —
- Total cash needed
- —
Loan-product check · same deal, 3 products live
Conventional
25% down · 7.5% · 30yr
- Down + closing
- —
- Monthly P&I
- —
- Monthly cashflow
- —
- DSCR
- —
- Eligible?
- —
Personal DTI + credit; lowest rate.
DSCR
20% down · 8.5% · 30yr
- Down + closing
- —
- Monthly P&I
- —
- Monthly cashflow
- —
- DSCR
- —
- Eligible?
- —
No personal income docs; deal must DSCR.
Hard money
10% down · 12.0% · 12mo
- Down + closing
- —
- Monthly P&I
- —
- Monthly cashflow
- —
- DSCR
- —
- Eligible?
- —
Short-term bridge; refi at stabilization.
Listing history 20 events
-
2026-06-21days on market $245,000 Active 56 DOM
-
2026-06-18days on market $245,000 Active 54 DOM
-
2026-06-17days on market $245,000 Active 53 DOM
-
2026-06-16days on market $245,000 Active 52 DOM
-
2026-06-15days on market $245,000 Active 51 DOM
-
2026-06-13days on market $245,000 Active 49 DOM
-
2026-06-12days on market $245,000 Active 48 DOM
-
2026-06-09days on market $245,000 Active 45 DOM
-
2026-06-08days on market $245,000 Active 44 DOM
-
2026-06-07days on market $245,000 Active 43 DOM
-
2026-06-07days on market $245,000 Active 42 DOM
-
2026-06-04days on market $245,000 Active 39 DOM
-
2026-06-02days on market $245,000 Active 38 DOM
-
2026-06-01days on market $245,000 Active 37 DOM
-
2026-05-31days on market $245,000 Active 36 DOM
-
2026-04-23$245,000 Active 746-char remark
-
2026-04-01historical
-
2025-07-18price $254,900
-
2025-06-05price $284,900
-
2025-05-31$275,000 Active
ⓘ Source: listings_history table (triggers on properties + properties_extension) + one-shot
backfill from property_details.listing_events for pre-trigger history.
Tax reassessment forecast NY · Partial reset (capped growth)
- Current annual tax
- $3,156 · $263/mo
- Projected year-2 tax
- $3,648 · $304/mo
- Expected delta
- +$492/yr (+$41/mo · 15.6%)
ⓘ Screening estimate from a state-policy table — verify with the county assessor before closing.
Climate risk First Street
- Flood 1/10 Low FEMA zone X · 0% chance over 30 yrs
- Wildfire 4/10 Moderate
- Heat 2/10 Low 7 d/yr ≥92°F today · 17 d/yr by 30 yrs out
- Wind 2/10 Low 2% chance of damaging wind over 30 yrs
- Air quality 1/10 Low 0 unhealthy d/yr today · 0 by 30 yrs out
Nearby sold comps map
Loading sold comps map…
Walkable amenities ~0.75 mi
Loading nearby amenities…
Taxation est. · year 1
- Rental income
- $29,568
- − Mortgage interest
- −$13,724
- − Property taxes
- −$3,156
- − Insurance
- −$1,225
- − Repairs & maintenance
- −$2,365
- − Management
- −$2,365
- − Depreciation
- −$7,127
- Taxable loss
- −$395
- Est. tax savings @ 24.0%
- +$95
- After-tax cash flow
- $3,655/yr
For passive investors: Depreciation is non-cash, so a rental often shows a tax loss while cash-flowing — sheltering income. Rental losses are passive: they offset passive income freely, and up to $25,000/yr can offset ordinary (W-2) income if you actively participate and your MAGI is under $100k (phasing out to $0 by $150k); unused losses carry forward. On sale, claimed depreciation is recaptured at up to 25%, and gains may owe capital-gains tax (a 1031 exchange can defer both). Figures are a year-1 estimate at your 24.0% rate — not tax advice; consult a CPA.
Schools (NCES district)
- District
- Warrensburg Central School District
- NCES district ID
- 3629910
- Math proficiency
- 47% ▲ 4.00%
- Reading proficiency
- 44% ▼ -2.00%
- Median HH income
- $48,828
- Composite
- 41.15/100
- National rank
- #7424
- State rank
- #552 of 755 in NY
Livability — Warrensburg
- Score
- 63/100
- State rank
- #823
- US rank
- #15925
Category grades
Schools grade is shown separately in the Schools card above.
Census & demographics
- Census place
- Warrensburg, NY
- Population (ZIP)
- 4,531
Population outlook (Warren County) Hauer SSP2
- Today (2025)
- 62,372 people
- By 2030
- 60,491 · -3.0%
- By 2040
- 55,616 · -10.8%
- By 2050
- 50,437 · -19.1%
- By 2075
- 40,843 · -34.5%
- By 2100
- 31,159 · -50.0%
Race, ethnicity, and origin ACS 2023
- Neighborhood character
- Predominantly White (89%)
- Race & ethnicity
- White 89% Two or more races 5% Asian 3% Hispanic / Latino 3%
- Common ancestry
- Lithuanian 4% Portuguese 2% Slovak 2%
- Foreign-born
- 4% · Canada
- Languages at home
- 96% English-only · Other Indo-European 2% Tagalog/Filipino 1%
Political lean MEDSL · Warren
- 2024 margin
- Toss-up / Even · D 47.9% · R 52.1%
- 2008→2024 swing
- -6.9pp toward R · 2008: 2.6pp · 2024: -4.2pp
- All cycles
- 2024: R+4.2 2020: R+0.2 2016: R+10.6 2012: D+2.1 2008: D+2.6
Not yet ingested
- Civics
- —
Market trends
- HPI YoY
- ▲ 60.30%
- Current HPI
- 368.3803
- Rent YoY
- —
- Metro
- —
- State GDP YoY
- ▲ 2.60%
- F500 in state
- 92
Industry mix (Fortune 500 HQ in NY)
| Industry | F500 HQs | Revenue |
|---|---|---|
| Financial Services | 10 | $950B |
|
||
| Consumer Goods | 9 | $162B |
|
||
| Insurance | 4 | $225B |
|
||
| Telecommunications | 2 | $144B |
|
||
| Pharmaceuticals | 2 | $112B |
|
||
| Media / Entertainment | 2 | $69B |
|
||
Price history
-10.9% since first listed5 events — show timeline
- 2026-04-23 Listed $245,000 Global MLS
- 2026-04-01 Listing Removed — Global MLS
- 2025-07-18 Price Changed $254,900 Global MLS
- 2025-06-05 Price Changed $284,900 Global MLS
- 2025-05-31 Listed $275,000 Global MLS
Property tax history
-12.4%/yrLatest (2025): $3,156 · -0.5% YoY. Source: county tax records.
Cash-flow waterfall
monthlySold comps — $/sqft
last 12 mo · ≤1 miLoading sold comps…