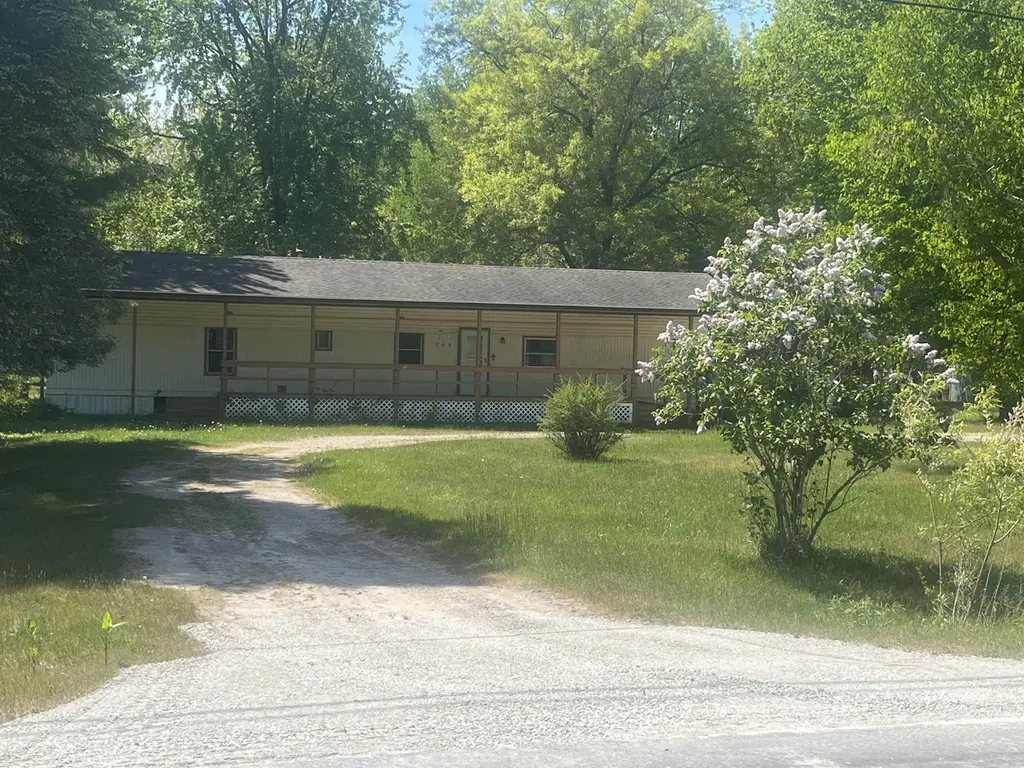
704 Delano Rd · Sims, MI
Flood risk 5/10 · Moderate
- FEMA flood zone
- A
- Chance of flooding over 30 yrs
- 0.48%
- Est. flood insurance / yr
- $1,009 – $1,996
Fire risk 3/10 · Minor
- Est. fire insurance / yr
- $784 – $1,456
Heat risk 1/10 · Minimal
- Hot days now (above 93°F)
- 7 days/yr
- Hot days in 30 yrs
- 13 days/yr
Wind risk 1/10 · Minimal
- Chance of severe wind over 30 yrs
- —
Air-quality risk 2/10 · Minimal
- Unhealthy air days now
- 1 days/yr
- Unhealthy air days in 30 yrs
- 1 days/yr
Risk factors via First Street. Map © Google.
Why this score? — see what drove the B- grade
The composite is a weighted blend of 9 inputs, each scored 0–100. Each bar is that input's sub-score; the figure is the points it added to the 100-point composite (weight × sub-score).
- Cash flow +29.2/30.0
- DSCR +10.0/10.0
- 1% rule +9.1/10.0
- ARV discount +7.5/15.0
- Schools +3.6/10.0
- Rent growth +2.5/5.0
- Livability +2.5/5.0
- Condition / age +2.5/5.0
- Appreciation +0.0/10.0
$70,000
🖨 Deal sheet 📄 Offer letter ✓ Due diligence
Listing remarks MLS
If you're looking for a country property with potential, this three-bedroom, one-bath single-wide manufactured home may be just what you're looking for. “The backyard also includes a fenced-in area, perfect for pets to enjoy safely. â€Situated on 1.8 acres, the property offers a peaceful setting where deer and wild turkeys are frequent visitors right in your own backyard. The home features three bedrooms, a full bath, and an open kitchen and living room area. While the home needs some work and updating, it provides an excellent opportunity for someone willing to invest a little effort to create a comfortable living space. A spacious 24 x 30' pole barn offers plenty of room for storage, vehicles, equipment, hobbies, or a workshop. Enjoy the beauty of nature, open space, and country living while putting your personal touch on this affordable property. Whether you're looking for a starter home, a weekend retreat, or an investment opportunity, this property is worth a look.
Key facts
- 24 x 30 pole barn
- Fenced-in area
- 1.83 acre lot
Tags
Property features AI
Finance
- Other: Approximately 1.83 acre lot (200 x 400)
Exterior
- Utilities: Private well water; Septic tank
- Home design: Single-family residence; One level
- Construction: Aluminum siding
- Exterior features: Deck; Porch; Fenced yard; Barn(s)
Interior
- Kitchen: Oven; Range
- Bathrooms: 1 full bathroom
- Heating & cooling: Central air conditioning; Forced air heating; Propane heating
- Interior features: Electric water heater; Oven; Range; Crawl space basement
Neighborhood map
What this means for you Summary
Snapshot
- This is a 3-bed/1.0-bath single-family listed at $70k.
Deal economics
- At list price, monthly cash flow is $118 ($1k/yr) — positive.
- The deal already cash-flows at list — no discount required.
- Meets the 1% rule at list price ($986 rent vs $70k).
- Recommended offer: $69k (1.5% below list) — sets the bar for market timing.
Location & tenants
- Location reads: area grade B — affects rentability + tenant quality, not the cash-flow math above.
- Au Gres-Sims School District (rural): math 29% / reading 52% proficiency, ranked #376 of 760 in MI (top 50%) — families likely to look elsewhere, expect single-tenant / working-renter base with shorter leases.
- Market conditions: 100 active listings in the ZIP; 30 units permitted in Arenac County in 2024 (0 in 5+ unit buildings).
Forward outlook
- Local home prices are declining (-3.0%/yr); year-one equity from $484 of loan paydown is wiped out by about $2k of value loss. Plan a longer hold.
- Arenac County population projected at -32% by 2050 — secular population decline; favor cash flow + early exit over multi-decade hold.
Negotiation context
- It's been on market 15 days — a 2% lower offer ($69k) is reasonable based on typical stale-listing flexibility.
- 3 sale attempts since 12y ago with the ask held roughly flat each time — persistent listings suggest the price (not the market) is what's stuck; bring a comps-based counter.
- Current owner paid $25k; list at $70k implies a 180% gain — meaningful room to come down on a strong offer.
Risks & watch-outs
- Watch-outs: flood insurance adds $125/mo.
- Climate carrying-cost: in FEMA flood zone A (mandatory federal flood insurance) — expect insurance premiums to compound above CPI over the hold.
Questions for the listing agent
- What's the actual annual flood-insurance premium (NFIP or private), and is the property in a SFHA with mandatory coverage?
- Is there a deadline driving the sale (1031 exchange, divorce, estate, relocation)? That informs how much negotiation room exists.
- What's the average days-on-market for RENTAL listings here right now (not sales)? A rising rental-DOM trend means longer vacancies and softer asking-rent achievability than the comps imply.
- What's the recent tenant-quality profile in this submarket — average credit score on applications, eviction rate, late-payment / NSF rate, and stable-employment percentage? A property-management company in the area should have these aggregated.
- How much new for-sale + rental construction is in the pipeline within 1–3 miles? Heavy new supply typically softens prices + rents 12–24 months out; constrained supply supports both.
Investment metrics
- 1% rule
- 1.41% ✓
- Cap rate
- 10.46%
- Cash-on-cash
- 14.88%
- DSCR
- 1.66
- GRM
- 5.9
CMA / ARV
No comps found within radius.
Projected returns pro-forma
-3.0% appreciation · 3.0% rent growth · sell at horizon
- IRR
- -5.1%
- Equity multiple
- 0.81×
- Total profit
- $-3,709
- Equity at exit
- $10,437
- IRR
- 4.8%
- Equity multiple
- 1.35×
- Total profit
- $6,944
- Equity at exit
- $6,052
Cash invested: $19,600 (down + closing). Projections, not guarantees.
Landlord ↔ Tenant lean methodology
- Overall (STATE)
- 62 Landlord-Friendly
- State Michigan
- 62 Landlord-Friendly · EVEN
- County
- — inherits STATE
- City
- — inherits STATE
ZIP-level market 48703
- Home prices YoY
- -34.3%
- Active inventory
- 100
- Price-to-rent
- 5.9×
Monthly cashflow live
- Estimated rent
- $986 medium interval (Pro) →
- Mortgage (P&I)
- −$367
- Tax from tax record
- −$140 /mo · $1,679/yr
- Insurance
- −$29
- Flood insurance flood zone
- −$125 /mo · $1,502/yr
- HOA
- −$0
- Vacancy / Maint / Mgmt
- −$207
- Net cashflow
- $118
Break-even live
UW: 25.0% down · 7.5% · 30yr · 1.5% tax · 5.0% vac · 8.0% maint · 8.0% mgmt
Financing live
Cash to close
- Down payment
- $17,500
- Closing costs
- $2,100
- Reserves months
- —
- Total cash needed
- —
Loan-product check · same deal, 3 products live
Conventional
25% down · 7.5% · 30yr
- Down + closing
- —
- Monthly P&I
- —
- Monthly cashflow
- —
- DSCR
- —
- Eligible?
- —
Personal DTI + credit; lowest rate.
DSCR
20% down · 8.5% · 30yr
- Down + closing
- —
- Monthly P&I
- —
- Monthly cashflow
- —
- DSCR
- —
- Eligible?
- —
No personal income docs; deal must DSCR.
Hard money
10% down · 12.0% · 12mo
- Down + closing
- —
- Monthly P&I
- —
- Monthly cashflow
- —
- DSCR
- —
- Eligible?
- —
Short-term bridge; refi at stabilization.
Listing history 12 events
-
2026-06-18days on market $70,000 Active 15 DOM
-
2026-06-17days on market $70,000 Active 14 DOM
-
2026-06-16days on market $70,000 Active 13 DOM
-
2026-06-15days on market $70,000 Active 12 DOM
-
2026-06-13days on market $70,000 Active 10 DOM
-
2026-06-12days on market $70,000 Active 9 DOM
-
2026-06-09days on market $70,000 Active 6 DOM
-
2026-06-08days on market $70,000 Active 5 DOM
-
2026-06-07days on market $70,000 Active 4 DOM
-
2026-06-07days on market $70,000 Active 3 DOM
-
2026-06-04remarks 675-char remark
-
2026-06-04$70,000 Active 1 DOM
ⓘ Source: listings_history table (triggers on properties + properties_extension) + one-shot
backfill from property_details.listing_events for pre-trigger history.
Tax reassessment forecast MI · Partial reset (capped growth)
- Current annual tax
- $1,679 · $140/mo
- Projected year-2 tax
- $1,679 · $140/mo
- Expected delta
- $0/yr ($0/mo · 0.0%)
ⓘ Screening estimate from a state-policy table — verify with the county assessor before closing.
Climate risk First Street
- Flood 5/10 Major FEMA zone A · 48% chance over 30 yrs
- Wildfire 3/10 Moderate
- Heat 1/10 Low 7 d/yr ≥93°F today · 13 d/yr by 30 yrs out
- Wind 1/10 Low
- Air quality 2/10 Low 1 unhealthy d/yr today · 1 by 30 yrs out
Nearby sold comps map
Loading sold comps map…
Walkable amenities ~0.75 mi
Loading nearby amenities…
Taxation est. · year 1
- Rental income
- $11,837
- − Mortgage interest
- −$3,921
- − Property taxes
- −$1,679
- − Insurance
- −$1,852
- − Repairs & maintenance
- −$947
- − Management
- −$947
- − Depreciation
- −$2,036
- Taxable income
- $454
- Est. tax owed @ 24.0%
- −$109
- After-tax cash flow
- $1,306/yr
For passive investors: Depreciation is non-cash, so a rental often shows a tax loss while cash-flowing — sheltering income. Rental losses are passive: they offset passive income freely, and up to $25,000/yr can offset ordinary (W-2) income if you actively participate and your MAGI is under $100k (phasing out to $0 by $150k); unused losses carry forward. On sale, claimed depreciation is recaptured at up to 25%, and gains may owe capital-gains tax (a 1031 exchange can defer both). Figures are a year-1 estimate at your 24.0% rate — not tax advice; consult a CPA.
Schools (NCES district)
- District
- Au Gres-Sims School District
- NCES district ID
- 2603600
- Math proficiency
- 29% ▬ 0.00%
- Reading proficiency
- 52% ▲ 18.00%
- Median HH income
- $37,262
- Composite
- 36.05/100
- National rank
- #9513
- State rank
- #376 of 760 in MI
Livability — Sims
No livability data for this city. (Only ~50 U.S. cities are tracked.)
Census & demographics
- Population (ZIP)
- 2,940
Population outlook (Arenac County) Hauer SSP2
- Today (2025)
- 14,036 people
- By 2030
- 13,189 · -6.0%
- By 2040
- 11,309 · -19.4%
- By 2050
- 9,616 · -31.5%
- By 2075
- 6,776 · -51.7%
- By 2100
- 4,997 · -64.4%
Race, ethnicity, and origin ACS 2023
- Neighborhood character
- Predominantly White (95%)
- Race & ethnicity
- White 95% Two or more races 4%
- Common ancestry
- Romanian 11% Lithuanian 8% Slovak 4%
- Foreign-born
- 1% · Canada
- Languages at home
- 98% English-only · German/W. Germanic 1%
Political lean MEDSL · Arenac
- 2024 margin
- Solid R (+40.6) · D 29.1% · R 69.7% · Other 1.3%
- 2008→2024 swing
- -44.9pp toward R · 2008: 4.3pp · 2024: -40.6pp
- All cycles
- 2024: R+40.6 2020: R+35.7 2016: R+33.1 2012: R+4.9 2008: D+4.3
Not yet ingested
- Civics
- —
Market trends
- HPI YoY
- ▼ -81.91%
- Current HPI
- 157.0897
- Rent YoY
- —
- Metro
- —
- State GDP YoY
- ▲ 1.37%
- F500 in state
- 28
Industry mix (Fortune 500 HQ in MI)
| Industry | F500 HQs | Revenue |
|---|---|---|
| Automotive Parts | 3 | $48B |
|
||
| Automotive | 2 | $372B |
|
||
| Chemicals | 1 | $45B |
|
||
| Automotive Retail | 1 | $29B |
|
||
| Healthcare / Medical Devices | 1 | $23B |
|
||
| Automotive Technology | 1 | $20B |
|
||
Price history
+75.4% since first listed5 events — show timeline
- 2026-06-03 Listed $70,000 REALCOMP
- 2026-06-03 Listed $70,000 MiRealSource-MiMLS
- 2015-09-14 Sold (Public Records) $25,000 Public Records
- 2014-09-19 Listing Removed — MiRealSource-MiMLS
- 2014-03-19 Listed $39,900 MiRealSource-MiMLS
Property tax history
+18.0%/yrLatest (2025): $1,679 · +0.1% YoY. Source: county tax records.
Cash-flow waterfall
monthlySold comps — $/sqft
last 12 mo · ≤1 miLoading sold comps…