5719 Roadhouse Dr · Terrell, TX
Flood risk No data
- FEMA flood zone
- —
- Chance of flooding over 30 yrs
- —
- Est. flood insurance / yr
- —
Fire risk No data
- Est. fire insurance / yr
- —
Heat risk No data
- Hot days now (above threshold)
- —
- Hot days in 30 yrs
- —
Wind risk No data
- Chance of severe wind over 30 yrs
- —
Air-quality risk No data
- Unhealthy air days now
- —
- Unhealthy air days in 30 yrs
- —
Risk factors via First Street. Map © Google.
Why this score? — see what drove the D grade
The composite is a weighted blend of 9 inputs, each scored 0–100. Each bar is that input's sub-score; the figure is the points it added to the 100-point composite (weight × sub-score).
- Cash flow +12.5/30.0
- ARV discount +8.8/15.0
- Schools +4.0/10.0
- Condition / age +4.0/5.0
- DSCR +3.7/10.0
- 1% rule +3.6/10.0
- Livability +3.4/5.0
- Rent growth +2.9/5.0
- Appreciation +0.0/10.0
$246,000
🖨 Deal sheet (PDF) 📄 Offer letter ✓ Due diligence
Listing remarks
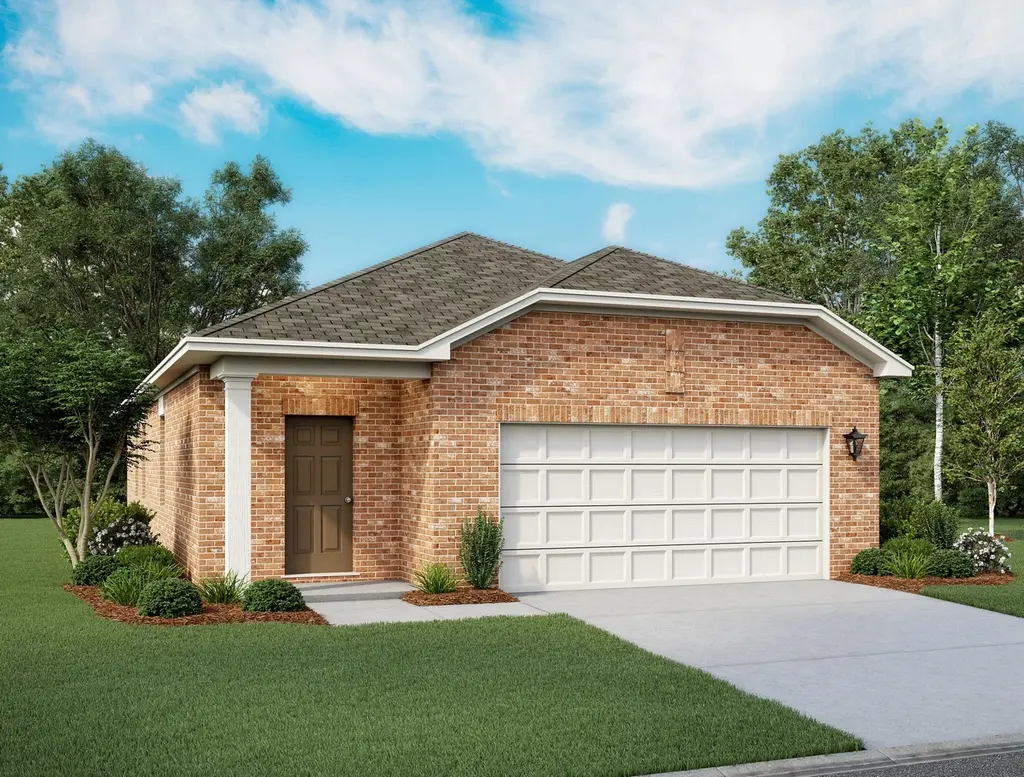
This one-story 3 bedroom, 2 bath home is perfect for anyone looking to own. Enjoy conveniences like an updated kitchen with granite countertops, a large island, stainless steel appliances and upgraded cabinets.
Key facts
- Large island
- Updated kitchen
- Granite countertops
Tags
Property features AI
Finance
- Other: Living area approximately 1401; Address: 5719 Roadhouse Dr, Forney, TX 75126; New construction inventory type: Spec; Status: Active
- Financial info: List price: $245,000
Exterior
- Parking: 2 parking spaces
- Utilities: Electric power; Central air (cooling); Heat pump (heating)
- Home design: Single-family (spec plan: Enterprise)
Interior
- Kitchen: Dishwasher; Disposal; Microwave
- Bedrooms: 3 bedrooms
- Bathrooms: 2 full bathrooms
- Heating & cooling: Electric heating with heat pump; Central air conditioning
- Interior features: Dishwasher; Disposal; Microwave
Neighborhood map
What this means for you Summary
Snapshot
- This is a 3-bed/2.0-bath single-family listed at $246k. Condition is rated good.
Deal economics
- At list price, monthly cash flow is $-35 ($-418/yr) — negative.
- To cash-flow at today's rent, offer at most $241k (2.1% below list).
- To meet the 1% rule (rent ≥ 1% of price), the offer needs to be $211k (14.3% below list).
- Recommended offer: $211k (14.3% below list) — sets the bar for 1% rule.
- Cap rate 6.1% vs local median 3.8% in Terrell — top-decile yield for the area; either an underpriced asset or a hidden risk that comps aren't pricing in. Stress-test before assuming the spread holds.
Location & tenants
- Location reads 67/100 on livability (#520 in TX) — a middle-class / working-renter tenant base. Strengths: cost of living A+, housing A+; Watch: amenities C-, employment D, commute F.
- Forney ISD (rural): math 41% / reading 44% proficiency, ranked #234 of 826 in TX (top 28%) — families likely to look elsewhere, expect single-tenant / working-renter base with shorter leases.
- Zoned schools: Crosby El (math 37% / reading 36%, grade F, #1,883 of 4,322 statewide, top 44%, 682 students, 59% FRL); Brown Middle (math 29% / reading 39%, grade F, #892 of 1,662 statewide, top 55%, 673 students, 56% FRL); North Forney H S (math 32% / reading 45%, grade F, #866 of 1,632 statewide, top 54%, 2,502 students, 49% FRL) — zoned schools average 55% FRL vs 26% district-wide (28 pts higher); higher-poverty schools than district average — tighter screening recommended.
- Market conditions: Rents rising (+1.4%/yr); 2200 active listings in the ZIP; 40 comparable units currently listed for rent nearby; rentals at typical pace (median 26d on market — plan ~3-4 weeks tenant-placement turnaround); solid renter incomes; 1,747 units permitted in Kaufman County in 2024 (180 in 5+ unit buildings).
Forward outlook
- Local home prices are declining (-3.0%/yr); year-one equity from $2k of loan paydown is wiped out by about $7k of value loss. Plan a longer hold.
- Kaufman County population projected at +43% by 2050 — long-run rental-demand tailwind backs the buy-and-hold thesis.
Negotiation context
- It's been on market 17 days — a 2% lower offer ($242k) is reasonable based on typical stale-listing flexibility.
Questions for the listing agent
- What do current leases actually rent for vs. the listed asking? Can we see a recent rent roll and the last 12 months of T-12 income?
- Is there a deadline driving the sale (1031 exchange, divorce, estate, relocation)? That informs how much negotiation room exists.
- Schools are F-rated, which usually means shorter tenancies and higher turnover. Who's the typical renter profile here, and what's been the actual vacancy rate?
- The area grade is low — what's the realistic commute time and amenity access for the typical tenant pool here? Any planned neighborhood developments (good or bad) we should know about?
- What's the average days-on-market for RENTAL listings here right now (not sales)? A rising rental-DOM trend means longer vacancies and softer asking-rent achievability than the comps imply.
- What's the recent tenant-quality profile in this submarket — average credit score on applications, eviction rate, late-payment / NSF rate, and stable-employment percentage? A property-management company in the area should have these aggregated.
- How much new for-sale + rental construction is in the pipeline within 1–3 miles? Heavy new supply typically softens prices + rents 12–24 months out; constrained supply supports both.
Investment metrics
- 1% rule
- 0.86% ✗
- Cap rate
- 6.12%
- Cash-on-cash
- -0.61%
- DSCR
- 0.97
- GRM
- 9.7
CMA / ARV
- ARV (on-the-fly)
- $253,581
- Comps found
- 12
Show comp detail 12 sales within ~0.75 mi
| Address | Dist | Beds/Ba | Sqft | Sold | Price | $/sf | Match |
|---|---|---|---|---|---|---|---|
| 6214 Old Bridge Way | 0.13mi | 3/2.0 | 1,399 (-0%) | 0mo | $225,000 | $161 | 94 |
| 6070 Mojave Dr | 0.14mi | 3/2.0 | 1,412 (+1%) | 3mo | $262,990 | $186 | 90 |
| 6808 Bonanza Way | 0.22mi | 3/2.0 | 1,401 (0%) | 7mo | $233,000 | $166 | 84 |
| 6303 Tropicana Ln | 0.24mi | 3/2.0 | 1,412 (+1%) | 8mo | $238,000 | $169 | 80 |
| 5919 Sahara Dr | 0.07mi | 3/2.5 | 1,605 (+15%) | 4mo | $237,000 | $148 | 67 |
| 5936 Sahara | 0.08mi | 3/2.0 | 1,200 (-14%) | 6mo | $253,490 | $211 | 67 |
| 5948 Sahara | 0.11mi | 3/2.0 | 1,200 (-14%) | 5mo | $245,990 | $205 | 67 |
| 6433 Bishop Dr | 0.23mi | 3/2.0 | 1,284 (-8%) | 12mo | $229,500 | $179 | 65 |
| 6113 Harrah Ln | 0.22mi | 3/2.0 | 1,326 (-5%) | 19mo | $239,900 | $181 | 65 |
| 6069 Mojave Dr | 0.12mi | 2/2.0 (-1) | 1,284 (-8%) | 14mo | $175,000 | $136 | 64 |
| 5928 Sahara | 0.08mi | 3/2.0 | 1,200 (-14%) | 11mo | $237,990 | $198 | 63 |
| 6125 Harrah Ln | 0.18mi | 3/2.0 | 1,200 (-14%) | 22mo | $244,900 | $204 | 50 |
Match score weights: distance 35% · size 25% · config 20% · recency 20%. Top-matched comps best support the ARV.
Projected returns pro-forma
-3.0% appreciation · 1.42% rent growth · sell at horizon
- IRR
- -19.1%
- Equity multiple
- 0.34×
- Total profit
- $-45,350
- Equity at exit
- $36,679
- IRR
- -15.2%
- Equity multiple
- 0.20×
- Total profit
- $-55,333
- Equity at exit
- $21,270
Cash invested: $68,880 (down + closing). Projections, not guarantees.
Landlord ↔ Tenant lean methodology
- Overall (STATE)
- 87 Strongly Landlord-Friendly
- State Texas
- 87 Strongly Landlord-Friendly · R+5
- County
- — inherits STATE
- City
- — inherits STATE
ZIP-level market 75126
- Rents YoY
- 1.4%
- Active inventory
- 2200
- Price-to-rent
- 9.7×
Monthly cashflow live
- Estimated rent
- $2,108 high interval (Pro) →
- Mortgage (P&I)
- −$1,290
- Tax est. 1.5%
- −$308 /mo · $3,690/yr
- Insurance
- −$102
- HOA
- −$0
- Vacancy / Maint / Mgmt
- −$443
- Net cashflow
- $-35
Break-even live
Sensitivity live
| Price | -10% $135 | -5% $50 | +0% $-35 | +5% $-120 | +10% $-205 |
|---|---|---|---|---|---|
| Rent | -10% $-201 | -5% $-118 | +0% $-35 | +5% $48 | +10% $132 |
| Rate | -1.0pp $89 | -0.5pp $28 | base $-35 | +0.5pp $-99 | +1.0pp $-163 |
UW: 25.0% down · 7.5% · 30yr · 1.5% tax · 5.0% vac · 8.0% maint · 8.0% mgmt
Financing live
Cash to close
- Down payment
- $61,500
- Closing costs
- $7,380
- Reserves months
- —
- Total cash needed
- —
Loan-product check · same deal, 3 products live
Conventional
25% down · 7.5% · 30yr
- Down + closing
- —
- Monthly P&I
- —
- Monthly cashflow
- —
- DSCR
- —
- Eligible?
- —
Personal DTI + credit; lowest rate.
DSCR
20% down · 8.5% · 30yr
- Down + closing
- —
- Monthly P&I
- —
- Monthly cashflow
- —
- DSCR
- —
- Eligible?
- —
No personal income docs; deal must DSCR.
Hard money
10% down · 12.0% · 12mo
- Down + closing
- —
- Monthly P&I
- —
- Monthly cashflow
- —
- DSCR
- —
- Eligible?
- —
Short-term bridge; refi at stabilization.
Rent comps 40 comps
| Address | Beds | Baths | Sqft | Rent | $/sqft | DOM | Units | Dist |
|---|---|---|---|---|---|---|---|---|
| 5919 Sahara Dr Forney, TX | 3.0 | 2.5 | 1605 | $2,100 | $1.31 | 26d | 1 | 0.06mi |
| 5730 Roadhouse Forney, TX | 3.0 | 2.0 | 1200 | $2,150 | $1.79 | 8d | 1 | 0.07mi |
| 5940 Sahara Dr Forney, TX | 4.0 | 2.5 | 1700 | $2,650 | $1.56 | 0d | 1 | 0.11mi |
| 6222 Old Bridge Way Forney, TX | 3.0 | 2.0 | 1412 | $1,795 | $1.27 | 14d | 1 | 0.13mi |
| 6086 Mojave Dr Forney, TX | 3.0 | 2.0 | 1412 | $1,995 | $1.41 | 9d | 1 | 0.14mi |
| 6215 Old Bridge Way Forney, TX | 3.0 | 2.5 | 1605 | $1,845 | $1.15 | 45d | 1 | 0.16mi |
| 6211 Old Bridge Way Unit 6211OB Heath, TX | 3.0 | 2.0 | 1412 | $1,845 | $1.31 | 4d | 1 | 0.18mi |
| 6309 Tropicana Ln Forney, TX | 3.0 | 2.0 | 1412 | $2,050 | $1.45 | 45d | 1 | 0.22mi |
| 6040 Mojave Dr Forney, TX | 3.0 | 2.5 | 1826 | $1,990 | $1.09 | 26d | 1 | 0.25mi |
| 6109 Harrah Ln Unit 6109HL Heath, TX | 3.0 | 2.0 | 1401 | $1,745 | $1.25 | 4d | 1 | 0.25mi |
| 6029 Mojave Dr Forney, TX | 3.0 | 2.0 | 1200 | $1,695 | $1.41 | 26d | 1 | 0.25mi |
| 6103 Harrah Ln Forney, TX | 3.0 | 2.0 | 1412 | $1,845 | $1.31 | 4d | 1 | 0.27mi |
| 6624 Charleston Dr Forney, TX | 3.0 | 2.0 | 1412 | $2,045 | $1.45 | 5d | 1 | 0.27mi |
| 6101 Harrah Ln Unit 6101HL Heath, TX | 3.0 | 2.0 | 1401 | $1,745 | $1.25 | 26d | 1 | 0.27mi |
| 6658 Charleston Dr Unit 6658CD Heath, TX | 3.0 | 2.5 | 1605 | $1,935 | $1.21 | 9d | 1 | 0.31mi |
| 6012 Mojave Dr Forney, TX | 3.0 | 2.5 | 1605 | $1,845 | $1.15 | 45d | 1 | 0.32mi |
| 3122 Zapta Rd Forney, TX | 3.0 | 2.0 | 1681 | $2,150 | $1.28 | 45d | 1 | 0.92mi |
| 3112 Shorthorn Way Forney, TX | 3.0 | 2.0 | 1450 | $2,150 | $1.48 | 9d | 1 | 1.06mi |
| 3010 Saddleback Way Forney, TX | 3.0 | 2.0 | 1538 | $1,895 | $1.23 | 45d | 1 | 1.09mi |
| 2043 Pleasant Knoll Cir Forney, TX | 3.0 | 2.0 | 1734 | $2,099 | $1.21 | 45d | 1 | 1.10mi |
| 9225 Lone Cypress Dr Forney, TX | 3.0 | 2.0 | 1605 | $2,070 | $1.29 | 0d | 1 | 1.11mi |
| 3133 Angus Dr Forney, TX | 3.0 | 2.0 | 1681 | $2,050 | $1.22 | 45d | 1 | 1.14mi |
| 3088 Chillingham Dr Forney, TX | 3.0 | 2.0 | 1643 | $1,850 | $1.13 | 45d | 1 | 1.15mi |
| 3083 Chillingham Dr Forney, TX | 3.0 | 2.0 | 1224 | $2,800 | $2.29 | 45d | 1 | 1.17mi |
| 3010 McCoy Rd Forney, TX | 4.0 | 2.0 | 1683 | $2,050 | $1.22 | 26d | 1 | 1.21mi |
| 3013 McCoy Rd Forney, TX | 3.0 | 2.0 | 1643 | $1,895 | $1.15 | 26d | 1 | 1.23mi |
| 3095 Barzona Rd Forney, TX | 4.0 | 2.0 | 1683 | $1,850 | $1.10 | 19d | 1 | 1.25mi |
| 3023 Villegas Way Forney, TX | 4.0 | 2.0 | 1683 | $1,875 | $1.11 | 26d | 1 | 1.26mi |
| 1211 Canyon Wren Dr Forney, TX | 4.0 | 2.0 | 1656 | $2,400 | $1.45 | 24d | 1 | 1.31mi |
| 1281 Wedgeleaf Ln Forney, TX | 3.0 | 2.0 | 1522 | $1,805 | $1.19 | 14d | 1 | 1.31mi |
| 3016 Boran Dr Forney, TX | 3.0 | 2.0 | 1681 | $2,100 | $1.25 | 45d | 1 | 1.31mi |
| 1285 Wedgeleaf Ln Forney, TX | 3.0 | 2.0 | 1522 | $1,800 | $1.18 | 45d | 1 | 1.33mi |
| 1621 Sparrow Hawk Rd Forney, TX | 3.0 | 2.0 | 1522 | $1,785 | $1.17 | 24d | 1 | 1.33mi |
| 1220 Canyon Wren Dr Forney, TX | 3.0 | 2.0 | 1720 | $1,815 | $1.06 | 9d | 1 | 1.33mi |
| 3039 Boran Dr Forney, TX | 3.0 | 2.0 | 1690 | $2,000 | $1.18 | 45d | 1 | 1.34mi |
| 1222 Canyon Wren Dr Forney, TX | 3.0 | 2.0 | 1302 | $1,775 | $1.36 | 45d | 1 | 1.34mi |
| 1289 Wedgeleaf Ln Forney, TX | 3.0 | 2.0 | 1522 | $1,785 | $1.17 | 24d | 1 | 1.34mi |
| 3007 Boran Dr Forney, TX | 3.0 | 2.0 | 1650 | $2,200 | $1.33 | 26d | 1 | 1.35mi |
| 1611 Sparrow Hawk Rd Forney, TX | 3.0 | 2.0 | 1522 | $1,800 | $1.18 | 45d | 1 | 1.35mi |
| 1223 Canyon Wren Dr Forney, TX | 3.0 | 2.0 | 1522 | $1,800 | $1.18 | 45d | 1 | 1.35mi |
Listing history 12 events
-
2026-06-21days on market $246,000 Active 17 DOM
-
2026-06-18days on market $246,000 Active 14 DOM
-
2026-06-17days on market $246,000 Active 13 DOM
-
2026-06-16days on market $246,000 Active 12 DOM
-
2026-06-15days on market $246,000 Active 11 DOM
-
2026-06-13days on market $246,000 Active 9 DOM
-
2026-06-13pricedays on market $246,000 Active 8 DOM
-
2026-06-09days on market $245,000 Active 5 DOM
-
2026-06-08days on market $245,000 Active 4 DOM
-
2026-06-07days on market $245,000 Active 3 DOM
-
2026-06-04remarks 210-char remark
-
2026-06-04$245,000 Active 1 DOM
ⓘ Source: listings_history table (triggers on properties + properties_extension) + one-shot
backfill from property_details.listing_events for pre-trigger history.
Nearby sold comps map
Loading sold comps map…
Walkable amenities ~0.75 mi
Loading nearby amenities…
Taxation est. · year 1
- Rental income
- $25,294
- − Mortgage interest
- −$13,780
- − Property taxes
- −$3,690
- − Insurance
- −$1,230
- − Repairs & maintenance
- −$2,024
- − Management
- −$2,024
- − Depreciation
- −$7,156
- Taxable loss
- −$4,609
- Est. tax savings @ 24.0%
- +$1,106
- After-tax cash flow
- $688/yr
For passive investors: Depreciation is non-cash, so a rental often shows a tax loss while cash-flowing — sheltering income. Rental losses are passive: they offset passive income freely, and up to $25,000/yr can offset ordinary (W-2) income if you actively participate and your MAGI is under $100k (phasing out to $0 by $150k); unused losses carry forward. On sale, claimed depreciation is recaptured at up to 25%, and gains may owe capital-gains tax (a 1031 exchange can defer both). Figures are a year-1 estimate at your 24.0% rate — not tax advice; consult a CPA.
Condition & rehab AI · 12 photos
This one-story home is in good condition with recent updates, making it a great option for both resale and rental.
Value-add opportunities
- Both paint interior walls — Fresh paint enhances curb appeal and interior aesthetics
- Both replace carpet in bedrooms — Carpet in bedrooms can be replaced with hardwood or tile for a more modern look and easier maintenance
Renovation cost estimate screening
Value-add ROI direction
- Both paint interior walls — Fresh paint enhances curb appeal and interior aesthetics ↑
- Both replace carpet in bedrooms — Carpet in bedrooms can be replaced with hardwood or tile for a more modern look and easier maintenance ↑
ⓘ Cost ranges are severity-bucket heuristics (US national rule-of-thumb). Get contractor quotes + a written scope before underwriting a rehab budget.
Schools (NCES district)
- District
- Forney ISD
- NCES district ID
- 4819560
- Math proficiency
- 41% ▼ -20.00%
- Reading proficiency
- 44% ▼ -12.00%
- Median HH income
- $86,679
- Composite
- 40.07/100
- National rank
- #3812
- State rank
- #234 of 826 in TX
Livability — Terrell
- Score
- 67/100
- State rank
- #520
- US rank
- #10213
Category grades
Schools grade is shown separately in the Schools card above.
Census & demographics
- County
- Kaufman County · 122,338 people
- City population
- 150,788
- Metro
- Dallas-Fort Worth-Arlington, TX
- Population (ZIP)
- 84,799
- Household income
- $103,673
- Rent vs Own
- Severe rent burden
- 1306.0
Population outlook (Kaufman County) Hauer SSP2
- Today (2025)
- 138,716 people
- By 2030
- 150,815 · +8.7%
- By 2040
- 174,877 · +26.1%
- By 2050
- 198,020 · +42.8%
- By 2075
- 251,908 · +81.6%
- By 2100
- 285,325 · +105.7%
Race, ethnicity, and origin ACS 2023
- Neighborhood character
- Diverse neighborhood (Simpson 0.68)
- Race & ethnicity
- White 45% Black 25% Hispanic / Latino 23% Two or more races 14% Asian 3%
- Hispanic origin (detail)
- Mexican 18% Puerto Rican 1%
- Common ancestry
- Italian 2% Slovak 1% Portuguese 1%
- Foreign-born
- 12% · Canada, Vietnam
- Languages at home
- 79% English-only · Spanish 14% Arabic 1% Vietnamese 1%
Political lean MEDSL · Kaufman
- 2024 margin
- Strong R (+27.9) · D 35.6% · R 63.5%
- 2008→2024 swing
- +7.9pp toward D · 2008: -35.8pp · 2024: -27.9pp
- All cycles
- 2024: R+27.9 2020: R+33.9 2016: R+47.0 2012: R+44.4 2008: R+35.8
Not yet ingested
- Civics
- —
Market trends
- HPI YoY
- ▼ -102.93%
- Current HPI
- 148.5749
- Rent YoY
- ▲ 1.42%
- Metro
- Dallas-Fort Worth-Arlington, TX
- State GDP YoY
- ▲ 3.95%
- F500 in state
- 110
Industry mix (Fortune 500 HQ in TX)
| Industry | F500 HQs | Revenue |
|---|---|---|
| Energy | 16 | $1,198B |
|
||
| Technology | 5 | $198B |
|
||
| Engineering / Construction | 4 | $72B |
|
||
| Energy Services | 3 | $60B |
|
||
| Utilities | 3 | $41B |
|
||
| Healthcare | 2 | $330B |
|
||
Cash-flow waterfall
monthlySold comps — $/sqft
last 12 mo · ≤1 miLoading sold comps…