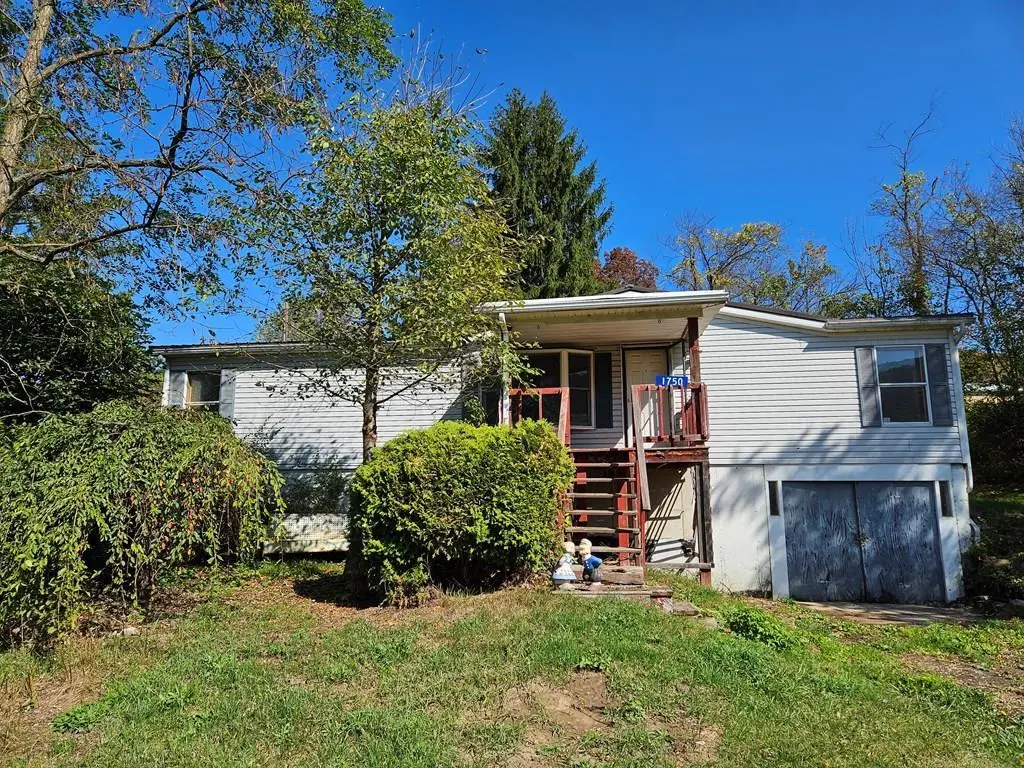
1750 Route 249 · Middlebury, PA
Flood risk 1/10 · Minimal
- FEMA flood zone
- X (unshaded)
- Chance of flooding over 30 yrs
- 0.0%
- Est. flood insurance / yr
- $473 – $860
Fire risk 3/10 · Minor
- Est. fire insurance / yr
- $511 – $949
Heat risk 2/10 · Minimal
- Hot days now (above 91°F)
- 8 days/yr
- Hot days in 30 yrs
- 18 days/yr
Wind risk 2/10 · Minimal
- Chance of severe wind over 30 yrs
- —
Air-quality risk 2/10 · Minimal
- Unhealthy air days now
- 0 days/yr
- Unhealthy air days in 30 yrs
- 1 days/yr
Risk factors via First Street. Map © Google.
Why this score? — see what drove the C grade
The composite is a weighted blend of 9 inputs, each scored 0–100. Each bar is that input's sub-score; the figure is the points it added to the 100-point composite (weight × sub-score).
- Cash flow +21.9/30.0
- ARV discount +7.5/15.0
- DSCR +7.0/10.0
- 1% rule +5.7/10.0
- Appreciation +5.5/10.0
- Schools +4.1/10.0
- Rent growth +2.5/5.0
- Livability +2.5/5.0
- Condition / age +2.5/5.0
$99,900
🖨 Deal sheet (PDF) 📄 Offer letter ✓ Due diligence
Listing remarks MLS
HANDYMAN SPECIAL! 3 bedrooms, 2 full baths, on 1 acre of land. This property is part of an estate and is being sold "AS IS". The views from the front porch are amazing with a private backyard to enjoy a peaceful evenings outdoors. The property is situated in close proximity to surrounding towns and the NY state border. Call today for your showing.
Key facts
- Amazing views
- Private backyard
- 1 acre lot
Tags
Neighborhood map
What this means for you Summary
Snapshot
- This is a 2-bed/1.5-bath manufactured listed at $100k.
Deal economics
- At list price, monthly cash flow is $158 ($2k/yr) — positive.
- The deal already cash-flows at list — no discount required.
- Meets the 1% rule at list price ($1k rent vs $100k).
- Recommended offer: $88k (12.0% below list) — sets the bar for market timing.
Location & tenants
- Location reads: area grade C — affects rentability + tenant quality, not the cash-flow math above.
- Wellsboro Area SD (rural): math 37% / reading 58% proficiency, ranked #230 of 539 in PA (top 43%) — families likely to look elsewhere, expect single-tenant / working-renter base with shorter leases.
- Zoned schools: Don Gill El Sch (math 33% / reading 51%, grade F, #883 of 1,518 statewide, top 61%, 318 students, 55% FRL); Rock L Butler Ms (math 32% / reading 61%, grade D+, #172 of 512 statewide, top 35%, 480 students, 50% FRL); Wellsboro Area Hs (math 77%, 439 students, 45% FRL) — zoned schools average 50% FRL vs 31% district-wide (20 pts higher); higher-poverty schools than district average — tighter screening recommended.
- Market conditions: 4 active listings in the ZIP; 32 units permitted in Tioga County in 2024 (0 in 5+ unit buildings).
Forward outlook
- In year one you build about $2k of equity ($691 loan paydown + $924 appreciation (0.9% local appreciation)).
- Tioga County population projected at -20% by 2050 — secular population decline; favor cash flow + early exit over multi-decade hold.
- At projected returns (0.9% appreciation + 3.0% rent growth), your $28k cash investment doubles in ~7 years — after that, you're playing with house money.
Negotiation context
- It's been on market 313 days — a 12% lower offer ($88k) is reasonable based on typical stale-listing flexibility.
- 2 sale attempts with the ask held roughly flat each time — persistent listings suggest the price (not the market) is what's stuck; bring a comps-based counter.
Questions for the listing agent
- It's been on market 313 days. Have you received any prior offers? Is the seller open to a 12% concession, seller financing, or rate buy-down credit?
- Why hasn't it sold? Are there any deal-killer items the seller is aware of (foundation, flood, title, zoning, code violations)?
- Is there a deadline driving the sale (1031 exchange, divorce, estate, relocation)? That informs how much negotiation room exists.
- What's the average days-on-market for RENTAL listings here right now (not sales)? A rising rental-DOM trend means longer vacancies and softer asking-rent achievability than the comps imply.
- What's the recent tenant-quality profile in this submarket — average credit score on applications, eviction rate, late-payment / NSF rate, and stable-employment percentage? A property-management company in the area should have these aggregated.
- How much new for-sale + rental construction is in the pipeline within 1–3 miles? Heavy new supply typically softens prices + rents 12–24 months out; constrained supply supports both.
Investment metrics
- 1% rule
- 1.07% ✓
- Cap rate
- 8.19%
- Cash-on-cash
- 6.77%
- DSCR
- 1.30
- GRM
- 7.8
CMA / ARV
No comps found within radius.
Projected returns pro-forma
0.93% appreciation · 3.0% rent growth · sell at horizon
- IRR
- 8.2%
- Equity multiple
- 1.41×
- Total profit
- $11,565
- Equity at exit
- $33,715
- IRR
- 12.3%
- Equity multiple
- 2.48×
- Total profit
- $41,371
- Equity at exit
- $44,505
Cash invested: $27,972 (down + closing). Projections, not guarantees.
Landlord ↔ Tenant lean methodology
- Overall (STATE)
- 62 Landlord-Friendly
- State Pennsylvania
- 62 Landlord-Friendly · EVEN
- County
- — inherits STATE
- City
- — inherits STATE
ZIP-level market 16935
- Home prices YoY
- 0.6%
- Active inventory
- 4
- Price-to-rent
- 7.8×
Monthly cashflow live
- Estimated rent
- $1,065 medium interval (Pro) →
- Mortgage (P&I)
- −$524
- Tax from tax record
- −$118 /mo · $1,414/yr
- Insurance
- −$42
- HOA
- −$0
- Vacancy / Maint / Mgmt
- −$224
- Net cashflow
- $158
Break-even live
Sensitivity live
| Price | -10% $214 | -5% $186 | +0% $158 | +5% $130 | +10% $101 |
|---|---|---|---|---|---|
| Rent | -10% $74 | -5% $116 | +0% $158 | +5% $200 | +10% $242 |
| Rate | -1.0pp $208 | -0.5pp $183 | base $158 | +0.5pp $132 | +1.0pp $106 |
UW: 25.0% down · 7.5% · 30yr · 1.5% tax · 5.0% vac · 8.0% maint · 8.0% mgmt
Financing live
Cash to close
- Down payment
- $24,975
- Closing costs
- $2,997
- Reserves months
- —
- Total cash needed
- —
Loan-product check · same deal, 3 products live
Conventional
25% down · 7.5% · 30yr
- Down + closing
- —
- Monthly P&I
- —
- Monthly cashflow
- —
- DSCR
- —
- Eligible?
- —
Personal DTI + credit; lowest rate.
DSCR
20% down · 8.5% · 30yr
- Down + closing
- —
- Monthly P&I
- —
- Monthly cashflow
- —
- DSCR
- —
- Eligible?
- —
No personal income docs; deal must DSCR.
Hard money
10% down · 12.0% · 12mo
- Down + closing
- —
- Monthly P&I
- —
- Monthly cashflow
- —
- DSCR
- —
- Eligible?
- —
Short-term bridge; refi at stabilization.
Listing history 18 events
-
2026-06-21days on market $99,900 Active 313 DOM
-
2026-06-21days on market $99,900 Active 312 DOM
-
2026-06-18days on market $99,900 Active 310 DOM
-
2026-06-17days on market $99,900 Active 309 DOM
-
2026-06-16days on market $99,900 Active 308 DOM
-
2026-06-15days on market $99,900 Active 307 DOM
-
2026-06-13days on market $99,900 Active 305 DOM
-
2026-06-12days on market $99,900 Active 304 DOM
-
2026-06-09days on market $99,900 Active 301 DOM
-
2026-06-08days on market $99,900 Active 300 DOM
-
2026-06-08days on market $99,900 Active 299 DOM
-
2026-06-07days on market $99,900 Active 298 DOM
-
2026-06-04days on market $99,900 Active 295 DOM
-
2026-06-02days on market $99,900 Active 294 DOM
-
2026-06-01days on market $99,900 Active 293 DOM
-
2026-05-31days on market $99,900 Active 292 DOM
-
2026-02-12status Active 359-char remark
Show marketing remark (359 chars)
HANDYMAN SPECIAL! 3 bedrooms, 2 full baths, on 1 acre of land. This property is part of an estate and is being sold "AS IS". The views from the front porch are amazing with a private backyard to enjoy a peaceful evenings outdoors. The property is situated in close proximity to surrounding towns and the NY state border. Call today for your showing.
-
2025-08-11$99,900 Active 359-char remark
Show marketing remark (359 chars)
HANDYMAN SPECIAL! 3 bedrooms, 2 full baths, on 1 acre of land. This property is part of an estate and is being sold "AS IS". The views from the front porch are amazing with a private backyard to enjoy a peaceful evenings outdoors. The property is situated in close proximity to surrounding towns and the NY state border. Call today for your showing.
ⓘ Source: listings_history table (triggers on properties + properties_extension) + one-shot
backfill from property_details.listing_events for pre-trigger history.
Tax reassessment forecast PA · Partial reset (capped growth)
- Current annual tax
- $1,414 · $118/mo
- Projected year-2 tax
- $1,496 · $125/mo
- Expected delta
- +$82/yr (+$7/mo · 5.8%)
ⓘ Screening estimate from a state-policy table — verify with the county assessor before closing.
Climate risk First Street
- Flood 1/10 Low FEMA zone X (unshaded) · 0% chance over 30 yrs
- Wildfire 3/10 Moderate
- Heat 2/10 Low 8 d/yr ≥91°F today · 18 d/yr by 30 yrs out
- Wind 2/10 Low
- Air quality 2/10 Low 0 unhealthy d/yr today · 1 by 30 yrs out
Nearby sold comps map
Loading sold comps map…
Walkable amenities ~0.75 mi
Loading nearby amenities…
Taxation est. · year 1
- Rental income
- $12,777
- − Mortgage interest
- −$5,596
- − Property taxes
- −$1,414
- − Insurance
- −$500
- − Repairs & maintenance
- −$1,022
- − Management
- −$1,022
- − Depreciation
- −$2,906
- Taxable income
- $317
- Est. tax owed @ 24.0%
- −$76
- After-tax cash flow
- $1,818/yr
For passive investors: Depreciation is non-cash, so a rental often shows a tax loss while cash-flowing — sheltering income. Rental losses are passive: they offset passive income freely, and up to $25,000/yr can offset ordinary (W-2) income if you actively participate and your MAGI is under $100k (phasing out to $0 by $150k); unused losses carry forward. On sale, claimed depreciation is recaptured at up to 25%, and gains may owe capital-gains tax (a 1031 exchange can defer both). Figures are a year-1 estimate at your 24.0% rate — not tax advice; consult a CPA.
Schools (NCES district)
- District
- Wellsboro Area SD
- NCES district ID
- 4225170
- Math proficiency
- 37% ▼ -12.00%
- Reading proficiency
- 58% ▼ -15.00%
- Median HH income
- $48,861
- Composite
- 40.52/100
- National rank
- #3710
- State rank
- #230 of 539 in PA
Livability — Middlebury
No livability data for this city. (Only ~50 U.S. cities are tracked.)
Census & demographics
- Population (ZIP)
- 1,175
Population outlook (Tioga County) Hauer SSP2
- Today (2025)
- 40,253 people
- By 2030
- 38,795 · -3.6%
- By 2040
- 35,376 · -12.1%
- By 2050
- 32,081 · -20.3%
- By 2075
- 24,341 · -39.5%
- By 2100
- 17,180 · -57.3%
Race, ethnicity, and origin ACS 2023
- Neighborhood character
- Predominantly White (98%)
- Race & ethnicity
- White 98%
- Common ancestry
- Romanian 4% Lithuanian 2% Slovak 2%
- Foreign-born
- 1% · Canada
- Languages at home
- 99% English-only · Tagalog/Filipino 1%
Political lean MEDSL · Tioga
- 2024 margin
- Solid R (+51.8) · D 23.6% · R 75.4% · Other 1.0%
- 2008→2024 swing
- -24.3pp toward R · 2008: -27.4pp · 2024: -51.8pp
- All cycles
- 2024: R+51.8 2020: R+51.2 2016: R+53.6 2012: R+34.8 2008: R+27.4
Not yet ingested
- Civics
- —
Market trends
- HPI YoY
- ▲ 0.93%
- Current HPI
- 147.2734
- Rent YoY
- —
- Metro
- —
- State GDP YoY
- ▲ 1.68%
- F500 in state
- 34
Industry mix (Fortune 500 HQ in PA)
| Industry | F500 HQs | Revenue |
|---|---|---|
| Healthcare | 2 | $309B |
|
||
| Insurance | 2 | $27B |
|
||
| Telecommunications / Media | 1 | $124B |
|
||
| Industrial Distribution | 1 | $22B |
|
||
| Financial Services | 1 | $20B |
|
||
| Chemicals / Materials | 1 | $18B |
|
||
Price history
2 events — show timeline
- 2026-02-12 Relisted — NMPA
- 2025-08-11 Listed $99,900 NMPA
Property tax history
-0.4%/yrLatest (2026): $1,414 · +0.0% YoY. Source: county tax records.
Cash-flow waterfall
monthlySold comps — $/sqft
last 12 mo · ≤1 miLoading sold comps…