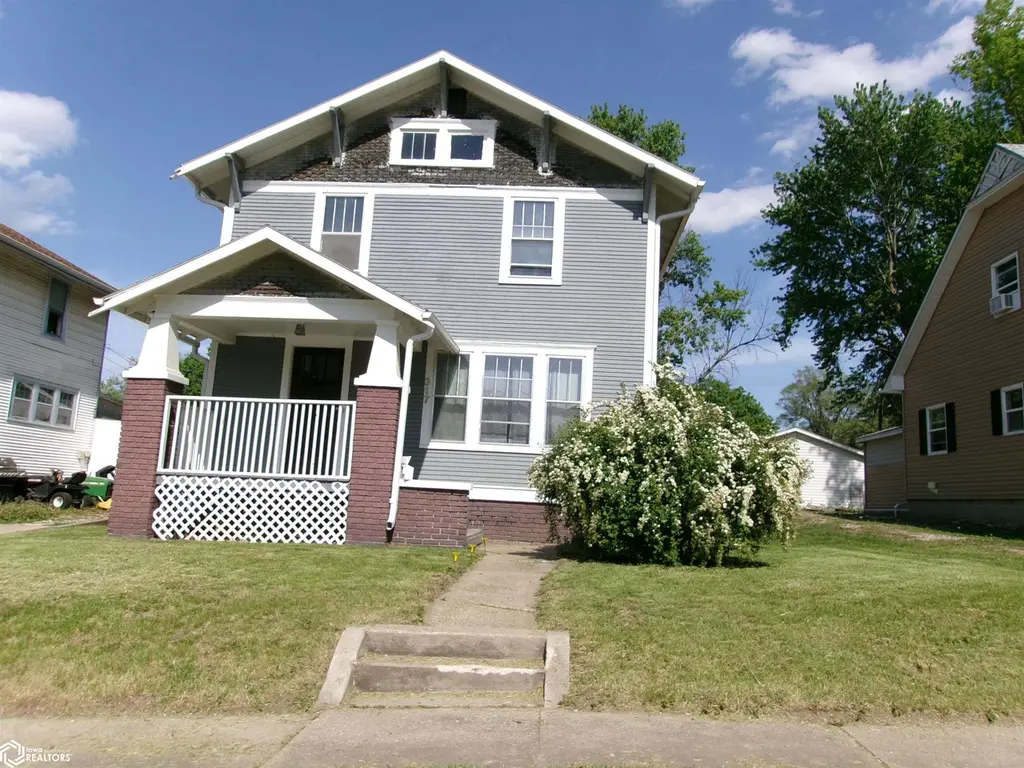
317 N Sumner St · Creston, IA
Flood risk 1/10 · Minimal
- FEMA flood zone
- X (unshaded)
- Chance of flooding over 30 yrs
- 0.0%
- Est. flood insurance / yr
- $473 – $860
Fire risk 2/10 · Minimal
- Est. fire insurance / yr
- $902 – $1,676
Heat risk 2/10 · Minimal
- Hot days now (above 103°F)
- 7 days/yr
- Hot days in 30 yrs
- 15 days/yr
Wind risk 2/10 · Minimal
- Chance of severe wind over 30 yrs
- —
Air-quality risk 2/10 · Minimal
- Unhealthy air days now
- 0 days/yr
- Unhealthy air days in 30 yrs
- 1 days/yr
Risk factors via First Street. Map © Google.
Why this score? — see what drove the B grade
The composite is a weighted blend of 9 inputs, each scored 0–100. Each bar is that input's sub-score; the figure is the points it added to the 100-point composite (weight × sub-score).
- Cash flow +30.0/30.0
- 1% rule +10.0/10.0
- DSCR +10.0/10.0
- ARV discount +7.5/15.0
- Schools +5.5/10.0
- Livability +4.0/5.0
- Rent growth +2.5/5.0
- Condition / age +2.5/5.0
- Appreciation +0.0/10.0
$65,000
🖨 Deal sheet 📄 Offer letter ✓ Due diligence
Listing remarks
Beautiful hardwood floors and woodwork grace this 1920's home. Plaster is not cracked. Updated kitchen with white cabinets. Formal dining room and large living room with open staircase. Three bedrooms and bath are all upstairs. Open front porch for your enjoyment. Enclosed back porch for a nice mudroom. Most of basement walls have been insulated. Garage is attached to neighbor's garage, a common style in that era. It is small and probably won't accommodate todays cars but is good storage for bikes and mowers, etc. It has a concrete drive. Lots of parking space in back yard. It's large enough to accommodate most campers. Back door friends are best!
Key facts
- Enclosed back porch
- Formal dining room
- Updated kitchen
Tags
Property features AI
Exterior
- Parking: Detached garage (1 car); Concrete parking; Outside parking; RV access/parking
- Utilities: Public water; Public sewer; Electric with circuit breakers
- Home design: Two levels; Single-family residence
- Construction: Frame construction with wood siding; Foundation area listed
- Exterior features: Shingle roof; Public maintained road access; City street and state road frontage; Lot dimensions approximately 50 x 160 (0.18 acres)
Interior
- Kitchen: Range
- Flooring: Hardwood; Vinyl
- Bathrooms: One full bathroom
- Heating & cooling: Central air conditioning; Forced air heating
- Interior features: Range, washer and dryer included; Hardwood and vinyl flooring; Basement present
- Laundry & utility: Washer; Dryer
Neighborhood map
What this means for you Summary
Snapshot
- This is a 3-bed/1.5-bath single-family listed at $65k.
Deal economics
- At list price, monthly cash flow is $523 ($6k/yr) — positive.
- The deal already cash-flows at list — no discount required.
- Meets the 1% rule at list price ($1k rent vs $65k).
- Recommended offer: $63k (3.0% below list) — sets the bar for market timing.
- Cap rate 16.0% vs local median 5.0% in Creston — top-decile yield for the area; either an underpriced asset or a hidden risk that comps aren't pricing in. Stress-test before assuming the spread holds.
Location & tenants
- Location reads 81/100 on livability (#76 in IA, #1,607 nationally) — a professional / high-income tenant draw. Strengths: cost of living A+, housing A+, health & safety A+; Watch: employment C-, amenities F.
- Creston Community School District (town): math 63% / reading 69% proficiency, ranked #195 of 289 in IA (top 68%) — acceptable for families but not a draw, mixed tenant base, ~2y average lease.
- Market conditions: 77 active listings in the ZIP; 5 units permitted in Union County in 2024 (0 in 5+ unit buildings).
Forward outlook
- Local home prices are declining (-3.0%/yr); year-one equity from $449 of loan paydown is wiped out by about $2k of value loss. Plan a longer hold.
- At projected returns (-3.0% appreciation + 3.0% rent growth), your $18k cash investment doubles in ~4 years — after that, you're playing with house money.
Negotiation context
- It's been on market 37 days — a 3% lower offer ($63k) is reasonable based on typical stale-listing flexibility.
- 2 sale attempts since 4y ago; this cycle's ask has dropped $5k (7%) from the opening price — seller is motivated, your offer sets the floor, not the list.
- Current owner paid $55k; 18% above their basis — modest negotiation headroom, anchor on the comps not their cost.
Risks & watch-outs
- Watch-outs: built in 1920 — expect roof / HVAC / electrical / plumbing capex.
Questions for the listing agent
- It's been on market 37 days. Have you received any prior offers? Is the seller open to a 3% concession, seller financing, or rate buy-down credit?
- Built in 1920 — when were the roof, HVAC, electrical panel, plumbing, and water heater last replaced?
- Is there a deadline driving the sale (1031 exchange, divorce, estate, relocation)? That informs how much negotiation room exists.
- Schools are B-rated — typically a magnet for longer-tenancy family renters. What's the average tenant stay here, and is there a school-zone premium baked into asking?
- What's the average days-on-market for RENTAL listings here right now (not sales)? A rising rental-DOM trend means longer vacancies and softer asking-rent achievability than the comps imply.
- What's the recent tenant-quality profile in this submarket — average credit score on applications, eviction rate, late-payment / NSF rate, and stable-employment percentage? A property-management company in the area should have these aggregated.
- How much new for-sale + rental construction is in the pipeline within 1–3 miles? Heavy new supply typically softens prices + rents 12–24 months out; constrained supply supports both.
Investment metrics
- 1% rule
- 1.92% ✓
- Cap rate
- 15.95%
- Cash-on-cash
- 34.50%
- DSCR
- 2.54
- GRM
- 4.3
CMA / ARV
- ARV (median comp)
- $137,559
- List price
- $65,000
- Delta
- -52.75%
- Verdict
- UNDERPRICED
- Comps
- 20 within 1.0 mi
Show comp detail 12 sales within ~0.75 mi
| Address | Dist | Beds/Ba | Sqft | Sold | Price | $/sf | Match |
|---|---|---|---|---|---|---|---|
| 312 N Oak St | 0.37mi | 3/1.0 | 1,320 (-2%) | 6mo | $67,000 | $51 | 73 |
| 105 N Park St | 0.41mi | 3/2.0 | 1,270 (-6%) | 2mo | $265,000 | $209 | 68 |
| 519 New York Ave | 0.61mi | 3/2.0 | 1,360 (+1%) | 2mo | $113,000 | $83 | 66 |
| 500 N Elm St | 0.44mi | 3/1.5 | 1,440 (+7%) | 2mo | $141,000 | $98 | 66 |
| 1000 N Spruce St St | 0.54mi | 3/2.0 | 1,382 (+3%) | 4mo | $235,000 | $170 | 64 |
| 610 W Montgomery St | 0.23mi | 4/2.0 (+1) | 1,510 (+12%) | 0mo | $144,000 | $95 | 61 |
| 1201 W Jefferson St | 0.35mi | 3/1.0 | 1,210 (-10%) | 6mo | $39,900 | $33 | 60 |
| 507 W Prairie St | 0.58mi | 3/1.0 | 1,296 (-4%) | 6mo | $149,750 | $116 | 60 |
| 103 N Sumner Ave | 0.20mi | 2/— (-1) | 1,146 (-15%) | 2mo | $11,000 | $10 | 59 |
| 410 N Pine St | 0.56mi | 3/1.0 | 1,460 (+9%) | 4mo | $73,000 | $50 | 54 |
| 1000 N Division St | 0.60mi | 3/1.5 | 1,498 (+12%) | 6mo | $157,500 | $105 | 48 |
| 700 Hickory St | 0.75mi | 2/1.0 (-1) | 1,260 (-6%) | 3mo | $143,650 | $114 | 45 |
Match score weights: distance 35% · size 25% · config 20% · recency 20%. Top-matched comps best support the ARV.
Projected returns pro-forma
-3.0% appreciation · 3.0% rent growth · sell at horizon
- IRR
- 30.0%
- Equity multiple
- 2.25×
- Total profit
- $22,820
- Equity at exit
- $9,692
- IRR
- 37.3%
- Equity multiple
- 4.46×
- Total profit
- $62,892
- Equity at exit
- $5,620
Cash invested: $18,200 (down + closing). Projections, not guarantees.
Landlord ↔ Tenant lean methodology
- Overall (STATE)
- 83 Strongly Landlord-Friendly
- State Iowa
- 83 Strongly Landlord-Friendly · R+6
- County
- — inherits STATE
- City
- — inherits STATE
ZIP-level market 50801
- Home prices YoY
- -5.9%
- Active inventory
- 77
- Price-to-rent
- 4.3×
Monthly cashflow live
- Estimated rent
- $1,247 medium interval (Pro) →
- Mortgage (P&I)
- −$341
- Tax from tax record
- −$94 /mo · $1,126/yr
- Insurance
- −$27
- HOA
- −$0
- Vacancy / Maint / Mgmt
- −$262
- Net cashflow
- $523
Break-even live
UW: 25.0% down · 7.5% · 30yr · 1.5% tax · 5.0% vac · 8.0% maint · 8.0% mgmt
Financing live
Cash to close
- Down payment
- $16,250
- Closing costs
- $1,950
- Reserves months
- —
- Total cash needed
- —
Loan-product check · same deal, 3 products live
Conventional
25% down · 7.5% · 30yr
- Down + closing
- —
- Monthly P&I
- —
- Monthly cashflow
- —
- DSCR
- —
- Eligible?
- —
Personal DTI + credit; lowest rate.
DSCR
20% down · 8.5% · 30yr
- Down + closing
- —
- Monthly P&I
- —
- Monthly cashflow
- —
- DSCR
- —
- Eligible?
- —
No personal income docs; deal must DSCR.
Hard money
10% down · 12.0% · 12mo
- Down + closing
- —
- Monthly P&I
- —
- Monthly cashflow
- —
- DSCR
- —
- Eligible?
- —
Short-term bridge; refi at stabilization.
Listing history 20 events
-
2026-06-18days on market $65,000 Active 37 DOM
-
2026-06-17days on market $65,000 Active 36 DOM
-
2026-06-16days on market $65,000 Active 35 DOM
-
2026-06-15days on market $65,000 Active 34 DOM
-
2026-06-13days on market $65,000 Active 32 DOM
-
2026-06-12days on market $65,000 Active 31 DOM
-
2026-06-09days on market $65,000 Active 28 DOM
-
2026-06-08days on market $65,000 Active 27 DOM
-
2026-06-07days on market $65,000 Active 26 DOM
-
2026-06-07days on market $65,000 Active 25 DOM
-
2026-06-04days on market $65,000 Active 22 DOM
-
2026-06-03price $65,000 Active 21 DOM
-
2026-06-02days on market $70,000 Active 21 DOM
-
2026-06-01days on market $70,000 Active 20 DOM
-
2026-05-31days on market $70,000 Active 19 DOM
-
2026-05-31days on market $70,000 Active 18 DOM
-
2026-05-11$70,000 Active 655-char remark
-
2023-06-09soldstatus $55,000
-
2022-03-01$48,000
-
2020-11-18soldstatus $55,000
ⓘ Source: listings_history table (triggers on properties + properties_extension) + one-shot
backfill from property_details.listing_events for pre-trigger history.
Tax reassessment forecast IA · Partial reset (capped growth)
- Current annual tax
- $1,126 · $94/mo
- Projected year-2 tax
- $1,126 · $94/mo
- Expected delta
- $0/yr ($0/mo · 0.0%)
ⓘ Screening estimate from a state-policy table — verify with the county assessor before closing.
Climate risk First Street
- Flood 1/10 Low FEMA zone X (unshaded) · 0% chance over 30 yrs
- Wildfire 2/10 Low
- Heat 2/10 Low 7 d/yr ≥103°F today · 15 d/yr by 30 yrs out
- Wind 2/10 Low
- Air quality 2/10 Low 0 unhealthy d/yr today · 1 by 30 yrs out
Nearby sold comps map
Loading sold comps map…
Walkable amenities ~0.75 mi
Loading nearby amenities…
Taxation est. · year 1
- Rental income
- $14,963
- − Mortgage interest
- −$3,641
- − Property taxes
- −$1,126
- − Insurance
- −$325
- − Repairs & maintenance
- −$1,197
- − Management
- −$1,197
- − Depreciation
- −$1,891
- Taxable income
- $5,586
- Est. tax owed @ 24.0%
- −$1,341
- After-tax cash flow
- $4,938/yr
For passive investors: Depreciation is non-cash, so a rental often shows a tax loss while cash-flowing — sheltering income. Rental losses are passive: they offset passive income freely, and up to $25,000/yr can offset ordinary (W-2) income if you actively participate and your MAGI is under $100k (phasing out to $0 by $150k); unused losses carry forward. On sale, claimed depreciation is recaptured at up to 25%, and gains may owe capital-gains tax (a 1031 exchange can defer both). Figures are a year-1 estimate at your 24.0% rate — not tax advice; consult a CPA.
Schools (NCES district)
- District
- Creston Community School District
- NCES district ID
- 1908310
- Math proficiency
- 63% ▬ 0.00%
- Reading proficiency
- 69% ▲ 4.00%
- Median HH income
- $42,292
- Composite
- 55.29/100
- National rank
- #1263
- State rank
- #195 of 289 in IA
Livability — Creston
- Score
- 81/100
- State rank
- #76
- US rank
- #1607
Category grades
Schools grade is shown separately in the Schools card above.
Census & demographics
- Census place
- Creston, IA
- Population (ZIP)
- 9,027
Population outlook (Union County) Hauer SSP2
- Today (2025)
- 12,536 people
- By 2030
- 12,561 · +0.2%
- By 2040
- 12,583 · +0.4%
- By 2050
- 12,543 · +0.1%
- By 2075
- 12,816 · +2.2%
- By 2100
- 12,754 · +1.7%
Race, ethnicity, and origin ACS 2023
- Neighborhood character
- Predominantly White (94%)
- Race & ethnicity
- White 94% Two or more races 3% Hispanic / Latino 2%
- Common ancestry
- Romanian 3% Slovak 2% Portuguese 2%
- Foreign-born
- 0%
- Languages at home
- 98% English-only · Spanish 1% German/W. Germanic 1%
Political lean MEDSL · Union
- 2024 margin
- Solid R (+36.2) · D 31.2% · R 67.4% · Other 1.3%
- 2008→2024 swing
- -39.9pp toward R · 2008: 3.7pp · 2024: -36.2pp
- All cycles
- 2024: R+36.2 2020: R+31.5 2016: R+27.8 2012: D+3.9 2008: D+3.7
Not yet ingested
- Civics
- —
Market trends
- HPI YoY
- ▼ -13.71%
- Current HPI
- 217.2057
- Rent YoY
- —
- Metro
- —
- State GDP YoY
- ▲ 2.48%
- F500 in state
- 4
Industry mix (Fortune 500 HQ in IA)
| Industry | F500 HQs | Revenue |
|---|---|---|
| Financial Services | 1 | $16B |
|
||
| Retail / Convenience | 1 | $15B |
|
||
Price history
+18.2% since first listed5 events — show timeline
- 2026-06-02 Price Changed $65,000 IAR
- 2026-05-11 Listed $70,000 IAR
- 2023-06-09 Sold (Public Records) $55,000 Public Records
- 2022-03-01 Listed $48,000 IAR
- 2020-11-18 Sold (Public Records) $55,000 Public Records
Property tax history
+2.3%/yrLatest (2025): $1,126 · +5.0% YoY. Source: county tax records.
Cash-flow waterfall
monthlySold comps — $/sqft
last 12 mo · ≤1 miLoading sold comps…