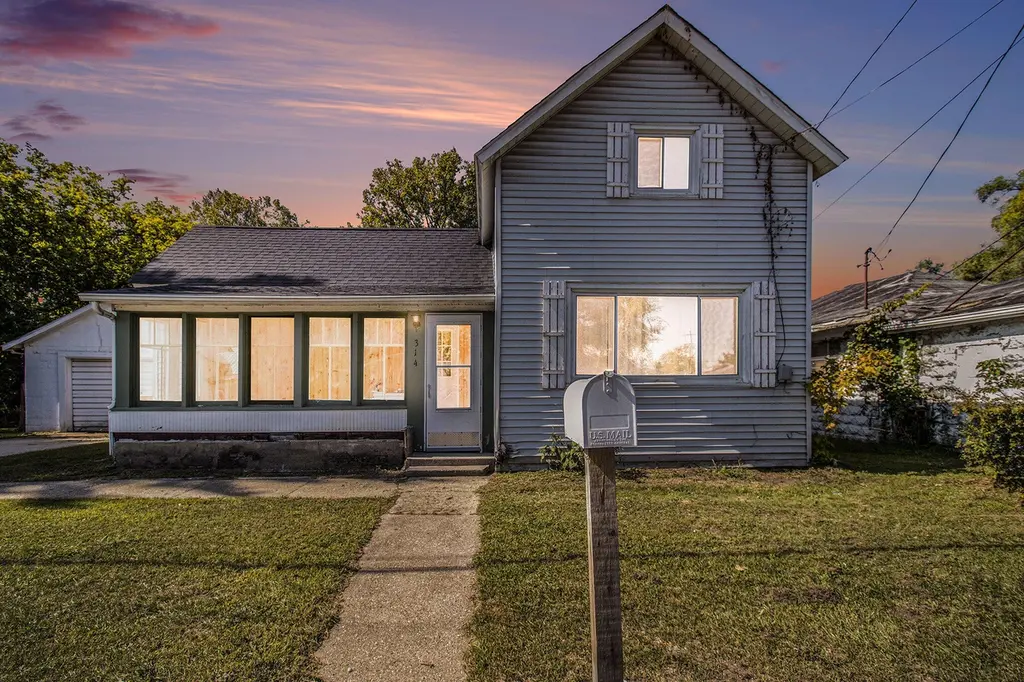
314 S 3rd Ave · Big Rapids, MI
Flood risk 1/10 · Minimal
- FEMA flood zone
- X (unshaded)
- Chance of flooding over 30 yrs
- 0.0%
- Est. flood insurance / yr
- $473 – $860
Fire risk 3/10 · Minor
- Est. fire insurance / yr
- $784 – $1,456
Heat risk 2/10 · Minimal
- Hot days now (above 95°F)
- 7 days/yr
- Hot days in 30 yrs
- 15 days/yr
Wind risk 1/10 · Minimal
- Chance of severe wind over 30 yrs
- —
Air-quality risk 2/10 · Minimal
- Unhealthy air days now
- 1 days/yr
- Unhealthy air days in 30 yrs
- 1 days/yr
Risk factors via First Street. Map © Google.
Why this score? — see what drove the D grade
The composite is a weighted blend of 9 inputs, each scored 0–100. Each bar is that input's sub-score; the figure is the points it added to the 100-point composite (weight × sub-score).
- Cash flow +14.4/30.0
- ARV discount +8.6/15.0
- DSCR +4.4/10.0
- 1% rule +4.0/10.0
- Livability +3.7/5.0
- Schools +3.6/10.0
- Rent growth +2.5/5.0
- Condition / age +2.5/5.0
- Appreciation +0.0/10.0
$150,000
🖨 Deal sheet 📄 Offer letter ✓ Due diligence
Key facts
- 7,841 sq ft lot
- Garage
- Built 1930
Neighborhood map
What this means for you Summary
Snapshot
- This is a 3-bed/1.0-bath single-family listed at $150k.
Deal economics
- At list price, monthly cash flow is $30 ($360/yr) — positive.
- The deal already cash-flows at list — no discount required.
- To meet the 1% rule (rent ≥ 1% of price), the offer needs to be $135k (10.0% below list).
- Recommended offer: $135k (10.0% below list) — sets the bar for 1% rule.
- Cap rate 6.5% vs local median 2.5% in Big Rapids — top-decile yield for the area; either an underpriced asset or a hidden risk that comps aren't pricing in. Stress-test before assuming the spread holds.
Location & tenants
- Location reads 73/100 on livability (#209 in MI) — a middle-class / working-renter tenant base. Strengths: cost of living A+, health & safety A+, housing A; Watch: amenities F, commute F, employment F.
- Big Rapids Public Schools (town): math 36% / reading 52% proficiency, ranked #176 of 540 in MI (top 33%) — families likely to look elsewhere, expect single-tenant / working-renter base with shorter leases.
- Market conditions: 191 active listings in the ZIP; 1 comparable units currently listed for rent nearby; 116 units permitted in Mecosta County in 2024 (0 in 5+ unit buildings).
Forward outlook
- Local home prices are declining (-3.0%/yr); year-one equity from $1k of loan paydown is wiped out by about $4k of value loss. Plan a longer hold.
- Mecosta County population projected to shrink 9% by 2050 — rents likely to lag national; underwrite the cash flow, not the appreciation.
Negotiation context
- Only 0 days on market — expect competitive offers; lowballing is unlikely to land.
- 16 sale attempts since 8y ago with the ask held roughly flat each time — persistent listings suggest the price (not the market) is what's stuck; bring a comps-based counter.
Risks & watch-outs
- Watch-outs: built in 1930 — expect roof / HVAC / electrical / plumbing capex.
Questions for the listing agent
- Built in 1930 — when were the roof, HVAC, electrical panel, plumbing, and water heater last replaced?
- Is there a deadline driving the sale (1031 exchange, divorce, estate, relocation)? That informs how much negotiation room exists.
- The area grade is low — what's the realistic commute time and amenity access for the typical tenant pool here? Any planned neighborhood developments (good or bad) we should know about?
- What's the average days-on-market for RENTAL listings here right now (not sales)? A rising rental-DOM trend means longer vacancies and softer asking-rent achievability than the comps imply.
- What's the recent tenant-quality profile in this submarket — average credit score on applications, eviction rate, late-payment / NSF rate, and stable-employment percentage? A property-management company in the area should have these aggregated.
- How much new for-sale + rental construction is in the pipeline within 1–3 miles? Heavy new supply typically softens prices + rents 12–24 months out; constrained supply supports both.
Investment metrics
- 1% rule
- 0.90% ✗
- Cap rate
- 6.53%
- Cash-on-cash
- 0.86%
- DSCR
- 1.04
- GRM
- 9.3
CMA / ARV
- ARV (on-the-fly)
- $153,625
- Comps found
- 12
Show comp detail 12 sales within ~0.75 mi
| Address | Dist | Beds/Ba | Sqft | Sold | Price | $/sf | Match |
|---|---|---|---|---|---|---|---|
| 202 S Bronson Ave | 0.38mi | 2/1.0 (-1) | 1,200 (-2%) | 4mo | $178,876 | $149 | 70 |
| 704 Cherry Ave | 0.53mi | 3/1.5 | 1,216 (-1%) | 2mo | $251,900 | $207 | 70 |
| 317 N 3rd Ave | 0.42mi | 3/1.0 | 1,179 (-4%) | 9mo | $147,000 | $125 | 67 |
| 216 S Warren Ave | 0.49mi | 3/1.0 | 1,170 (-5%) | 4mo | $115,000 | $98 | 66 |
| 705 Ives Ave | 0.60mi | 3/1.5 | 1,287 (+5%) | 2mo | $195,700 | $152 | 61 |
| 1212 Maple St | 0.33mi | 2/1.0 (-1) | 1,136 (-8%) | 13mo | $165,000 | $145 | 56 |
| 517 Ives Ave | 0.50mi | 3/1.5 | 1,152 (-6%) | 11mo | $212,000 | $184 | 55 |
| 521 N Michigan Ave | 0.73mi | 3/1.0 | 1,155 (-6%) | 4mo | $135,000 | $117 | 53 |
| 310 N Warren Ave | 0.51mi | 3/2.0 | 1,138 (-7%) | 9mo | $142,000 | $125 | 52 |
| 302 N Warren Ave | 0.51mi | 3/1.0 | 1,086 (-12%) | 8mo | $80,000 | $74 | 51 |
| 312 2nd Ave | 0.40mi | 4/1.0 (+1) | 1,064 (-13%) | 9mo | $85,000 | $80 | 46 |
| 718 N 3rd Ave | 0.73mi | 3/1.0 | 1,290 (+5%) | 16mo | $140,000 | $109 | 44 |
Match score weights: distance 35% · size 25% · config 20% · recency 20%. Top-matched comps best support the ARV.
Projected returns pro-forma
-3.0% appreciation · 3.0% rent growth · sell at horizon
- IRR
- -14.9%
- Equity multiple
- 0.47×
- Total profit
- $-22,377
- Equity at exit
- $22,365
- IRR
- -6.3%
- Equity multiple
- 0.60×
- Total profit
- $-16,944
- Equity at exit
- $12,969
Cash invested: $42,000 (down + closing). Projections, not guarantees.
Landlord ↔ Tenant lean methodology
- Overall (STATE)
- 62 Landlord-Friendly
- State Michigan
- 62 Landlord-Friendly · EVEN
- County
- — inherits STATE
- City
- — inherits STATE
ZIP-level market 49307
- Active inventory
- 191
- Price-to-rent
- 9.3×
Monthly cashflow live
- Estimated rent
- $1,350 medium interval (Pro) →
- Mortgage (P&I)
- −$787
- Tax est. 1.5%
- −$188 /mo · $2,250/yr
- Insurance
- −$62
- HOA
- −$0
- Vacancy / Maint / Mgmt
- −$284
- Net cashflow
- $30
Break-even live
UW: 25.0% down · 7.5% · 30yr · 1.5% tax · 5.0% vac · 8.0% maint · 8.0% mgmt
Financing live
Cash to close
- Down payment
- $37,500
- Closing costs
- $4,500
- Reserves months
- —
- Total cash needed
- —
Loan-product check · same deal, 3 products live
Conventional
25% down · 7.5% · 30yr
- Down + closing
- —
- Monthly P&I
- —
- Monthly cashflow
- —
- DSCR
- —
- Eligible?
- —
Personal DTI + credit; lowest rate.
DSCR
20% down · 8.5% · 30yr
- Down + closing
- —
- Monthly P&I
- —
- Monthly cashflow
- —
- DSCR
- —
- Eligible?
- —
No personal income docs; deal must DSCR.
Hard money
10% down · 12.0% · 12mo
- Down + closing
- —
- Monthly P&I
- —
- Monthly cashflow
- —
- DSCR
- —
- Eligible?
- —
Short-term bridge; refi at stabilization.
Rent comps 1 comps
| Address | Beds | Baths | Sqft | Rent | $/sqft | DOM | Units | Dist |
|---|---|---|---|---|---|---|---|---|
| 303 N State St Unit 3 Big Rapids, MI | 3.0 | 1.0 | 1200 | $1,300 | $1.08 | 43d | 1 | 0.70mi |
Listing history 50 events
-
2026-05-19$150,000
-
2026-05-19historical
-
2026-05-19historical
-
2026-05-19$150,000
-
2026-05-19historical
-
2026-05-19$150,000
-
2026-03-08historical
-
2026-03-07historical
-
2025-11-09price $160,000
-
2025-11-09price $160,000
-
2025-11-09price $160,000
-
2025-10-13price $169,900
-
2025-10-12price $169,900
-
2025-10-12price $169,900
-
2025-09-15price $174,900
-
2025-09-15price $174,900
-
2025-09-15price $174,900
-
2025-09-09$184,900 Active
-
2025-09-09$184,900 Active
-
2024-04-16soldstatus $140,000
-
2024-04-16soldstatus $140,000
-
2024-04-16soldstatus $140,000
-
2024-04-16$140,000
-
2024-04-16$140,000
-
2024-04-16$140,000
-
2024-03-08soldstatus $140,000
-
2024-02-22soldstatus $80,000 Sold
-
2024-02-22soldstatus $80,000 Sold
-
2024-02-22soldstatus $80,000 Closed
-
2024-02-22$99,000 Active
-
2024-02-22$99,000 Active
-
2024-02-22$99,000 Active
-
2024-02-08soldstatus $80,000
-
2024-02-07soldstatus $80,000 Sold
-
2024-02-07soldstatus $80,000 Closed
-
2024-01-18status Pending
-
2024-01-18status Pending
-
2024-01-17price $102,000
-
2024-01-16price $102,000
-
2024-01-02price $105,500
-
2024-01-02price $105,500
-
2023-11-30price $108,000
-
2023-11-30price $108,000
-
2023-11-09price $109,000
-
2023-11-09price $109,000
-
2023-10-20price $120,500
-
2023-10-20price $120,500
-
2023-10-05price $122,500
-
2023-10-05price $122,500
-
2023-09-29price $132,500
ⓘ Source: listings_history table (triggers on properties + properties_extension) + one-shot
backfill from property_details.listing_events for pre-trigger history.
Climate risk First Street
- Flood 1/10 Low FEMA zone X (unshaded) · 0% chance over 30 yrs
- Wildfire 3/10 Moderate
- Heat 2/10 Low 7 d/yr ≥95°F today · 15 d/yr by 30 yrs out
- Wind 1/10 Low
- Air quality 2/10 Low 1 unhealthy d/yr today · 1 by 30 yrs out
Nearby sold comps map
Loading sold comps map…
Walkable amenities ~0.75 mi
Loading nearby amenities…
Taxation est. · year 1
- Rental income
- $16,201
- − Mortgage interest
- −$8,402
- − Property taxes
- −$2,250
- − Insurance
- −$750
- − Repairs & maintenance
- −$1,296
- − Management
- −$1,296
- − Depreciation
- −$4,364
- Taxable loss
- −$2,157
- Est. tax savings @ 24.0%
- +$518
- After-tax cash flow
- $877/yr
For passive investors: Depreciation is non-cash, so a rental often shows a tax loss while cash-flowing — sheltering income. Rental losses are passive: they offset passive income freely, and up to $25,000/yr can offset ordinary (W-2) income if you actively participate and your MAGI is under $100k (phasing out to $0 by $150k); unused losses carry forward. On sale, claimed depreciation is recaptured at up to 25%, and gains may owe capital-gains tax (a 1031 exchange can defer both). Figures are a year-1 estimate at your 24.0% rate — not tax advice; consult a CPA.
Schools (NCES district)
- District
- Big Rapids Public Schools
- NCES district ID
- 2605780
- Math proficiency
- 36% ▼ -4.00%
- Reading proficiency
- 52% ▲ 4.00%
- Median HH income
- $35,568
- Composite
- 36.37/100
- National rank
- #4685
- State rank
- #176 of 540 in MI
Livability — Big Rapids
- Score
- 73/100
- State rank
- #209
- US rank
- #5231
Category grades
Schools grade is shown separately in the Schools card above.
Census & demographics
- Census place
- Big Rapids, MI
- County
- Mecosta County · 18,407 people
- City population
- 18,407
- Metro
- Big Rapids, MI
- Population (ZIP)
- 18,407
- Household income
- $60,358
- Rent vs Own
- Severe rent burden
- 667.0
Population outlook (Mecosta County) Hauer SSP2
- Today (2025)
- 42,954 people
- By 2030
- 42,954 · +0.0%
- By 2040
- 41,574 · -3.2%
- By 2050
- 39,250 · -8.6%
- By 2075
- 32,628 · -24.0%
- By 2100
- 27,476 · -36.0%
Race, ethnicity, and origin ACS 2023
- Neighborhood character
- Predominantly White (87%)
- Race & ethnicity
- White 87% Two or more races 5% Black 4% Hispanic / Latino 3% Asian 1%
- Common ancestry
- Romanian 6% Iranian 5% Lithuanian 3%
- Foreign-born
- 2% · Canada
- Languages at home
- 97% English-only · Spanish 1% Other Asian/Pacific 1%
Political lean MEDSL · Mecosta
- 2024 margin
- Solid R (+30.0) · D 34.2% · R 64.2% · Other 1.6%
- 2008→2024 swing
- -29.3pp toward R · 2008: -0.7pp · 2024: -30.0pp
- All cycles
- 2024: R+30.0 2020: R+28.0 2016: R+26.1 2012: R+9.8 2008: R+0.7
Not yet ingested
- Civics
- —
Market trends
- HPI YoY
- ▼ -107.88%
- Current HPI
- 199.8828
- Rent YoY
- —
- Metro
- Big Rapids, MI
- State GDP YoY
- ▲ 1.37%
- F500 in state
- 28
Industry mix (Fortune 500 HQ in MI)
| Industry | F500 HQs | Revenue |
|---|---|---|
| Automotive Parts | 3 | $48B |
|
||
| Automotive | 2 | $372B |
|
||
| Chemicals | 1 | $45B |
|
||
| Automotive Retail | 1 | $29B |
|
||
| Healthcare / Medical Devices | 1 | $23B |
|
||
| Automotive Technology | 1 | $20B |
|
||
Price history
+200.0% since first listed64 events — show timeline
- 2026-05-19 Listed $150,000 SW Michigan MLS
- 2026-05-19 Listing Removed — SW Michigan MLS
- 2026-05-19 Listed $150,000 REALCOMP
- 2026-05-19 Listing Removed — REALCOMP
- 2026-05-19 Listing Removed — MiRealSource-MiMLS
- 2026-05-19 Listed $150,000 MiRealSource-MiMLS
- 2026-03-08 Listing Removed — MiRealSource-MiMLS
- 2026-03-07 Listing Removed — REALCOMP
- 2025-11-09 Price Changed $160,000 MiRealSource-MiMLS
- 2025-11-09 Price Changed $160,000 REALCOMP
- 2025-11-09 Price Changed $160,000 SW Michigan MLS
- 2025-10-13 Price Changed $169,900 MiRealSource-MiMLS
- 2025-10-12 Price Changed $169,900 REALCOMP
- 2025-10-12 Price Changed $169,900 SW Michigan MLS
- 2025-09-15 Price Changed $174,900 MiRealSource-MiMLS
- 2025-09-15 Price Changed $174,900 REALCOMP
- 2025-09-15 Price Changed $174,900 SW Michigan MLS
- 2025-09-09 Listed $184,900 REALCOMP
- 2025-09-09 Listed $184,900 MiRealSource-MiMLS
- 2024-04-16 Listed $140,000 SW Michigan MLS
- 2024-04-16 Listed $140,000 MiRealSource-MiMLS
- 2024-04-16 Listed $140,000 REALCOMP
- 2024-04-16 Sold (MLS) $140,000 SW Michigan MLS
- 2024-04-16 Sold (MLS) $140,000 MiRealSource-MiMLS
- 2024-04-16 Sold (MLS) $140,000 REALCOMP
- 2024-03-08 Sold (Public Records) $140,000 Public Records
- 2024-02-22 Listed $99,000 MiRealSource-MiMLS
- 2024-02-22 Listed $99,000 SW Michigan MLS
- 2024-02-22 Listed $99,000 REALCOMP
- 2024-02-22 Sold (MLS) $80,000 MiRealSource-MiMLS
- 2024-02-22 Sold (MLS) $80,000 SW Michigan MLS
- 2024-02-22 Sold (MLS) $80,000 REALCOMP
- 2024-02-08 Sold (Public Records) $80,000 Public Records
- 2024-02-07 Sold (MLS) $80,000 MiRealSource-MiMLS
- 2024-02-07 Sold (MLS) $80,000 REALCOMP
- 2024-01-18 Pending — REALCOMP
- 2024-01-18 Pending — MiRealSource-MiMLS
- 2024-01-17 Price Changed $102,000 MiRealSource-MiMLS
- 2024-01-16 Price Changed $102,000 REALCOMP
- 2024-01-02 Price Changed $105,500 MiRealSource-MiMLS
- 2024-01-02 Price Changed $105,500 REALCOMP
- 2023-11-30 Price Changed $108,000 REALCOMP
- 2023-11-30 Price Changed $108,000 MiRealSource-MiMLS
- 2023-11-09 Price Changed $109,000 MiRealSource-MiMLS
- 2023-11-09 Price Changed $109,000 REALCOMP
- 2023-10-20 Price Changed $120,500 MiRealSource-MiMLS
- 2023-10-20 Price Changed $120,500 REALCOMP
- 2023-10-05 Price Changed $122,500 MiRealSource-MiMLS
- 2023-10-05 Price Changed $122,500 REALCOMP
- 2023-09-29 Price Changed $132,500 MiRealSource-MiMLS
- 2023-09-28 Price Changed $132,500 REALCOMP
- 2023-09-11 Listed $135,000 MiRealSource-MiMLS
- 2023-09-11 Listed $135,000 REALCOMP
- 2018-09-27 Sold (Public Records) $77,500 Public Records
- 2018-09-27 Sold (Public Records) $50,000 Public Records
- 2018-09-27 Sold (MLS) $77,500 MiRealSource-MiMLS
- 2018-09-27 Sold (MLS) $77,500 SW Michigan MLS
- 2018-09-27 Sold (MLS) $77,500 REALCOMP
- 2018-07-31 Pending — SW Michigan MLS
- 2018-07-13 Price Changed $77,500 SW Michigan MLS
- 2018-06-18 Listed $77,500 MiRealSource-MiMLS
- 2018-06-18 Listed $79,900 SW Michigan MLS
- 2018-06-18 Listed $77,500 REALCOMP
- 2015-09-01 Sold (Public Records) $50,000 Public Records
Cash-flow waterfall
monthlySold comps — $/sqft
last 12 mo · ≤1 miLoading sold comps…