2 Ac Melon Ln · Grand Ridge, FL
Flood risk 1/10 · Minimal
- FEMA flood zone
- X (unshaded)
- Chance of flooding over 30 yrs
- 0.0%
- Est. flood insurance / yr
- $507 – $1,088
Fire risk 3/10 · Minor
- Est. fire insurance / yr
- $947 – $1,759
Heat risk 8/10 · Major
- Hot days now (above 108°F)
- 7 days/yr
- Hot days in 30 yrs
- 19 days/yr
Wind risk 9/10 · Severe
- Chance of severe wind over 30 yrs
- 99.0%
Air-quality risk 3/10 · Minor
- Unhealthy air days now
- 3 days/yr
- Unhealthy air days in 30 yrs
- 3 days/yr
Risk factors via First Street. Map © Google.
Why this score? — see what drove the B- grade
The composite is a weighted blend of 9 inputs, each scored 0–100. Each bar is that input's sub-score; the figure is the points it added to the 100-point composite (weight × sub-score).
- Cash flow +23.7/30.0
- Appreciation +10.0/10.0
- DSCR +7.6/10.0
- ARV discount +7.5/15.0
- 1% rule +6.2/10.0
- Schools +4.2/10.0
- Livability +3.0/5.0
- Rent growth +2.5/5.0
- Condition / age +2.5/5.0
$77,500
🖨 Deal sheet (PDF) 📄 Offer letter ✓ Due diligence
Listing remarks
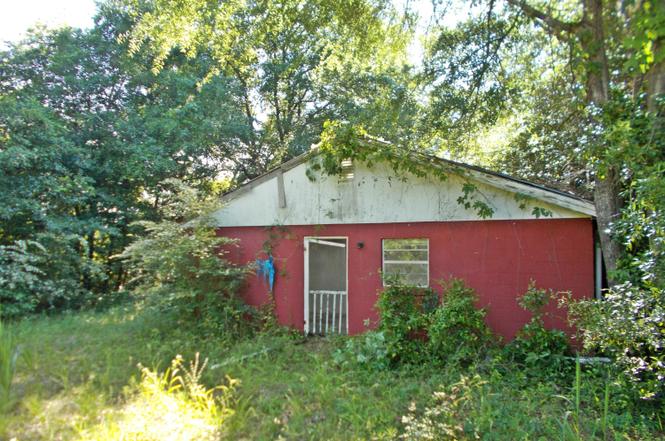
Barn dominium lovers with space for a nice garden or some animals, no restrictions on this property, there is also additional acreage available. There are some beautiful live oaks. Drive by and look at it.
Key facts
- Beautiful live oaks
- Barndominium lovers
- 2 acre lot
Tags
Property features AI
Finance
- Other: Lot approximately 2 acres (dimensions ~290 x 300)
- Financial info: Annual property tax reported for 2023
- HOA & community: No HOA information provided
Exterior
- Parking: No parking information provided
- Security: No security information provided
- Utilities: No water, sewer, or power details provided
- Home design: Property type: Not specified; Stories: Not specified; Entry level: Not specified; Facing direction: Not specified
- Construction: Block construction; Composition/shingle roof
- Exterior features: Maintained road access; Zoned County
Interior
- Kitchen: Kitchen with breakfast area (part of 12 x 20 space)
- Bedrooms: No bedrooms specified
- Flooring: No flooring information provided
- Bathrooms: 1 full bathroom
- Heating & cooling: No heating or cooling information provided
- Interior features: Living space area with an open layout (20 x 20); Second area includes bathroom and kitchen/breakfast space (12 x 20)
- Laundry & utility: No laundry or utility details provided
Neighborhood map
What this means for you Summary
Snapshot
- This is a 1-bed/1.0-bath single-family listed at $78k.
Deal economics
- At list price, monthly cash flow is $147 ($2k/yr) — positive.
- The deal already cash-flows at list — no discount required.
- Meets the 1% rule at list price ($865 rent vs $78k).
- Recommended offer: $68k (12.0% below list) — sets the bar for market timing.
Location & tenants
- Location reads 59/100 on livability (#813 in FL) — a working-class tenant base; expect higher turnover. Strengths: cost of living A+, housing A-; Watch: crime D+, health & safety D, amenities F.
- Jackson (rural): math 47% / reading 54% proficiency, ranked #39 of 73 in FL (top 53%) — acceptable for families but not a draw, mixed tenant base, ~2y average lease.
- Market conditions: 25 active listings in the ZIP; 153 units permitted in Jackson County in 2024 (40 in 5+ unit buildings).
Forward outlook
- In year one you build about $8k of equity ($536 loan paydown + $8k appreciation (10.0% local appreciation)).
- Jackson County population projected at -18% by 2050 — secular population decline; favor cash flow + early exit over multi-decade hold.
- At projected returns (10.0% appreciation + 3.0% rent growth), your $22k cash investment doubles in ~3 years — after that, you're playing with house money.
- By year 5, paydown + projected appreciation supports a ~$39k cash-out refi (75% LTV) — recoverable capital for the next deal without selling this one.
Negotiation context
- It's been on market 780 days — a 12% lower offer ($68k) is reasonable based on typical stale-listing flexibility.
- 2 sale attempts since 2y ago with the ask held roughly flat each time — persistent listings suggest the price (not the market) is what's stuck; bring a comps-based counter.
Risks & watch-outs
- Climate carrying-cost: severe wind risk, 99% chance of damaging wind over 30y; extreme-heat days projected 7→19/yr by 2055 (HVAC capex compounding) — expect insurance premiums to compound above CPI over the hold.
Questions for the listing agent
- It's been on market 780 days. Have you received any prior offers? Is the seller open to a 12% concession, seller financing, or rate buy-down credit?
- Built in 1976 — when were the roof, HVAC, electrical panel, plumbing, and water heater last replaced?
- Why hasn't it sold? Are there any deal-killer items the seller is aware of (foundation, flood, title, zoning, code violations)?
- Is there a deadline driving the sale (1031 exchange, divorce, estate, relocation)? That informs how much negotiation room exists.
- Crime grade is D in this area — have there been break-ins, vandalism, or insurance claims at this property in the last 3 years? What carrier currently insures it and at what premium?
- What's the average days-on-market for RENTAL listings here right now (not sales)? A rising rental-DOM trend means longer vacancies and softer asking-rent achievability than the comps imply.
- What's the recent tenant-quality profile in this submarket — average credit score on applications, eviction rate, late-payment / NSF rate, and stable-employment percentage? A property-management company in the area should have these aggregated.
- How much new for-sale + rental construction is in the pipeline within 1–3 miles? Heavy new supply typically softens prices + rents 12–24 months out; constrained supply supports both.
Investment metrics
- 1% rule
- 1.12% ✓
- Cap rate
- 8.58%
- Cash-on-cash
- 8.15%
- DSCR
- 1.36
- GRM
- 7.5
CMA / ARV
No comps found within radius.
Projected returns pro-forma
10.0% appreciation · 3.0% rent growth · sell at horizon
- IRR
- 30.2%
- Equity multiple
- 3.38×
- Total profit
- $51,611
- Equity at exit
- $69,818
- IRR
- 26.2%
- Equity multiple
- 7.66×
- Total profit
- $144,627
- Equity at exit
- $150,565
Cash invested: $21,700 (down + closing). Projections, not guarantees.
Landlord ↔ Tenant lean methodology
- Overall (STATE)
- 87 Strongly Landlord-Friendly
- State Florida
- 87 Strongly Landlord-Friendly · R+3
- County
- — inherits STATE
- City
- — inherits STATE
ZIP-level market 32442
- Home prices YoY
- 7.7%
- Active inventory
- 25
- Price-to-rent
- 7.5×
Monthly cashflow live
- Estimated rent
- $865 medium interval (Pro) →
- Mortgage (P&I)
- −$406
- Tax est. 1.5%
- −$97 /mo · $1,162/yr
- Insurance
- −$32
- HOA
- −$0
- Vacancy / Maint / Mgmt
- −$182
- Net cashflow
- $147
Break-even live
Sensitivity live
| Price | -10% $201 | -5% $174 | +0% $147 | +5% $121 | +10% $94 |
|---|---|---|---|---|---|
| Rent | -10% $79 | -5% $113 | +0% $147 | +5% $182 | +10% $216 |
| Rate | -1.0pp $186 | -0.5pp $167 | base $147 | +0.5pp $127 | +1.0pp $107 |
UW: 25.0% down · 7.5% · 30yr · 1.5% tax · 5.0% vac · 8.0% maint · 8.0% mgmt
Financing live
Cash to close
- Down payment
- $19,375
- Closing costs
- $2,325
- Reserves months
- —
- Total cash needed
- —
Loan-product check · same deal, 3 products live
Conventional
25% down · 7.5% · 30yr
- Down + closing
- —
- Monthly P&I
- —
- Monthly cashflow
- —
- DSCR
- —
- Eligible?
- —
Personal DTI + credit; lowest rate.
DSCR
20% down · 8.5% · 30yr
- Down + closing
- —
- Monthly P&I
- —
- Monthly cashflow
- —
- DSCR
- —
- Eligible?
- —
No personal income docs; deal must DSCR.
Hard money
10% down · 12.0% · 12mo
- Down + closing
- —
- Monthly P&I
- —
- Monthly cashflow
- —
- DSCR
- —
- Eligible?
- —
Short-term bridge; refi at stabilization.
Listing history 18 events
-
2026-06-21days on market $77,500 Active 780 DOM
-
2026-06-18days on market $77,500 Active 778 DOM
-
2026-06-17days on market $77,500 Active 777 DOM
-
2026-06-16days on market $77,500 Active 776 DOM
-
2026-06-15days on market $77,500 Active 775 DOM
-
2026-06-13days on market $77,500 Active 773 DOM
-
2026-06-12days on market $77,500 Active 772 DOM
-
2026-06-09days on market $77,500 Active 769 DOM
-
2026-06-08days on market $77,500 Active 768 DOM
-
2026-06-07days on market $77,500 Active 767 DOM
-
2026-06-04days on market $77,500 Active 763 DOM
-
2026-06-02days on market $77,500 Active 762 DOM
-
2026-06-01days on market $77,500 Active 761 DOM
-
2026-05-31days on market $77,500 Active 760 DOM
-
2026-05-31days on market $77,500 Active 759 DOM
-
2024-09-18status Active
-
2024-09-10status Pending
-
2024-04-24$77,500 Active
ⓘ Source: listings_history table (triggers on properties + properties_extension) + one-shot
backfill from property_details.listing_events for pre-trigger history.
Climate risk First Street
- Flood 1/10 Low FEMA zone X (unshaded) · 0% chance over 30 yrs
- Wildfire 3/10 Moderate
- Heat 8/10 Severe 7 d/yr ≥108°F today · 19 d/yr by 30 yrs out
- Wind 9/10 Extreme 99% chance of damaging wind over 30 yrs
- Air quality 3/10 Moderate 3 unhealthy d/yr today · 3 by 30 yrs out
Nearby sold comps map
Loading sold comps map…
Walkable amenities ~0.75 mi
Loading nearby amenities…
Taxation est. · year 1
- Rental income
- $10,375
- − Mortgage interest
- −$4,341
- − Property taxes
- −$1,162
- − Insurance
- −$388
- − Repairs & maintenance
- −$830
- − Management
- −$830
- − Depreciation
- −$2,255
- Taxable income
- $569
- Est. tax owed @ 24.0%
- −$137
- After-tax cash flow
- $1,632/yr
For passive investors: Depreciation is non-cash, so a rental often shows a tax loss while cash-flowing — sheltering income. Rental losses are passive: they offset passive income freely, and up to $25,000/yr can offset ordinary (W-2) income if you actively participate and your MAGI is under $100k (phasing out to $0 by $150k); unused losses carry forward. On sale, claimed depreciation is recaptured at up to 25%, and gains may owe capital-gains tax (a 1031 exchange can defer both). Figures are a year-1 estimate at your 24.0% rate — not tax advice; consult a CPA.
Schools (NCES district)
- District
- Jackson
- NCES district ID
- 1200960
- Math proficiency
- 47% ▼ -9.00%
- Reading proficiency
- 54% ▼ -3.00%
- Median HH income
- $36,824
- Composite
- 41.92/100
- National rank
- #3358
- State rank
- #39 of 73 in FL
Livability — Grand Ridge
- Score
- 59/100
- State rank
- #813
- US rank
- #19820
Category grades
Schools grade is shown separately in the Schools card above.
Census & demographics
- Population (ZIP)
- 3,709
Population outlook (Jackson County) Hauer SSP2
- Today (2025)
- 46,095 people
- By 2030
- 44,432 · -3.6%
- By 2040
- 41,077 · -10.9%
- By 2050
- 37,587 · -18.5%
- By 2075
- 28,921 · -37.3%
- By 2100
- 19,332 · -58.1%
Race, ethnicity, and origin ACS 2023
- Neighborhood character
- Predominantly White (81%)
- Race & ethnicity
- White 81% Two or more races 8% Black 6% Hispanic / Latino 4%
- Common ancestry
- Scottish 2% Italian 2% German 2%
- Foreign-born
- 2% · Canada
- Languages at home
- 98% English-only · Spanish 2%
Political lean MEDSL · Jackson
- 2024 margin
- Solid R (+46.1) · D 26.7% · R 72.7%
- 2008→2024 swing
- -18.0pp toward R · 2008: -28.0pp · 2024: -46.1pp
- All cycles
- 2024: R+46.1 2020: R+38.9 2016: R+37.4 2012: R+29.0 2008: R+28.0
Not yet ingested
- Civics
- —
Market trends
- HPI YoY
- ▲ 11.54%
- Current HPI
- 161.0099
- Rent YoY
- —
- Metro
- —
- State GDP YoY
- ▲ 3.28%
- F500 in state
- 36
Industry mix (Fortune 500 HQ in FL)
| Industry | F500 HQs | Revenue |
|---|---|---|
| Industrial Technology | 2 | $29B |
|
||
| Insurance | 2 | $17B |
|
||
| Retail | 1 | $60B |
|
||
| Technology Distribution | 1 | $58B |
|
||
| Homebuilding | 1 | $35B |
|
||
| Technology Manufacturing | 1 | $35B |
|
||
Price history
3 events — show timeline
- 2024-09-18 Relisted — CPARMLS
- 2024-09-10 Pending — CPARMLS
- 2024-04-24 Listed $77,500 CPARMLS
Cash-flow waterfall
monthlySold comps — $/sqft
last 12 mo · ≤1 miLoading sold comps…