5015 E Ustick Rd #172 · Caldwell, ID
Flood risk No data
- FEMA flood zone
- —
- Chance of flooding over 30 yrs
- —
- Est. flood insurance / yr
- —
Fire risk No data
- Est. fire insurance / yr
- —
Heat risk No data
- Hot days now (above threshold)
- —
- Hot days in 30 yrs
- —
Wind risk No data
- Chance of severe wind over 30 yrs
- —
Air-quality risk No data
- Unhealthy air days now
- —
- Unhealthy air days in 30 yrs
- —
Risk factors via First Street. Map © Google.
Why this score? — see what drove the C+ grade
The composite is a weighted blend of 9 inputs, each scored 0–100. Each bar is that input's sub-score; the figure is the points it added to the 100-point composite (weight × sub-score).
- Cash flow +30.0/30.0
- 1% rule +10.0/10.0
- DSCR +10.0/10.0
- Livability +3.4/5.0
- Rent growth +3.2/5.0
- Condition / age +2.5/5.0
- Schools +2.0/10.0
- ARV discount +0.4/15.0
- Appreciation +0.0/10.0
$99,500
🖨 Deal sheet 📄 Offer letter ✓ Due diligence
Listing remarks
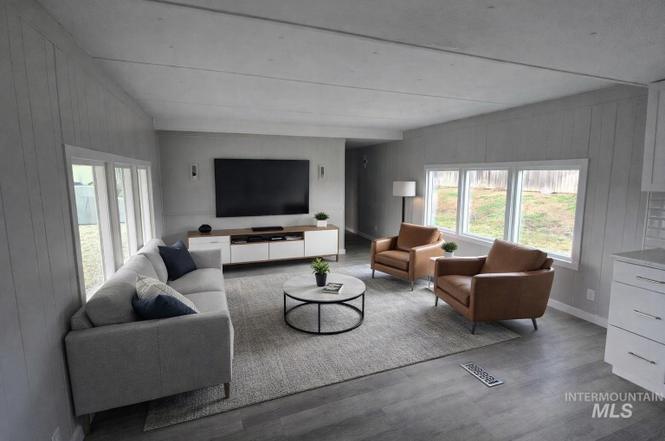
Welcome to this beautifully remodeled 3-bedroom, 1.5-bath home featuring new interior paint, new carpet, new windows, updated flooring, trim, light fixtures, and new bathroom fixtures throughout. The bright kitchen offers ample cabinet space and flows into a comfortable living area. Enjoy the covered front patio for relaxing mornings or evenings. The property also includes a storage shed and an insulated shed with power and heater, perfect for a workshop, office, or hobby space. Move-in ready with versatile bonus space. Ideal for first-time buyers, downsizers, or anyone seeking affordable living. Close to shopping, restaurants, and other amenities. Monthly lot rent is $495. Buyer and Buyers
Key facts
- Remodeled
- New carpet
- Covered front patio
Tags
Property features AI
Exterior
- Utilities: City water service; Sewer connected
- Home design: Mobile/manufactured home on rented lot; Built in 1972
- Construction: Metal siding
- Exterior features: Partial wood fencing; Metal roof; Irrigation available with manual sprinkler system; Cul-de-sac lot; Property located in a mobile home park
Interior
- Kitchen: Oven/Range (freestanding); Refrigerator
- Bedrooms: 3 bedrooms — all on the main level
- Flooring: Tile; Carpet
- Bathrooms: 2 bathrooms
- Heating & cooling: Electric forced-air heating; Central air conditioning
- Interior features: Master bedroom on main level; Kitchen island; Laminate countertops
- Laundry & utility: Electric water heater
Neighborhood map
What this means for you Summary
Snapshot
- This is a 3-bed/2.0-bath manufactured listed at $100k.
Deal economics
- At list price, monthly cash flow is $730 ($9k/yr) — positive.
- The deal already cash-flows at list — no discount required.
- Meets the 1% rule at list price ($2k rent vs $100k).
- Recommended offer: $94k (6.0% below list) — sets the bar for market timing.
- Cap rate 15.1% vs local median 3.1% in Caldwell — top-decile yield for the area; either an underpriced asset or a hidden risk that comps aren't pricing in. Stress-test before assuming the spread holds.
Location & tenants
- Location reads 67/100 on livability (#88 in ID) — a middle-class / working-renter tenant base. Strengths: cost of living A+, housing A+; Watch: crime C-, employment D+, amenities F.
- Caldwell District (suburban): math 17% / reading 31% proficiency, ranked #90 of 92 in ID (top 98%) — low school quality limits family demand, transient renter base, plan for 1-2y turnover; 72% free/reduced lunch — lower-income household profile, screen leases tightly.
- Zoned schools: Washington Elementary School (math 12% / reading 16%, grade F, #355 of 357 statewide, top 99%, 508 students, 91% FRL); Canyon Springs High School (math 5% / reading 5%, grade F, #167 of 169 statewide, top 100%, 208 students, 94% FRL) — zoned schools average 92% FRL vs 72% district-wide (21 pts higher); higher-poverty schools than district average — tighter screening recommended.
- Zoned-school proficiency averages 10% at this address vs 24% district-wide (-14 pts) — the specific schools serving this property underperform the Caldwell District average; the district grade overstates school quality for this exact location.
- Market conditions: Rents rising (+2.7%/yr); 341 active listings in the ZIP; 12 comparable units currently listed for rent nearby; rentals at typical pace (median 15d on market — plan ~3-4 weeks tenant-placement turnaround); 3,620 units permitted in Canyon County in 2024 (196 in 5+ unit buildings).
Forward outlook
- Local home prices are declining (-3.0%/yr); year-one equity from $688 of loan paydown is wiped out by about $3k of value loss. Plan a longer hold.
- Canyon County population projected at +41% by 2050 — long-run rental-demand tailwind backs the buy-and-hold thesis.
- At projected returns (-3.0% appreciation + 2.7% rent growth), your $28k cash investment doubles in ~4 years — after that, you're playing with house money.
Negotiation context
- It's been on market 77 days — a 6% lower offer ($94k) is reasonable based on typical stale-listing flexibility.
Questions for the listing agent
- It's been on market 77 days. Have you received any prior offers? Is the seller open to a 6% concession, seller financing, or rate buy-down credit?
- Built in 1972 — when were the roof, HVAC, electrical panel, plumbing, and water heater last replaced?
- Why hasn't it sold? Are there any deal-killer items the seller is aware of (foundation, flood, title, zoning, code violations)?
- Is there a deadline driving the sale (1031 exchange, divorce, estate, relocation)? That informs how much negotiation room exists.
- Schools are D-rated, which usually means shorter tenancies and higher turnover. Who's the typical renter profile here, and what's been the actual vacancy rate?
- What's the average days-on-market for RENTAL listings here right now (not sales)? A rising rental-DOM trend means longer vacancies and softer asking-rent achievability than the comps imply.
- What's the recent tenant-quality profile in this submarket — average credit score on applications, eviction rate, late-payment / NSF rate, and stable-employment percentage? A property-management company in the area should have these aggregated.
- How much new for-sale + rental construction is in the pipeline within 1–3 miles? Heavy new supply typically softens prices + rents 12–24 months out; constrained supply supports both.
Investment metrics
- 1% rule
- 1.67% ✓
- Cap rate
- 15.09%
- Cash-on-cash
- 31.43%
- DSCR
- 2.40
- GRM
- 5.0
CMA / ARV
- ARV (on-the-fly)
- $85,932
- Comps found
- 8
Show comp detail 8 sales within ~0.75 mi
| Address | Dist | Beds/Ba | Sqft | Sold | Price | $/sf | Match |
|---|---|---|---|---|---|---|---|
| 5015 E Ustick Rd #181 | 0.00mi | 2/2.0 (-1) | 924 (0%) | 0mo | $85,000 | $92 | 95 |
| 5015 E Ustick Rd #111 | 0.00mi | 3/1.0 | 924 (0%) | 14mo | $104,000 | $113 | 84 |
| 5015 E Ustick #164 | 0.00mi | 2/2.0 (-1) | 924 (0%) | 14mo | $96,500 | $104 | 83 |
| 5015 E Ustick Rd #143 | 0.00mi | 2/1.0 (-1) | 924 (0%) | 17mo | $94,000 | $102 | 77 |
| 107 Lancelot Ct | 0.23mi | 2/1.0 (-1) | 937 (+1%) | 2mo | $80,000 | $85 | 76 |
| 200 Friar Dr | 0.23mi | 2/1.0 (-1) | 924 (0%) | 5mo | $85,000 | $92 | 76 |
| 5016 E Ustick Rd #16 | 0.32mi | 2/1.0 (-1) | 918 (-1%) | 7mo | $85,000 | $93 | 69 |
| 5015 E Ustick Rd #154 | 0.00mi | 3/1.5 | 1,024 (+11%) | 22mo | $95,000 | $93 | 62 |
Match score weights: distance 35% · size 25% · config 20% · recency 20%. Top-matched comps best support the ARV.
Projected returns pro-forma
-3.0% appreciation · 2.69% rent growth · sell at horizon
- IRR
- 25.9%
- Equity multiple
- 2.07×
- Total profit
- $29,800
- Equity at exit
- $14,836
- IRR
- 33.4%
- Equity multiple
- 4.00×
- Total profit
- $83,532
- Equity at exit
- $8,603
Cash invested: $27,860 (down + closing). Projections, not guarantees.
Landlord ↔ Tenant lean methodology
- Overall (STATE)
- 91 Strongly Landlord-Friendly
- State Idaho
- 91 Strongly Landlord-Friendly · R+18
- County
- — inherits STATE
- City
- — inherits STATE
ZIP-level market 83605
- Home prices YoY
- -27.0%
- Rents YoY
- 2.7%
- Active inventory
- 341
- Price-to-rent
- 5.0×
Monthly cashflow live
- Estimated rent
- $1,660 high interval (Pro) →
- Mortgage (P&I)
- −$522
- Tax from tax record
- −$19 /mo · $224/yr
- Insurance
- −$41
- HOA
- −$0
- Vacancy / Maint / Mgmt
- −$349
- Net cashflow
- $730
Break-even live
UW: 25.0% down · 7.5% · 30yr · 1.5% tax · 5.0% vac · 8.0% maint · 8.0% mgmt
Financing live
Cash to close
- Down payment
- $24,875
- Closing costs
- $2,985
- Reserves months
- —
- Total cash needed
- —
Loan-product check · same deal, 3 products live
Conventional
25% down · 7.5% · 30yr
- Down + closing
- —
- Monthly P&I
- —
- Monthly cashflow
- —
- DSCR
- —
- Eligible?
- —
Personal DTI + credit; lowest rate.
DSCR
20% down · 8.5% · 30yr
- Down + closing
- —
- Monthly P&I
- —
- Monthly cashflow
- —
- DSCR
- —
- Eligible?
- —
No personal income docs; deal must DSCR.
Hard money
10% down · 12.0% · 12mo
- Down + closing
- —
- Monthly P&I
- —
- Monthly cashflow
- —
- DSCR
- —
- Eligible?
- —
Short-term bridge; refi at stabilization.
Rent comps 12 comps
| Address | Beds | Baths | Sqft | Rent | $/sqft | DOM | Units | Dist |
|---|---|---|---|---|---|---|---|---|
| 4209 Saylor Ln Caldwell, ID | 2.0 | 2.0 | 1040 | $1,925 | $1.85 | 21d | 1 | 0.84mi |
| 4901 Maid Jessica St Caldwell, ID | 2.0 | 1.5 | 900 | $1,450 | $1.61 | 14d | 1 | 0.85mi |
| 5218 Guitar Ln Caldwell, ID | 2.0 | 2.0 | 920 | $1,422 | $1.55 | 2d | 6 | 1.01mi |
| 3304 S Florida Ave Caldwell, ID | 3.0 | 1.0 | 1000 | $1,395 | $1.40 | 23d | 1 | 1.24mi |
| 6903 Noah Ct Caldwell, ID | 2.0 | 2.0 | 990 | $1,550 | $1.57 | 14d | 1 | 1.25mi |
| 6921 Noah Ct Caldwell, ID | 2.0 | 2.0 | 990 | $1,450 | $1.46 | 21d | 1 | 1.30mi |
| 401 Canyon Village Ln Caldwell, ID | 1.0–3.0 | 1.0–3.0 | 1161 | $2,758 | $2.38 | 3d | 31 | 1.30mi |
| 209 Abraham Way Caldwell, ID | 2.0 | 1.0 | 840 | $1,350 | $1.61 | 23d | 1 | 1.35mi |
| 7012 Noah Dr Caldwell, ID | 2.0 | 2.0 | 940 | $1,550 | $1.65 | 21d | 1 | 1.37mi |
| 10890 Blue River Ln Nampa, ID | 1.0–2.0 | 1.0–2.5 | 832 | $1,696 | $2.04 | 3d | 8 | 1.41mi |
| 4612 Lexington Sky Ln Caldwell, ID | 2.0 | 2.0 | 985 | $1,445 | $1.47 | 2d | 1 | 1.42mi |
| 5012 Hamlet Ln Caldwell, ID | 1.0–2.0 | 1.0–1.5 | 998 | $1,550 | $1.55 | 2d | 2 | 1.49mi |
Listing history 2 events
-
2026-04-10price $99,500
-
2026-03-12$102,900 Active
ⓘ Source: listings_history table (triggers on properties + properties_extension) + one-shot
backfill from property_details.listing_events for pre-trigger history.
Tax reassessment forecast ID · Resets to sale price
- Current annual tax
- $224 · $19/mo
- Projected year-2 tax
- $687 · $57/mo
- Expected delta
- +$463/yr (+$39/mo · 206.9%)
ⓘ Screening estimate from a state-policy table — verify with the county assessor before closing.
Nearby sold comps map
Loading sold comps map…
Walkable amenities ~0.75 mi
Loading nearby amenities…
Taxation est. · year 1
- Rental income
- $19,924
- − Mortgage interest
- −$5,574
- − Property taxes
- −$224
- − Insurance
- −$498
- − Repairs & maintenance
- −$1,594
- − Management
- −$1,594
- − Depreciation
- −$2,895
- Taxable income
- $7,547
- Est. tax owed @ 24.0%
- −$1,811
- After-tax cash flow
- $6,946/yr
For passive investors: Depreciation is non-cash, so a rental often shows a tax loss while cash-flowing — sheltering income. Rental losses are passive: they offset passive income freely, and up to $25,000/yr can offset ordinary (W-2) income if you actively participate and your MAGI is under $100k (phasing out to $0 by $150k); unused losses carry forward. On sale, claimed depreciation is recaptured at up to 25%, and gains may owe capital-gains tax (a 1031 exchange can defer both). Figures are a year-1 estimate at your 24.0% rate — not tax advice; consult a CPA.
Schools (NCES district)
- District
- Caldwell District
- NCES district ID
- 1600510
- Math proficiency
- 17% ▼ -11.00%
- Reading proficiency
- 31% ▼ -4.00%
- Median HH income
- $36,116
- Composite
- 19.85/100
- National rank
- #8694
- State rank
- #90 of 92 in ID
Livability — Caldwell
- Score
- 67/100
- State rank
- #88
- US rank
- #10145
Category grades
Schools grade is shown separately in the Schools card above.
Census & demographics
- Census place
- Caldwell, ID
- County
- Canyon County · 235,358 people
- City population
- 76,816
- Metro
- Boise City, ID
- Population (ZIP)
- 41,325
- Household income
- $68,427
- Rent vs Own
- Severe rent burden
- 719.0
Population outlook (Canyon County) Hauer SSP2
- Today (2025)
- 248,853 people
- By 2030
- 269,596 · +8.3%
- By 2040
- 311,081 · +25.0%
- By 2050
- 350,809 · +41.0%
- By 2075
- 441,884 · +77.6%
- By 2100
- 505,641 · +103.2%
Race, ethnicity, and origin ACS 2023
- Neighborhood character
- Diverse neighborhood (Simpson 0.56)
- Race & ethnicity
- White 51% Hispanic / Latino 42% Two or more races 15% Native American 1%
- Hispanic origin (detail)
- Mexican 36%
- Common ancestry
- Lithuanian 3% Slovak 2% Italian 2%
- Foreign-born
- 13% · Canada
- Languages at home
- 71% English-only · Spanish 27% Russian/Polish/Slavic 1%
Political lean MEDSL · Canyon
- 2024 margin
- Solid R (+46.6) · D 25.4% · R 72.0% · Other 2.5%
- 2008→2024 swing
- -11.4pp toward R · 2008: -35.2pp · 2024: -46.6pp
- All cycles
- 2024: R+46.6 2020: R+39.7 2016: R+41.8 2012: R+37.1 2008: R+35.2
Not yet ingested
- Civics
- —
Market trends
- HPI YoY
- ▼ -135.47%
- Current HPI
- 366.7896
- Rent YoY
- ▲ 2.69%
- Metro
- Boise City, ID
- State GDP YoY
- ▲ 4.51%
- F500 in state
- 6
Industry mix (Fortune 500 HQ in ID)
| Industry | F500 HQs | Revenue |
|---|---|---|
| Retail | 1 | $79B |
|
||
| Technology | 1 | $25B |
|
||
| Food / Agriculture | 1 | $6B |
|
||
Price history
-3.3% since first listed2 events — show timeline
- 2026-04-10 Price Changed $99,500 IMLS
- 2026-03-12 Listed $102,900 IMLS
Property tax history
-4.8%/yrLatest (2025): $224 · +16.1% YoY. Source: county tax records.
Cash-flow waterfall
monthlySold comps — $/sqft
last 12 mo · ≤1 miLoading sold comps…