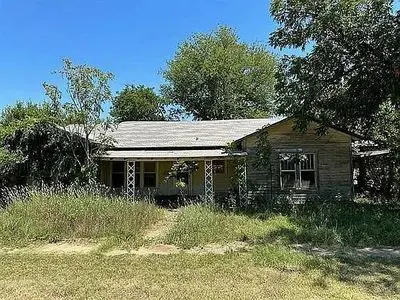
500 Vine St · Baird, TX
Flood risk 1/10 · Minimal
- FEMA flood zone
- X
- Chance of flooding over 30 yrs
- 0.0%
- Est. flood insurance / yr
- $507 – $1,088
Fire risk 8/10 · Major
- Est. fire insurance / yr
- $1,222 – $2,270
Heat risk 6/10 · Moderate
- Hot days now (above 104°F)
- 7 days/yr
- Hot days in 30 yrs
- 22 days/yr
Wind risk 4/10 · Minor
- Chance of severe wind over 30 yrs
- 14.0%
Air-quality risk 1/10 · Minimal
- Unhealthy air days now
- 0 days/yr
- Unhealthy air days in 30 yrs
- 0 days/yr
Risk factors via First Street. Map © Google.
Why this score? — see what drove the C- grade
The composite is a weighted blend of 9 inputs, each scored 0–100. Each bar is that input's sub-score; the figure is the points it added to the 100-point composite (weight × sub-score).
- Cash flow +15.0/30.0
- Appreciation +8.9/10.0
- ARV discount +7.5/15.0
- 1% rule +5.0/10.0
- DSCR +5.0/10.0
- Livability +3.7/5.0
- Schools +3.6/10.0
- Rent growth +2.5/5.0
- Condition / age +2.5/5.0
$10,000
🖨 Deal sheet (PDF) 📄 Offer letter ✓ Due diligence
Listing remarks MLS
Investors special or a great fixer upper. Unbeatable price! Home on 2 lots with 2 kitchens, 2 bathrooms and 2 bedrooms, faux fireplace in living room, large room for office or area to expand for an additional dining room or larger kitchen. Wood floors under some of the carpet. Great covered front porch, large yard, pomegranate tree and lots of shade trees to help keep the house cool in the summer. Bring your ideas and make this your home. Buyer and Buyer agent to verify measurements.
Key facts
- Built 1935
Neighborhood map
What this means for you Summary
Snapshot
- This is a 1-bed/1.0-bath single-family listed at $10k.
Deal economics
- At list price, monthly cash flow is $1k ($17k/yr) — positive.
- The deal already cash-flows at list — no discount required.
- Meets the 1% rule at list price ($2k rent vs $10k).
Location & tenants
- Location reads 74/100 on livability (#195 in TX, #4,977 nationally) — a middle-class / working-renter tenant base. Strengths: cost of living A+, housing A+, health & safety A+; Watch: employment C-, amenities F, commute F.
- Baird ISD (rural): math 40% / reading 40% proficiency, ranked #731 of 1,141 in TX (top 64%) — families likely to look elsewhere, expect single-tenant / working-renter base with shorter leases; 63% free/reduced lunch — lower-income household profile, screen leases tightly.
- Zoned schools: Baird El (math 47% / reading 37%, grade F, #1,335 of 4,322 statewide, top 33%, 169 students, 57% FRL); Baird H S (math 42% / reading 47%, grade F, #652 of 1,632 statewide, top 43%, 143 students, 44% FRL).
- Market conditions: 20 active listings in the ZIP; 11 units permitted in Callahan County in 2024 (0 in 5+ unit buildings).
Forward outlook
- In year one you build about $843 of equity ($69 loan paydown + $774 appreciation (7.7% local appreciation)).
- Callahan County population projected to shrink 5% by 2050 — rents likely to lag national; underwrite the cash flow, not the appreciation.
- At projected returns (7.7% appreciation + 3.0% rent growth), your $3k cash investment doubles in ~1 year — after that, you're playing with house money.
Negotiation context
- Only 1 days on market — expect competitive offers; lowballing is unlikely to land.
- 3 sale attempts since 6y ago with the ask held roughly flat each time — persistent listings suggest the price (not the market) is what's stuck; bring a comps-based counter.
Risks & watch-outs
- Watch-outs: built in 1935 — expect roof / HVAC / electrical / plumbing capex.
- Climate carrying-cost: severe wildfire risk; extreme-heat days projected 7→22/yr by 2055 (HVAC capex compounding) — expect insurance premiums to compound above CPI over the hold.
Questions for the listing agent
- Built in 1935 — when were the roof, HVAC, electrical panel, plumbing, and water heater last replaced?
- Is there a deadline driving the sale (1031 exchange, divorce, estate, relocation)? That informs how much negotiation room exists.
- What's the average days-on-market for RENTAL listings here right now (not sales)? A rising rental-DOM trend means longer vacancies and softer asking-rent achievability than the comps imply.
- What's the recent tenant-quality profile in this submarket — average credit score on applications, eviction rate, late-payment / NSF rate, and stable-employment percentage? A property-management company in the area should have these aggregated.
- How much new for-sale + rental construction is in the pipeline within 1–3 miles? Heavy new supply typically softens prices + rents 12–24 months out; constrained supply supports both.
Investment metrics
- 1% rule
- 19.24% ✓
- Cap rate
- 179.52%
- Cash-on-cash
- 618.66%
- DSCR
- 28.53
- GRM
- 0.4
CMA / ARV
- ARV (on-the-fly)
- $43,608
- Comps found
- 1
Show comp detail 1 sale within ~0.75 mi
| Address | Dist | Beds/Ba | Sqft | Sold | Price | $/sf | Match |
|---|---|---|---|---|---|---|---|
| 1216 W 4th St | 0.56mi | 1/2.0 | 1,739 (-8%) | 14mo | $40,000 | $23 | 45 |
Match score weights: distance 35% · size 25% · config 20% · recency 20%. Top-matched comps best support the ARV.
Projected returns pro-forma
7.74% appreciation · 3.0% rent growth · sell at horizon
- IRR
- —
- Equity multiple
- 35.26×
- Total profit
- $95,928
- Equity at exit
- $7,421
- IRR
- —
- Equity multiple
- 76.03×
- Total profit
- $210,083
- Equity at exit
- $14,567
Cash invested: $2,800 (down + closing). Projections, not guarantees.
Landlord ↔ Tenant lean methodology
- Overall (STATE)
- 87 Strongly Landlord-Friendly
- State Texas
- 87 Strongly Landlord-Friendly · R+5
- County
- — inherits STATE
- City
- — inherits STATE
ZIP-level market 79504
- Home prices YoY
- 5.0%
- Active inventory
- 20
- Price-to-rent
- 0.4×
Monthly cashflow live
- Estimated rent
- $1,924 medium interval (Pro) →
- Mortgage (P&I)
- −$52
- Tax from tax record
- −$20 /mo · $239/yr
- Insurance
- −$4
- HOA
- −$0
- Vacancy / Maint / Mgmt
- −$404
- Net cashflow
- $1,444
Break-even live
Sensitivity live
| Price | -10% $1,449 | -5% $1,446 | +0% $1,444 | +5% $1,441 | +10% $1,438 |
|---|---|---|---|---|---|
| Rent | -10% $1,292 | -5% $1,368 | +0% $1,444 | +5% $1,520 | +10% $1,596 |
| Rate | -1.0pp $1,449 | -0.5pp $1,446 | base $1,444 | +0.5pp $1,441 | +1.0pp $1,438 |
UW: 25.0% down · 7.5% · 30yr · 1.5% tax · 5.0% vac · 8.0% maint · 8.0% mgmt
Financing live
Cash to close
- Down payment
- $2,500
- Closing costs
- $300
- Reserves months
- —
- Total cash needed
- —
Loan-product check · same deal, 3 products live
Conventional
25% down · 7.5% · 30yr
- Down + closing
- —
- Monthly P&I
- —
- Monthly cashflow
- —
- DSCR
- —
- Eligible?
- —
Personal DTI + credit; lowest rate.
DSCR
20% down · 8.5% · 30yr
- Down + closing
- —
- Monthly P&I
- —
- Monthly cashflow
- —
- DSCR
- —
- Eligible?
- —
No personal income docs; deal must DSCR.
Hard money
10% down · 12.0% · 12mo
- Down + closing
- —
- Monthly P&I
- —
- Monthly cashflow
- —
- DSCR
- —
- Eligible?
- —
Short-term bridge; refi at stabilization.
Listing history 8 events
-
2026-05-26$10,000 Active
-
2023-08-04historical
-
2023-07-31price $12,000
-
2023-07-25$20,000 Active
-
2020-07-01soldstatus
-
2020-06-30soldstatus Sold 489-char remark
Show marketing remark (489 chars)
Investors special or a great fixer upper. Unbeatable price! Home on 2 lots with 2 kitchens, 2 bathrooms and 2 bedrooms, faux fireplace in living room, large room for office or area to expand for an additional dining room or larger kitchen. Wood floors under some of the carpet. Great covered front porch, large yard, pomegranate tree and lots of shade trees to help keep the house cool in the summer. Bring your ideas and make this your home. Buyer and Buyer agent to verify measurements.
-
2020-06-19status Pending 489-char remark
Show marketing remark (489 chars)
Investors special or a great fixer upper. Unbeatable price! Home on 2 lots with 2 kitchens, 2 bathrooms and 2 bedrooms, faux fireplace in living room, large room for office or area to expand for an additional dining room or larger kitchen. Wood floors under some of the carpet. Great covered front porch, large yard, pomegranate tree and lots of shade trees to help keep the house cool in the summer. Bring your ideas and make this your home. Buyer and Buyer agent to verify measurements.
-
2020-06-16$9,999 Active 489-char remark
Show marketing remark (489 chars)
Investors special or a great fixer upper. Unbeatable price! Home on 2 lots with 2 kitchens, 2 bathrooms and 2 bedrooms, faux fireplace in living room, large room for office or area to expand for an additional dining room or larger kitchen. Wood floors under some of the carpet. Great covered front porch, large yard, pomegranate tree and lots of shade trees to help keep the house cool in the summer. Bring your ideas and make this your home. Buyer and Buyer agent to verify measurements.
ⓘ Source: listings_history table (triggers on properties + properties_extension) + one-shot
backfill from property_details.listing_events for pre-trigger history.
Tax reassessment forecast TX · Resets to sale price
- Current annual tax
- $239 · $20/mo
- Projected year-2 tax
- $239 · $20/mo
- Expected delta
- $0/yr ($0/mo · 0.0%)
ⓘ Screening estimate from a state-policy table — verify with the county assessor before closing.
Climate risk First Street
- Flood 1/10 Low FEMA zone X · 0% chance over 30 yrs
- Wildfire 8/10 Severe
- Heat 6/10 Major 7 d/yr ≥104°F today · 22 d/yr by 30 yrs out
- Wind 4/10 Moderate 14% chance of damaging wind over 30 yrs
- Air quality 1/10 Low 0 unhealthy d/yr today · 0 by 30 yrs out
Nearby sold comps map
Loading sold comps map…
Walkable amenities ~0.75 mi
Loading nearby amenities…
Taxation est. · year 1
- Rental income
- $23,089
- − Mortgage interest
- −$560
- − Property taxes
- −$239
- − Insurance
- −$50
- − Repairs & maintenance
- −$1,847
- − Management
- −$1,847
- − Depreciation
- −$291
- Taxable income
- $18,255
- Est. tax owed @ 24.0%
- −$4,381
- After-tax cash flow
- $12,941/yr
For passive investors: Depreciation is non-cash, so a rental often shows a tax loss while cash-flowing — sheltering income. Rental losses are passive: they offset passive income freely, and up to $25,000/yr can offset ordinary (W-2) income if you actively participate and your MAGI is under $100k (phasing out to $0 by $150k); unused losses carry forward. On sale, claimed depreciation is recaptured at up to 25%, and gains may owe capital-gains tax (a 1031 exchange can defer both). Figures are a year-1 estimate at your 24.0% rate — not tax advice; consult a CPA.
Schools (NCES district)
- District
- Baird ISD
- NCES district ID
- 4809280
- Math proficiency
- 40% ▲ 10.00%
- Reading proficiency
- 40% ▲ 5.00%
- Median HH income
- $43,351
- Composite
- 36.29/100
- National rank
- #9407
- State rank
- #731 of 1141 in TX
Livability — Baird
- Score
- 74/100
- State rank
- #195
- US rank
- #4977
Category grades
Schools grade is shown separately in the Schools card above.
Census & demographics
- Census place
- Baird, TX
- Population (ZIP)
- 2,995
Population outlook (Callahan County) Hauer SSP2
- Today (2025)
- 13,664 people
- By 2030
- 13,578 · -0.6%
- By 2040
- 13,283 · -2.8%
- By 2050
- 13,008 · -4.8%
- By 2075
- 12,354 · -9.6%
- By 2100
- 11,326 · -17.1%
Race, ethnicity, and origin ACS 2023
- Neighborhood character
- Predominantly White (84%)
- Race & ethnicity
- White 84% Hispanic / Latino 11% Two or more races 7% Black 2%
- Hispanic origin (detail)
- Mexican 10%
- Common ancestry
- Italian 16% Slovak 2% Iranian 1%
- Foreign-born
- 1% · Canada
- Languages at home
- 94% English-only · Spanish 6%
Political lean MEDSL · Callahan
- 2024 margin
- Solid R (+77.6) · D 10.9% · R 88.5%
- 2008→2024 swing
- -15.9pp toward R · 2008: -61.7pp · 2024: -77.6pp
- All cycles
- 2024: R+77.6 2020: R+77.3 2016: R+77.2 2012: R+69.8 2008: R+61.7
Not yet ingested
- Civics
- —
Market trends
- HPI YoY
- ▲ 7.74%
- Current HPI
- 161.9583
- Rent YoY
- —
- Metro
- —
- State GDP YoY
- ▲ 3.95%
- F500 in state
- 110
Industry mix (Fortune 500 HQ in TX)
| Industry | F500 HQs | Revenue |
|---|---|---|
| Energy | 16 | $1,198B |
|
||
| Technology | 5 | $198B |
|
||
| Engineering / Construction | 4 | $72B |
|
||
| Energy Services | 3 | $60B |
|
||
| Utilities | 3 | $41B |
|
||
| Healthcare | 2 | $330B |
|
||
Price history
+0.0% since first listed8 events — show timeline
- 2026-05-26 Listed $10,000 FSBO.com
- 2023-08-04 Listing Removed — NTREIS
- 2023-07-31 Price Changed $12,000 NTREIS
- 2023-07-25 Listed $20,000 NTREIS
- 2020-07-01 Sold (Public Records) — Public Records
- 2020-06-30 Sold (MLS) — NTREIS
- 2020-06-19 Pending — NTREIS
- 2020-06-16 Listed $9,999 NTREIS
Property tax history
-3.0%/yrLatest (2025): $239 · -2.3% YoY. Source: county tax records.
Cash-flow waterfall
monthlySold comps — $/sqft
last 12 mo · ≤1 miLoading sold comps…