1815 Sweetwater #1 · La Presa, CA
Flood risk 1/10 · Minimal
- FEMA flood zone
- X (unshaded)
- Chance of flooding over 30 yrs
- 0.0%
- Est. flood insurance / yr
- $507 – $1,088
Fire risk 4/10 · Minor
- Est. fire insurance / yr
- $659 – $1,223
Heat risk 4/10 · Minor
- Hot days now (above 93°F)
- 5 days/yr
- Hot days in 30 yrs
- 13 days/yr
Wind risk 1/10 · Minimal
- Chance of severe wind over 30 yrs
- —
Air-quality risk 3/10 · Minor
- Unhealthy air days now
- 3 days/yr
- Unhealthy air days in 30 yrs
- 3 days/yr
Risk factors via First Street. Map © Google.
Why this score? — see what drove the B grade
The composite is a weighted blend of 9 inputs, each scored 0–100. Each bar is that input's sub-score; the figure is the points it added to the 100-point composite (weight × sub-score).
- Cash flow +30.0/30.0
- ARV discount +11.8/15.0
- 1% rule +10.0/10.0
- DSCR +10.0/10.0
- Schools +4.4/10.0
- Livability +3.0/5.0
- Condition / age +2.8/5.0
- Rent growth +2.7/5.0
- Appreciation +0.0/10.0
$179,000
🖨 Deal sheet 📄 Offer letter ✓ Due diligence
Listing remarks
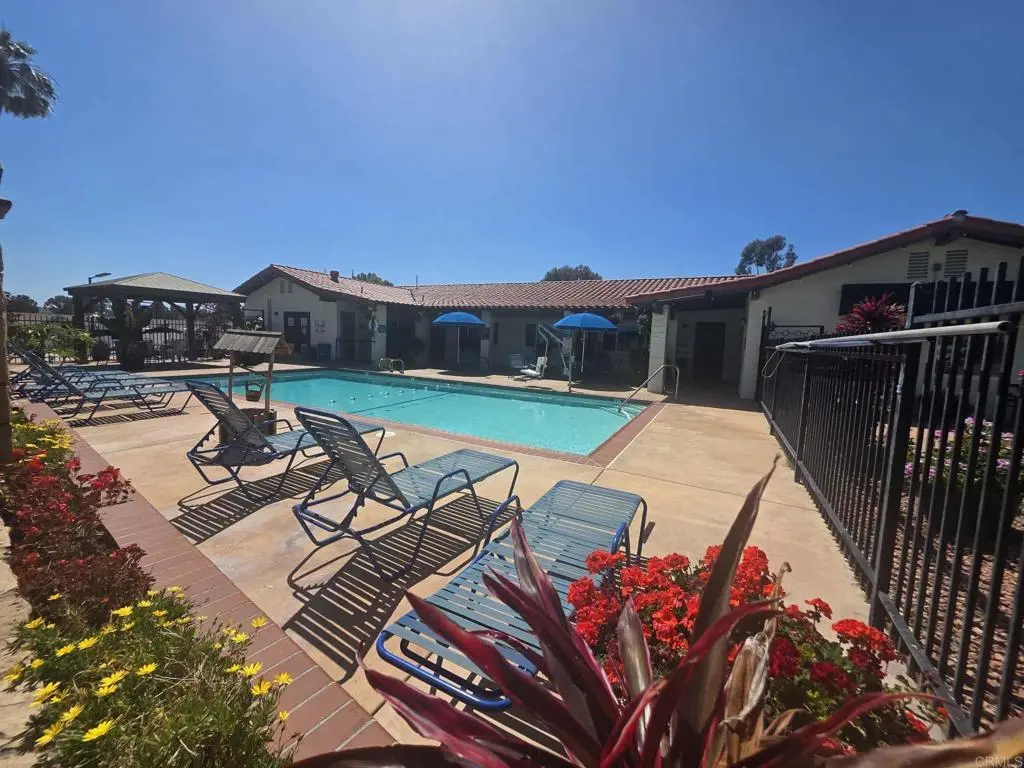
Agents GO SHOW!!! Nestled in one of the area’s most beautifully maintained 55+ communities, this charming home offers the perfect blend of comfort, space & easy living nestled in the foothills of the valley. Affordable space rent just one of the many plusses!!! From the moment you arrive, you’ll feel the well-kept surroundings and amenities and community activities that make Terrace Estates so special. Inside you’ll find a thoughtfully designed floor plan featuring a spacious primary suite, generously sized secondary bedroom & two full bathrooms, walk in shower included, so ideal for both everyday living and hosting guests! The open, airy layout creates a warm
Key facts
- Oversized porch
- Low maintenance yard
- Community amenities
Tags
Property features AI
Finance
- Other: Pets allowed
- Financial info: Land lease of $950 monthly
- HOA & community: Senior community; Park name: Terrace Estates; Community features include curbs, street lighting, sidewalks, mountainous/foothill setting, suburban character
Exterior
- Parking: 2 parking spaces; 2 carport spaces; Park amenities and pool within walking distance
- Utilities: Has view
- Home design: Faces east; Single-story; Mobile home remains (30 ft x 40 ft)
- Construction: Year built per assessor; Estimated living area
- Exterior features: Covered front porch; Patio; Community pool; Yard; Corner lot; Level/flat lot; Close to clubhouse; Near public transit; Street frontage
Interior
- Kitchen: Kitchen included
- Bedrooms: Primary bedroom on main floor; All bedrooms located on the same level
- Bathrooms: 2 full bathrooms
- Heating & cooling: Wall/window cooling
- Interior features: One-level home; Entry is up 3 stairs; Main floor primary bedroom; Primary suite; All bedrooms on ground level; Utility room
- Laundry & utility: Laundry room (individual room)
Neighborhood map
What this means for you Summary
Snapshot
- This is a 2-bed/2.0-bath manufactured listed at $179k. Condition is rated average.
Deal economics
- At list price, monthly cash flow is $964 ($12k/yr) — positive.
- The deal already cash-flows at list — no discount required.
- Meets the 1% rule at list price ($3k rent vs $179k).
- Recommended offer: $168k (6.0% below list) — sets the bar for market timing.
- Cap rate 12.8% vs local median 3.0% in La Presa — top-decile yield for the area; either an underpriced asset or a hidden risk that comps aren't pricing in. Stress-test before assuming the spread holds.
Location & tenants
- Location reads 60/100 on livability (#571 in CA) — a middle-class / working-renter tenant base. Strengths: commute A+, employment B, housing B; Watch: schools D+, health & safety D, crime F.
- La Mesa-Spring Valley (suburban): math 41% / reading 53% proficiency, ranked #478 of 1,400 in CA (top 34%) — families likely to look elsewhere, expect single-tenant / working-renter base with shorter leases.
- Market conditions: Rents flat; 158 active listings in the ZIP; 28 comparable units currently listed for rent nearby; rentals leasing fast (median 2d on market — plan ~1-2 weeks tenant-placement turnaround); solid renter incomes; 11,759 units permitted in San Diego County in 2024 (7,244 in 5+ unit buildings).
- This rent runs 34% of the median local income ($100k/yr) — at the standard rent-burdened threshold; future hikes will face affordability resistance.
Forward outlook
- Local home prices are declining (-3.0%/yr); year-one equity from $1k of loan paydown is wiped out by about $5k of value loss. Plan a longer hold.
- San Diego County population projected at +20% by 2050 — long-run rental-demand tailwind backs the buy-and-hold thesis.
- At projected returns (-3.0% appreciation + 0.9% rent growth), your $50k cash investment doubles in ~6 years — after that, you're playing with house money.
Negotiation context
- It's been on market 72 days — a 6% lower offer ($168k) is reasonable based on typical stale-listing flexibility.
Questions for the listing agent
- It's been on market 72 days. Have you received any prior offers? Is the seller open to a 6% concession, seller financing, or rate buy-down credit?
- Built in 1979 — when were the roof, HVAC, electrical panel, plumbing, and water heater last replaced?
- Why hasn't it sold? Are there any deal-killer items the seller is aware of (foundation, flood, title, zoning, code violations)?
- Is there a deadline driving the sale (1031 exchange, divorce, estate, relocation)? That informs how much negotiation room exists.
- Schools are D-rated, which usually means shorter tenancies and higher turnover. Who's the typical renter profile here, and what's been the actual vacancy rate?
- Crime grade is F in this area — have there been break-ins, vandalism, or insurance claims at this property in the last 3 years? What carrier currently insures it and at what premium?
- What's the average days-on-market for RENTAL listings here right now (not sales)? A rising rental-DOM trend means longer vacancies and softer asking-rent achievability than the comps imply.
- What's the recent tenant-quality profile in this submarket — average credit score on applications, eviction rate, late-payment / NSF rate, and stable-employment percentage? A property-management company in the area should have these aggregated.
- How much new for-sale + rental construction is in the pipeline within 1–3 miles? Heavy new supply typically softens prices + rents 12–24 months out; constrained supply supports both.
Investment metrics
- 1% rule
- 1.56% ✓
- Cap rate
- 12.76%
- Cash-on-cash
- 23.09%
- DSCR
- 2.03
- GRM
- 5.4
CMA / ARV
- ARV (on-the-fly)
- $198,000
- Comps found
- 8
Show comp detail 8 sales within ~0.75 mi
| Address | Dist | Beds/Ba | Sqft | Sold | Price | $/sf | Match |
|---|---|---|---|---|---|---|---|
| 1815 Sweetwater Rd #169 | 0.07mi | 2/2.0 | 1,058 (-12%) | 0mo | $210,000 | $198 | 77 |
| 1815 Sweetwater Rd #28 | 0.07mi | 2/2.0 | 1,222 (+2%) | 21mo | $185,000 | $151 | 76 |
| 1815 Sweetwater Rd #167 | 0.07mi | 2/2.0 | 1,122 (-6%) | 19mo | $185,000 | $165 | 70 |
| 1815 Sweetwater Rd #155 | 0.07mi | 3/2.0 (+1) | 1,050 (-12%) | 4mo | $269,000 | $256 | 68 |
| 1815 Sweetwater Rd #22 | 0.10mi | 3/2.0 (+1) | 1,344 (+12%) | 8mo | $275,000 | $205 | 63 |
| 2515 Sweetwater Rd Spc 23 | 0.66mi | 3/2.0 (+1) | 1,248 (+4%) | 1mo | $185,000 | $148 | 57 |
| 1815 Sweet Water #135 | 0.10mi | 2/1.0 | 1,041 (-13%) | 18mo | $120,000 | $115 | 54 |
| 2515 Sweetwater Rd #81 | 0.66mi | 2/2.0 | 1,022 (-15%) | 14mo | $160,000 | $157 | 32 |
Match score weights: distance 35% · size 25% · config 20% · recency 20%. Top-matched comps best support the ARV.
Projected returns pro-forma
-3.0% appreciation · 0.88% rent growth · sell at horizon
- IRR
- 13.7%
- Equity multiple
- 1.53×
- Total profit
- $26,632
- Equity at exit
- $26,689
- IRR
- 20.8%
- Equity multiple
- 2.59×
- Total profit
- $79,553
- Equity at exit
- $15,477
Cash invested: $50,120 (down + closing). Projections, not guarantees.
Landlord ↔ Tenant lean methodology
- Overall (STATE)
- 18 Strongly Tenant-Friendly
- State California
- 18 Strongly Tenant-Friendly · D+13
- County
- — inherits STATE
- City
- — inherits STATE
ZIP-level market 91977
- Rents YoY
- 0.9%
- Active inventory
- 158
- Price-to-rent
- 5.4×
Monthly cashflow live
- Estimated rent
- $2,786 high interval (Pro) →
- Mortgage (P&I)
- −$939
- Tax est. 1.5%
- −$224 /mo · $2,685/yr
- Insurance
- −$75
- HOA
- −$0
- Vacancy / Maint / Mgmt
- −$585
- Net cashflow
- $964
Break-even live
UW: 25.0% down · 7.5% · 30yr · 1.5% tax · 5.0% vac · 8.0% maint · 8.0% mgmt
Financing live
Cash to close
- Down payment
- $44,750
- Closing costs
- $5,370
- Reserves months
- —
- Total cash needed
- —
Loan-product check · same deal, 3 products live
Conventional
25% down · 7.5% · 30yr
- Down + closing
- —
- Monthly P&I
- —
- Monthly cashflow
- —
- DSCR
- —
- Eligible?
- —
Personal DTI + credit; lowest rate.
DSCR
20% down · 8.5% · 30yr
- Down + closing
- —
- Monthly P&I
- —
- Monthly cashflow
- —
- DSCR
- —
- Eligible?
- —
No personal income docs; deal must DSCR.
Hard money
10% down · 12.0% · 12mo
- Down + closing
- —
- Monthly P&I
- —
- Monthly cashflow
- —
- DSCR
- —
- Eligible?
- —
Short-term bridge; refi at stabilization.
Rent comps 28 comps
| Address | Beds | Baths | Sqft | Rent | $/sqft | DOM | Units | Dist |
|---|---|---|---|---|---|---|---|---|
| 1392 Helix St Unit Helix 1394 Spring Valley, CA | 2.0 | 1.0 | 900 | $2,095 | $2.33 | 10d | 1 | 0.35mi |
| 1624 Canyon Rd Spring Valley, CA | 2.0 | 1.0 | 800 | $2,355 | $2.94 | 1d | 4 | 0.51mi |
| 9211 Amys St Spring Valley, CA | 2.0 | 2.0 | 805 | $1,745 | $2.17 | 1d | 1 | 0.70mi |
| 8926 Delrose Ave Spring Valley, CA | 2.0 | 1.5 | 739 | $1,895 | $2.56 | 1d | 1 | 0.73mi |
| 8926 Delrose Ave Unit 8914-24 Spring Valley, CA | 2.0 | 1.5 | 739 | $1,895 | $2.56 | 1d | 1 | 0.73mi |
| 1071 Osage Dr Spring Valley, CA | 3.0 | 1.5 | 1054 | $3,495 | $3.32 | 1d | 1 | 0.75mi |
| 8836 Valencia St Spring Valley, CA | 2.0 | 1.0 | 832 | $3,500 | $4.21 | 1d | 1 | 0.88mi |
| 937 Felicita Ave Spring Valley, CA | 3.0 | 2.0 | 1400 | $3,800 | $2.71 | 16d | 1 | 0.89mi |
| 1916 Skyline Dr Lemon Grove, CA | 2.0 | 1.0 | 750 | $2,400 | $3.20 | 1d | 1 | 0.91mi |
| 911 Concepcion Ave Spring Valley, CA | 3.0 | 2.5 | 1250 | $3,300 | $2.64 | 11d | 1 | 0.96mi |
| 2705 Dennis Ln Lemon Grove, CA | 3.0 | 2.0 | 1221 | $4,400 | $3.60 | 1d | 1 | 0.99mi |
| 2369 Ravenwood Dr Lemon Grove, CA | 3.0 | 2.5 | 1461 | $3,950 | $2.70 | 2d | 1 | 1.06mi |
| 8953 Lamar St #8951 Spring Valley, CA | 3.0 | 2.0 | 1200 | $3,500 | $2.92 | 1d | 1 | 1.06mi |
| 840 Grand Ave Unit 4 Spring Valley, CA | 2.0 | 1.0 | 875 | $1,950 | $2.23 | 1d | 1 | 1.09mi |
| 8881 Lamar St Unit 02 Spring Valley, CA | 3.0 | 2.0 | 1200 | $2,995 | $2.50 | 22d | 1 | 1.09mi |
| 8881 Lamar St Apt 3 Spring Valley, CA | 3.0 | 2.0 | 1200 | $2,995 | $2.50 | 1d | 1 | 1.09mi |
| 8881 Lamar St Apt 7 Spring Valley, CA | 3.0 | 2.0 | 1200 | $2,995 | $2.50 | 10d | 1 | 1.09mi |
| 8145 Dodie St #47 San Diego, CA | 2.0 | 1.0 | 700 | $2,400 | $3.43 | 24d | 1 | 1.10mi |
| 832 Grand Ave Unit 832-D Spring Valley, CA | 2.0 | 1.0 | 860 | $1,975 | $2.30 | 1d | 1 | 1.10mi |
| 9144 Rosedale Dr Spring Valley, CA | 3.0 | 2.0 | 1205 | $3,300 | $2.74 | 22d | 1 | 1.10mi |
| 8075 Palm St Lemon Grove, CA | 2.0 | 1.0 | 900 | $2,750 | $3.06 | 10d | 1 | 1.12mi |
| 567 Encinitas Ave San Diego, CA | 2.0 | 1.0 | 816 | $2,800 | $3.43 | 24d | 1 | 1.12mi |
| 8619 Sandy Bev Ln Lemon Grove, CA | 2.0 | 1.0 | 812 | $2,795 | $3.44 | 1d | 1 | 1.15mi |
| 8355 Golden Ave Lemon Grove, CA | 2.0 | 2.0 | 1037 | $2,999 | $2.89 | 1d | 1 | 1.26mi |
| 3038 Washington St Lemon Grove, CA | 2.0 | 1.0 | 700 | $2,700 | $3.86 | 1d | 1 | 1.28mi |
| 1225 Capistrano Ave Unit B Spring Valley, CA | 1.0 | 1.0 | 900 | $1,900 | $2.11 | 22d | 1 | 1.34mi |
| 3375 Par Dr La Mesa, CA | 2.0 | 2.0 | 1229 | $4,200 | $3.42 | 1d | 1 | 1.41mi |
| 3405 Fairway Dr La Mesa, CA | 3.0 | 2.0 | 1204 | $3,950 | $3.28 | 1d | 1 | 1.47mi |
Listing history 15 events
-
2026-06-18days on market $179,000 Active 72 DOM
-
2026-06-17days on market $179,000 Active 71 DOM
-
2026-06-16days on market $179,000 Active 70 DOM
-
2026-06-15days on market $179,000 Active 69 DOM
-
2026-06-13days on market $179,000 Active 67 DOM
-
2026-06-09days on market $179,000 Active 63 DOM
-
2026-06-08days on market $179,000 Active 62 DOM
-
2026-06-07days on market $179,000 Active 61 DOM
-
2026-06-04days on market $179,000 Active 58 DOM
-
2026-06-03days on market $179,000 Active 57 DOM
-
2026-06-02days on market $179,000 Active 56 DOM
-
2026-06-01days on market $179,000 Active 55 DOM
-
2026-05-31days on market $179,000 Active 54 DOM
-
2026-05-11price $179,000
-
2026-04-05$199,000 Active
ⓘ Source: listings_history table (triggers on properties + properties_extension) + one-shot
backfill from property_details.listing_events for pre-trigger history.
Climate risk First Street
- Flood 1/10 Low FEMA zone X (unshaded) · 0% chance over 30 yrs
- Wildfire 4/10 Moderate
- Heat 4/10 Moderate 5 d/yr ≥93°F today · 13 d/yr by 30 yrs out
- Wind 1/10 Low
- Air quality 3/10 Moderate 3 unhealthy d/yr today · 3 by 30 yrs out
Nearby sold comps map
Loading sold comps map…
Walkable amenities ~0.75 mi
Loading nearby amenities…
Taxation est. · year 1
- Rental income
- $33,438
- − Mortgage interest
- −$10,027
- − Property taxes
- −$2,685
- − Insurance
- −$895
- − Repairs & maintenance
- −$2,675
- − Management
- −$2,675
- − Depreciation
- −$5,207
- Taxable income
- $9,274
- Est. tax owed @ 24.0%
- −$2,226
- After-tax cash flow
- $9,346/yr
For passive investors: Depreciation is non-cash, so a rental often shows a tax loss while cash-flowing — sheltering income. Rental losses are passive: they offset passive income freely, and up to $25,000/yr can offset ordinary (W-2) income if you actively participate and your MAGI is under $100k (phasing out to $0 by $150k); unused losses carry forward. On sale, claimed depreciation is recaptured at up to 25%, and gains may owe capital-gains tax (a 1031 exchange can defer both). Figures are a year-1 estimate at your 24.0% rate — not tax advice; consult a CPA.
Condition & rehab AI · 12 photos
This charming manufactured home in a well-maintained community offers a good starting point for a cosmetic renovation, with updates that can significantly enhance its resale and rental value.
Repairs flagged
- Minor kitchen cabinets — dated and could be replaced
- Minor bathroom fixtures — dated and could be replaced
- Minor HVAC units — standard units
Value-add opportunities
- Both paint interior walls — enhances curb appeal and interior aesthetics
- Both replace kitchen cabinets — modernizes the space and increases appeal
- Both replace bathroom fixtures — modernizes the space and increases appeal
Renovation cost estimate screening
| Repair item | Severity | Est. cost |
|---|---|---|
| kitchen cabinets · dated and could be replaced | Minor | $500–3,000 |
| bathroom fixtures · dated and could be replaced | Minor | $500–3,000 |
| HVAC units · standard units | Minor | $500–3,000 |
| Total estimated repair cost · 3 items | $1,500–9,000 |
Value-add ROI direction
- Both paint interior walls — enhances curb appeal and interior aesthetics ↑
- Both replace kitchen cabinets — modernizes the space and increases appeal ↑
- Both replace bathroom fixtures — modernizes the space and increases appeal ↑
ⓘ Cost ranges are severity-bucket heuristics (US national rule-of-thumb). Get contractor quotes + a written scope before underwriting a rehab budget.
Schools (NCES district)
- District
- La Mesa-Spring Valley
- NCES district ID
- 0620250
- Math proficiency
- 41% ▲ 1.00%
- Reading proficiency
- 53% ▬ 0.00%
- Median HH income
- $61,742
- Composite
- 43.53/100
- National rank
- #6442
- State rank
- #478 of 1400 in CA
Livability — La Presa
- Score
- 60/100
- State rank
- #571
- US rank
- #18714
Category grades
Schools grade is shown separately in the Schools card above.
Census & demographics
- Census place
- La Presa, CA
- County
- San Diego County · 3,178,799 people
- City population
- 62,957
- Metro
- San Diego-Chula Vista-Carlsbad, CA
- Population (ZIP)
- 61,064
- Household income
- $99,657
- Rent vs Own
- Severe rent burden
- 2007.0
Population outlook (San Diego County) Hauer SSP2
- Today (2025)
- 3,678,185 people
- By 2030
- 3,856,546 · +4.8%
- By 2040
- 4,171,407 · +13.4%
- By 2050
- 4,421,607 · +20.2%
- By 2075
- 4,831,599 · +31.4%
- By 2100
- 4,832,502 · +31.4%
Race, ethnicity, and origin ACS 2023
- Neighborhood character
- Diverse neighborhood (Simpson 0.68)
- Race & ethnicity
- Hispanic / Latino 46% White 29% Two or more races 19% Black 12% Asian 7% Native American 1%
- Hispanic origin (detail)
- Mexican 43%
- Common ancestry
- Portuguese 2% Lithuanian 1% Italian 1%
- Foreign-born
- 19% · Canada, China, Vietnam
- Languages at home
- 59% English-only · Spanish 32% Tagalog/Filipino 3% Arabic 1%
Political lean MEDSL · San Diego
- 2024 margin
- D (+16.8) · D 56.9% · R 40.1% · Other 2.9%
- 2008→2024 swing
- +6.6pp toward D · 2008: 10.2pp · 2024: 16.8pp
- All cycles
- 2024: D+16.8 2020: D+22.8 2016: D+17.8 2012: D+5.1 2008: D+10.2
Not yet ingested
- Civics
- —
Market trends
- HPI YoY
- ▼ -697.99%
- Current HPI
- 381.66
- Rent YoY
- ▲ 0.88%
- Metro
- San Diego-Chula Vista-Carlsbad, CA
- State GDP YoY
- ▲ 3.21%
- F500 in state
- 116
Industry mix (Fortune 500 HQ in CA)
| Industry | F500 HQs | Revenue |
|---|---|---|
| Technology | 27 | $1,492B |
|
||
| Financial Services | 3 | $174B |
|
||
| Retail | 3 | $44B |
|
||
| Insurance | 3 | $26B |
|
||
| Media / Entertainment | 2 | $115B |
|
||
| Pharmaceuticals / Biotech | 2 | $62B |
|
||
Price history
-10.1% since first listed2 events — show timeline
- 2026-05-11 Price Changed $179,000 CRMLS
- 2026-04-05 Listed $199,000 CRMLS
Cash-flow waterfall
monthlySold comps — $/sqft
last 12 mo · ≤1 miLoading sold comps…