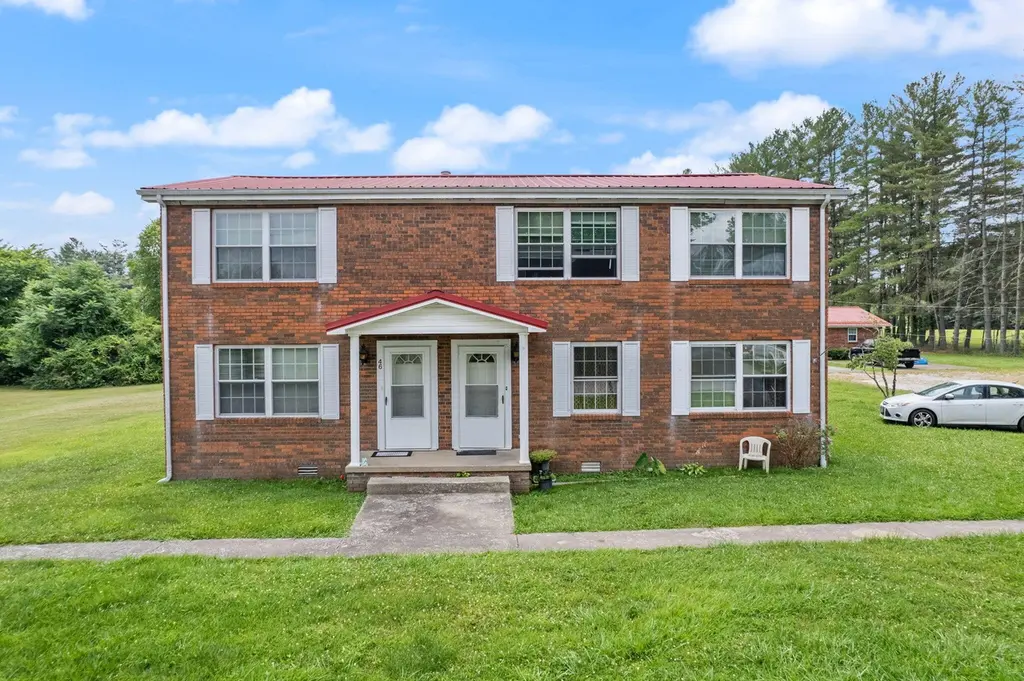
 Fourplex
46, 58, 66 Dantley Dr · Corbin, KY
Flood risk 1/10 · Minimal
- FEMA flood zone
- X (unshaded)
- Chance of flooding over 30 yrs
- 0.0%
- Est. flood insurance / yr
- $507 – $1,088
Fire risk 6/10 · Moderate
- Est. fire insurance / yr
- $839 – $1,559
Heat risk 4/10 · Minor
- Hot days now (above 100°F)
- 7 days/yr
- Hot days in 30 yrs
- 19 days/yr
Wind risk 2/10 · Minimal
- Chance of severe wind over 30 yrs
- 4.0%
Air-quality risk 2/10 · Minimal
- Unhealthy air days now
- 0 days/yr
- Unhealthy air days in 30 yrs
- 1 days/yr
Risk factors via First Street. Map © Google.
Why this score? — see what drove the C+ grade
The composite is a weighted blend of 9 inputs, each scored 0–100. Each bar is that input's sub-score; the figure is the points it added to the 100-point composite (weight × sub-score).
- Cash flow +23.5/30.0
- DSCR +7.6/10.0
- ARV discount +7.5/15.0
- 1% rule +6.1/10.0
- Appreciation +5.9/10.0
- Schools +3.8/10.0
- Livability +3.5/5.0
- Rent growth +2.5/5.0
- Condition / age +2.5/5.0
$510,000
🖨 Deal sheet 📄 Offer letter ✓ Due diligence
Multi-family units
County records classify this as Multi-Family (2-4 Unit). Listing-text estimate: 4 units. confirmed
Listing remarks
Turnkey investment opportunity in Corbin, Kentucky featuring three fully leased duplexes generating a gross monthly rental income of $3,925. This well-maintained portfolio offers a total of 6,298 square feet with 13 bedrooms and 7.5 bathrooms. With 100% occupancy already in place, investors can enjoy immediate cash flow and minimal downtime, making it an ideal addition to any rental portfolio. Conveniently located and steady rental demand, this property presents both consistent income and long-term appreciation potential.
Key facts
- 1.14 acre lot
- Listed 62 days
Property features AI
Exterior
- Utilities: Electricity connected; Natural gas connected; Water connected; Sewer not available
- Home design: Duplex structure; Total building area about 6,298
- Exterior features: Metal roof; Property zoned Other; Lot approximately 1.14 acres
Interior
- Bathrooms: Seven full bathrooms; One half bathroom
- Heating & cooling: Natural gas heating; Electric cooling
- Interior features: Six total units in the building
Neighborhood map
What this means for you Summary
Snapshot
- This is a 4 × 13-bed/?-bath units multifamily listed at $510k.
Deal economics
- At list price, monthly cash flow is $952 ($11k/yr) — positive. Per door: $238/mo.
- The deal already cash-flows at list — no discount required.
- Meets the 1% rule at list price ($6k rent vs $510k).
- Recommended offer: $479k (6.0% below list) — sets the bar for market timing.
- Cap rate 8.5% vs local median 3.3% in Corbin — top-decile yield for the area; either an underpriced asset or a hidden risk that comps aren't pricing in. Stress-test before assuming the spread holds.
Location & tenants
- Location reads 69/100 on livability (#179 in KY) — a middle-class / working-renter tenant base. Strengths: cost of living A+, housing A+, crime A-; Watch: amenities F, commute F, employment F.
- Corbin Independent (town): math 42% / reading 50% proficiency, ranked #20 of 165 in KY (top 12%) — families likely to look elsewhere, expect single-tenant / working-renter base with shorter leases.
- Zoned schools: Corbin Primary (math 42% / reading 32%, grade F, #255 of 676 statewide, top 42%, 769 students, 60% FRL); Corbin Middle School (math 46% / reading 56%, grade C, #20 of 217 statewide, top 10%, 646 students, 58% FRL); Corbin High School (math 22% / reading 42%, grade F, #97 of 254 statewide, top 46%, 829 students, 53% FRL).
- Market conditions: 332 active listings in the ZIP; 65 units permitted in Whitley County in 2024 (0 in 5+ unit buildings).
Forward outlook
- In year one you build about $13k of equity ($4k loan paydown + $9k appreciation (1.8% local appreciation)).
- Whitley County population projected to shrink 8% by 2050 — rents likely to lag national; underwrite the cash flow, not the appreciation.
- At projected returns (1.8% appreciation + 3.0% rent growth), your $143k cash investment doubles in ~6 years — after that, you're playing with house money.
- By year 3, paydown + projected appreciation supports a ~$33k cash-out refi (75% LTV) — recoverable capital for the next deal without selling this one.
Negotiation context
- It's been on market 62 days — a 6% lower offer ($479k) is reasonable based on typical stale-listing flexibility.
Risks & watch-outs
- Climate carrying-cost: major wildfire risk — expect insurance premiums to compound above CPI over the hold.
Questions for the listing agent
- It's been on market 62 days. Have you received any prior offers? Is the seller open to a 6% concession, seller financing, or rate buy-down credit?
- Can we see the unit-by-unit rent roll, current vacancy, and any below-market leases? What's the average tenancy length?
- What capital expenditures (roof, boiler, parking lot, exteriors) have been made in the last 5 years, and what's planned in the next 2?
- Why hasn't it sold? Are there any deal-killer items the seller is aware of (foundation, flood, title, zoning, code violations)?
- Is there a deadline driving the sale (1031 exchange, divorce, estate, relocation)? That informs how much negotiation room exists.
- Schools are B-rated — typically a magnet for longer-tenancy family renters. What's the average tenant stay here, and is there a school-zone premium baked into asking?
- What's the average days-on-market for RENTAL listings here right now (not sales)? A rising rental-DOM trend means longer vacancies and softer asking-rent achievability than the comps imply.
- What's the recent tenant-quality profile in this submarket — average credit score on applications, eviction rate, late-payment / NSF rate, and stable-employment percentage? A property-management company in the area should have these aggregated.
- How much new apartment / multifamily construction is in the pipeline within 1–3 miles? Heavy new supply (>2% of stock underway) typically softens rents 12–24 months out; light construction supports rent growth.
Investment metrics
- 1% rule
- 1.11% ✓
- Cap rate
- 8.53%
- Cash-on-cash
- 8.00%
- DSCR
- 1.36
- GRM
- 7.5
CMA / ARV
No comps found within radius.
Projected returns pro-forma
1.82% appreciation · 3.0% rent growth · sell at horizon
- IRR
- 12.0%
- Equity multiple
- 1.64×
- Total profit
- $91,176
- Equity at exit
- $196,331
- IRR
- 14.9%
- Equity multiple
- 2.96×
- Total profit
- $280,257
- Equity at exit
- $279,058
Cash invested: $142,800 (down + closing). Projections, not guarantees.
Landlord ↔ Tenant lean methodology
- Overall (STATE)
- 83 Strongly Landlord-Friendly
- State Kentucky
- 83 Strongly Landlord-Friendly · R+16
- County
- — inherits STATE
- City
- — inherits STATE
ZIP-level market 40701
- Home prices YoY
- 0.6%
- Active inventory
- 332
- Price-to-rent
- 30.0×
Monthly cashflow live
- Estimated rent
- $5,667 medium interval (Pro) →
- Mortgage (P&I)
- −$2,674
- Tax est. 1.5%
- −$638 /mo · $7,650/yr
- Insurance
- −$212
- HOA
- −$0
- Vacancy / Maint / Mgmt
- −$1,190
- Net cashflow
- $952
Break-even live
4-unit breakdown (identical units grouped — click to expand)
| Units | Beds | Baths | Est. rent |
|---|---|---|---|
| 4× units | 13 | — | $5,668 |
| #1 | 13 | — | $1,417 |
| #2 | 13 | — | $1,417 |
| #3 | 13 | — | $1,417 |
| #4 | 13 | — | $1,417 |
| Total (4 units) | $5,667 | ||
UW: 25.0% down · 7.5% · 30yr · 1.5% tax · 5.0% vac · 8.0% maint · 8.0% mgmt
Financing live
Cash to close
- Down payment
- $127,500
- Closing costs
- $15,300
- Reserves months
- —
- Total cash needed
- —
Loan-product check · same deal, 3 products live
Conventional
25% down · 7.5% · 30yr
- Down + closing
- —
- Monthly P&I
- —
- Monthly cashflow
- —
- DSCR
- —
- Eligible?
- —
Personal DTI + credit; lowest rate.
DSCR
20% down · 8.5% · 30yr
- Down + closing
- —
- Monthly P&I
- —
- Monthly cashflow
- —
- DSCR
- —
- Eligible?
- —
No personal income docs; deal must DSCR.
Hard money
10% down · 12.0% · 12mo
- Down + closing
- —
- Monthly P&I
- —
- Monthly cashflow
- —
- DSCR
- —
- Eligible?
- —
Short-term bridge; refi at stabilization.
Listing history 17 events
-
2026-06-18days on market $510,000 Active 62 DOM
-
2026-06-17days on market $510,000 Active 61 DOM
-
2026-06-16days on market $510,000 Active 60 DOM
-
2026-06-15days on market $510,000 Active 59 DOM
-
2026-06-13days on market $510,000 Active 57 DOM
-
2026-06-12days on market $510,000 Active 56 DOM
-
2026-06-09days on market $510,000 Active 53 DOM
-
2026-06-09price $510,000 Active 52 DOM
-
2026-06-08days on market $520,000 Active 52 DOM
-
2026-06-07days on market $520,000 Active 51 DOM
-
2026-06-04days on market $520,000 Active 47 DOM
-
2026-06-02days on market $520,000 Active 46 DOM
-
2026-06-01days on market $520,000 Active 45 DOM
-
2026-05-31days on market $520,000 Active 44 DOM
-
2026-05-31days on market $520,000 Active 43 DOM
-
2026-04-17$520,000 Active
-
2021-12-10soldstatus $445,000
ⓘ Source: listings_history table (triggers on properties + properties_extension) + one-shot
backfill from property_details.listing_events for pre-trigger history.
Climate risk First Street
- Flood 1/10 Low FEMA zone X (unshaded) · 0% chance over 30 yrs
- Wildfire 6/10 Major
- Heat 4/10 Moderate 7 d/yr ≥100°F today · 19 d/yr by 30 yrs out
- Wind 2/10 Low 4% chance of damaging wind over 30 yrs
- Air quality 2/10 Low 0 unhealthy d/yr today · 1 by 30 yrs out
Nearby sold comps map
Loading sold comps map…
Walkable amenities ~0.75 mi
Loading nearby amenities…
Taxation est. · year 1
- Rental income
- $68,004
- − Mortgage interest
- −$28,568
- − Property taxes
- −$7,650
- − Insurance
- −$2,550
- − Repairs & maintenance
- −$5,440
- − Management
- −$5,440
- − Depreciation
- −$14,836
- Taxable income
- $3,519
- Est. tax owed @ 24.0%
- −$845
- After-tax cash flow
- $10,585/yr
For passive investors: Depreciation is non-cash, so a rental often shows a tax loss while cash-flowing — sheltering income. Rental losses are passive: they offset passive income freely, and up to $25,000/yr can offset ordinary (W-2) income if you actively participate and your MAGI is under $100k (phasing out to $0 by $150k); unused losses carry forward. On sale, claimed depreciation is recaptured at up to 25%, and gains may owe capital-gains tax (a 1031 exchange can defer both). Figures are a year-1 estimate at your 24.0% rate — not tax advice; consult a CPA.
Schools (NCES district)
- District
- Corbin Independent
- NCES district ID
- 2101320
- Math proficiency
- 42% ▼ -19.00%
- Reading proficiency
- 50% ▼ -13.00%
- Median HH income
- $36,928
- Composite
- 38.19/100
- National rank
- #4259
- State rank
- #20 of 165 in KY
Livability — Corbin
- Score
- 69/100
- State rank
- #179
- US rank
- #8891
Category grades
Schools grade is shown separately in the Schools card above.
Census & demographics
- Population (ZIP)
- 29,767
Population outlook (Whitley County) Hauer SSP2
- Today (2025)
- 35,362 people
- By 2030
- 34,807 · -1.6%
- By 2040
- 33,525 · -5.2%
- By 2050
- 32,550 · -8.0%
- By 2075
- 29,555 · -16.4%
- By 2100
- 24,308 · -31.3%
Race, ethnicity, and origin ACS 2023
- Neighborhood character
- Predominantly White (95%)
- Race & ethnicity
- White 95% Two or more races 3% Hispanic / Latino 1%
- Common ancestry
- Serbian 2% Slovak 2% Italian 1%
- Foreign-born
- 1% · Canada
- Languages at home
- 99% English-only · Spanish 1%
Political lean MEDSL · Whitley
- 2024 margin
- Solid R (+69.3) · D 14.8% · R 84.2% · Other 1.0%
- 2008→2024 swing
- -21.7pp toward R · 2008: -47.7pp · 2024: -69.3pp
- All cycles
- 2024: R+69.3 2020: R+65.2 2016: R+67.2 2012: R+57.8 2008: R+47.7
Not yet ingested
- Civics
- —
Market trends
- HPI YoY
- ▲ 1.82%
- Current HPI
- 294.7961
- Rent YoY
- —
- Metro
- —
- State GDP YoY
- ▲ 1.81%
- F500 in state
- 4
Industry mix (Fortune 500 HQ in KY)
| Industry | F500 HQs | Revenue |
|---|---|---|
| Healthcare | 1 | $118B |
|
||
| Food / Beverage | 1 | $7B |
|
||
Price history
+16.9% since first listed2 events — show timeline
- 2026-04-17 Listed $520,000 ImagineMLS
- 2021-12-10 Sold (Public Records) $445,000 Public Records
Property tax history
-5.9%/yrLatest (2024): $872 · -3.8% YoY. Source: county tax records.
Cash-flow waterfall
monthlySold comps — $/sqft
last 12 mo · ≤1 miLoading sold comps…