 Fourplex
699 E Fort St · Farmington, IL
Flood risk 1/10 · Minimal
- FEMA flood zone
- X (unshaded)
- Chance of flooding over 30 yrs
- 0.0%
- Est. flood insurance / yr
- $507 – $1,088
Fire risk 1/10 · Minimal
- Est. fire insurance / yr
- $804 – $1,492
Heat risk 3/10 · Minor
- Hot days now (above 104°F)
- 7 days/yr
- Hot days in 30 yrs
- 18 days/yr
Wind risk 2/10 · Minimal
- Chance of severe wind over 30 yrs
- 1.0%
Air-quality risk 2/10 · Minimal
- Unhealthy air days now
- 1 days/yr
- Unhealthy air days in 30 yrs
- 2 days/yr
Risk factors via First Street. Map © Google.
Why this score? — see what drove the D grade
The composite is a weighted blend of 9 inputs, each scored 0–100. Each bar is that input's sub-score; the figure is the points it added to the 100-point composite (weight × sub-score).
- Cash flow +16.3/30.0
- ARV discount +7.5/15.0
- DSCR +5.0/10.0
- 1% rule +4.4/10.0
- Livability +3.1/5.0
- Rent growth +2.5/5.0
- Schools +2.3/10.0
- Condition / age +2.2/5.0
- Appreciation +0.0/10.0
$399,000
🖨 Deal sheet (PDF) 📄 Offer letter ✓ Due diligence
Multi-family units
County records classify this as Multi-Family (5+ Unit). Listing-text estimate: 4 units. estimate disagrees with records
5+ unit building — per-unit beds/baths from public records are typically unavailable; the breakdown below (if shown) is an estimate from the listing text.
Listing remarks MLS
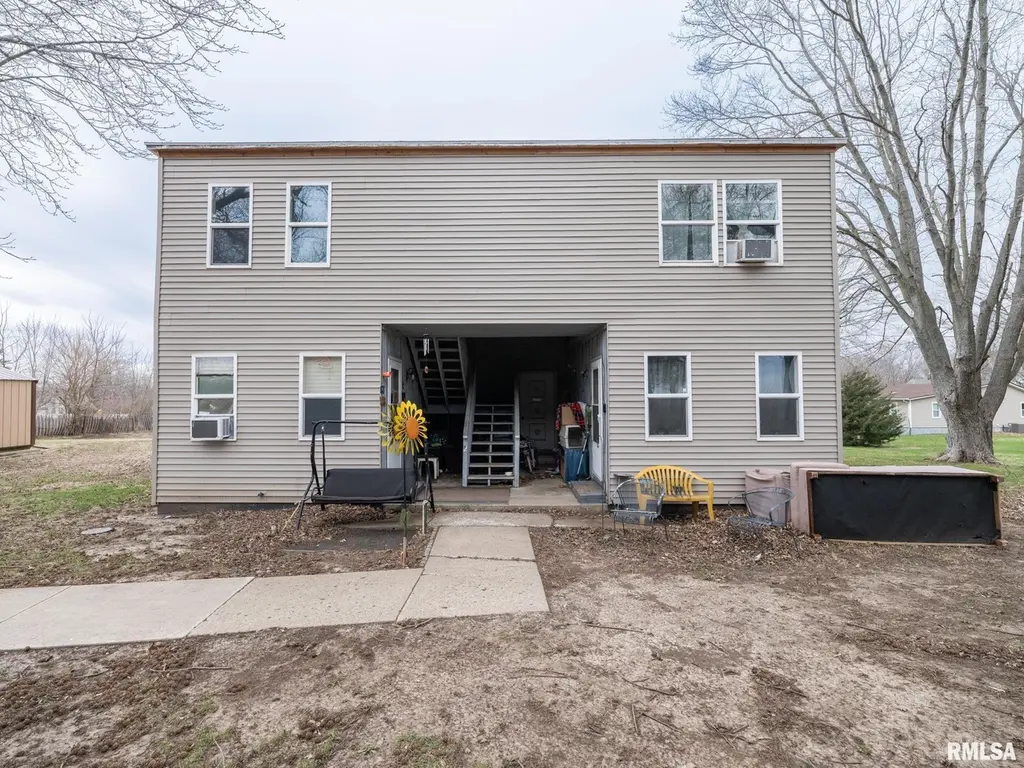
Attention investors and renovators! This multi-family property offers a great value-add opportunity with four units per building. 3 separate buildings situated on spacious lots with a large parking area. The unit mix includes two 2-bedroom units and two 1-bedroom units, providing solid rental potential once improvements are completed. The buildings do require repairs and updates, making this an ideal project for an investor looking to renovate and increase rental income. The generous lot sizes and ample parking add convenience and flexibility for tenants and future improvements. With the right vision and updates, this property has strong potential to become a solid long-term income-producing investment.
Key facts
- Four units
- Spacious lots
- Large parking area
Tags
Neighborhood map
What this means for you Summary
Snapshot
- This is a 4 × 2-bed/2.0-bath units multifamily listed at $399k. Condition is rated fair.
Deal economics
- At list price, monthly cash flow is $217 ($3k/yr) — positive. Per door: $54/mo.
- The deal already cash-flows at list — no discount required.
- To meet the 1% rule (rent ≥ 1% of price), the offer needs to be $376k (5.6% below list).
- Recommended offer: $363k (9.0% below list) — sets the bar for market timing.
Location & tenants
- Location reads 62/100 on livability (#835 in IL) — a middle-class / working-renter tenant base. Strengths: crime A+, cost of living A+, housing B; Watch: amenities F, commute F, employment D-.
- Farmington Central CUSD 265 (rural): math 23% / reading 29% proficiency, ranked #293 of 620 in IL (top 47%) — low school quality limits family demand, transient renter base, plan for 1-2y turnover.
- Zoned schools: Farmington Central Elem Sch (math 25% / reading 23%, grade F, #922 of 2,056 statewide, top 45%, 622 students, 0% FRL); Farmington Central Jr High Sch (math 24% / reading 36%, grade F, #246 of 665 statewide, top 38%, 262 students, 0% FRL); Farmington Central High Sch (math 17% / reading 17%, grade F, #430 of 693 statewide, top 66%, 375 students, 0% FRL) — zoned schools average 0% FRL vs 32% district-wide (32 pts lower); this property's tenant base skews higher-income than the district average.
- Market conditions: 13 active listings in the ZIP; 14 units permitted in Fulton County in 2024 (0 in 5+ unit buildings).
Forward outlook
- Local home prices are declining (-3.0%/yr); year-one equity from $3k of loan paydown is wiped out by about $12k of value loss. Plan a longer hold.
- Fulton County population projected at -20% by 2050 — secular population decline; favor cash flow + early exit over multi-decade hold.
Negotiation context
- It's been on market 98 days — a 9% lower offer ($363k) is reasonable based on typical stale-listing flexibility.
- 2 sale attempts since 2y ago with the ask held roughly flat each time — persistent listings suggest the price (not the market) is what's stuck; bring a comps-based counter.
Questions for the listing agent
- It's been on market 98 days. Have you received any prior offers? Is the seller open to a 9% concession, seller financing, or rate buy-down credit?
- Can we see the unit-by-unit rent roll, current vacancy, and any below-market leases? What's the average tenancy length?
- What capital expenditures (roof, boiler, parking lot, exteriors) have been made in the last 5 years, and what's planned in the next 2?
- Have any recent inspections been done? Can we get a copy of the seller's disclosures and any deferred-maintenance estimates?
- Why hasn't it sold? Are there any deal-killer items the seller is aware of (foundation, flood, title, zoning, code violations)?
- Is there a deadline driving the sale (1031 exchange, divorce, estate, relocation)? That informs how much negotiation room exists.
- Schools are D-rated, which usually means shorter tenancies and higher turnover. Who's the typical renter profile here, and what's been the actual vacancy rate?
- The area grade is low — what's the realistic commute time and amenity access for the typical tenant pool here? Any planned neighborhood developments (good or bad) we should know about?
- What's the average days-on-market for RENTAL listings here right now (not sales)? A rising rental-DOM trend means longer vacancies and softer asking-rent achievability than the comps imply.
- What's the recent tenant-quality profile in this submarket — average credit score on applications, eviction rate, late-payment / NSF rate, and stable-employment percentage? A property-management company in the area should have these aggregated.
- How much new apartment / multifamily construction is in the pipeline within 1–3 miles? Heavy new supply (>2% of stock underway) typically softens rents 12–24 months out; light construction supports rent growth.
Investment metrics
- 1% rule
- 0.94% ✗
- Cap rate
- 6.95%
- Cash-on-cash
- 2.33%
- DSCR
- 1.10
- GRM
- 8.8
CMA / ARV
No comps found within radius.
Projected returns pro-forma
-3.0% appreciation · 3.0% rent growth · sell at horizon
- IRR
- -12.6%
- Equity multiple
- 0.55×
- Total profit
- $-50,781
- Equity at exit
- $59,492
- IRR
- -3.5%
- Equity multiple
- 0.77×
- Total profit
- $-26,196
- Equity at exit
- $34,498
Cash invested: $111,720 (down + closing). Projections, not guarantees.
Landlord ↔ Tenant lean methodology
- Overall (STATE)
- 43 Moderately Tenant-Leaning
- State Illinois
- 43 Moderately Tenant-Leaning · D+7
- County
- — inherits STATE
- City
- — inherits STATE
ZIP-level market 61531
- Active inventory
- 13
- Price-to-rent
- 35.3×
Monthly cashflow live
- Estimated rent
- $3,765 medium interval (Pro) →
- Mortgage (P&I)
- −$2,092
- Tax est. 1.5%
- −$499 /mo · $5,985/yr
- Insurance
- −$166
- HOA
- −$0
- Vacancy / Maint / Mgmt
- −$791
- Net cashflow
- $217
Break-even live
Sensitivity live
| Price | -10% $493 | -5% $355 | +0% $217 | +5% $79 | +10% $-59 |
|---|---|---|---|---|---|
| Rent | -10% $-80 | -5% $68 | +0% $217 | +5% $366 | +10% $514 |
| Rate | -1.0pp $418 | -0.5pp $318 | base $217 | +0.5pp $114 | +1.0pp $8 |
4-unit breakdown (identical units grouped — click to expand)
| Units | Beds | Baths | Est. rent |
|---|---|---|---|
| 4× units | 2 | 2 | $3,764 |
| #1 | 2 | 2 | $941 |
| #2 | 2 | 2 | $941 |
| #3 | 2 | 2 | $941 |
| #4 | 2 | 2 | $941 |
| Total (4 units) | $3,765 | ||
UW: 25.0% down · 7.5% · 30yr · 1.5% tax · 5.0% vac · 8.0% maint · 8.0% mgmt
Financing live
Cash to close
- Down payment
- $99,750
- Closing costs
- $11,970
- Reserves months
- —
- Total cash needed
- —
Loan-product check · same deal, 3 products live
Conventional
25% down · 7.5% · 30yr
- Down + closing
- —
- Monthly P&I
- —
- Monthly cashflow
- —
- DSCR
- —
- Eligible?
- —
Personal DTI + credit; lowest rate.
DSCR
20% down · 8.5% · 30yr
- Down + closing
- —
- Monthly P&I
- —
- Monthly cashflow
- —
- DSCR
- —
- Eligible?
- —
No personal income docs; deal must DSCR.
Hard money
10% down · 12.0% · 12mo
- Down + closing
- —
- Monthly P&I
- —
- Monthly cashflow
- —
- DSCR
- —
- Eligible?
- —
Short-term bridge; refi at stabilization.
Listing history 20 events
-
2026-06-22days on market $399,000 Active 98 DOM
-
2026-06-21days on market $399,000 Active 97 DOM
-
2026-06-21days on market $399,000 Active 96 DOM
-
2026-06-18days on market $399,000 Active 94 DOM
-
2026-06-17days on market $399,000 Active 93 DOM
-
2026-06-16days on market $399,000 Active 92 DOM
-
2026-06-15days on market $399,000 Active 91 DOM
-
2026-06-13days on market $399,000 Active 89 DOM
-
2026-06-12days on market $399,000 Active 88 DOM
-
2026-06-09days on market $399,000 Active 85 DOM
-
2026-06-08days on market $399,000 Active 84 DOM
-
2026-06-07days on market $399,000 Active 83 DOM
-
2026-06-04days on market $399,000 Active 79 DOM
-
2026-06-02days on market $399,000 Active 78 DOM
-
2026-06-01days on market $399,000 Active 77 DOM
-
2026-05-31days on market $399,000 Active 76 DOM
-
2026-05-31days on market $399,000 Active 75 DOM
-
2026-03-16$399,000 Active 712-char remark
Show marketing remark (712 chars)
Attention investors and renovators! This multi-family property offers a great value-add opportunity with four units per building. 3 separate buildings situated on spacious lots with a large parking area. The unit mix includes two 2-bedroom units and two 1-bedroom units, providing solid rental potential once improvements are completed. The buildings do require repairs and updates, making this an ideal project for an investor looking to renovate and increase rental income. The generous lot sizes and ample parking add convenience and flexibility for tenants and future improvements. With the right vision and updates, this property has strong potential to become a solid long-term income-producing investment.
-
2025-02-28historical
-
2024-10-22Active
ⓘ Source: listings_history table (triggers on properties + properties_extension) + one-shot
backfill from property_details.listing_events for pre-trigger history.
Climate risk First Street
- Flood 1/10 Low FEMA zone X (unshaded) · 0% chance over 30 yrs
- Wildfire 1/10 Low
- Heat 3/10 Moderate 7 d/yr ≥104°F today · 18 d/yr by 30 yrs out
- Wind 2/10 Low 100% chance of damaging wind over 30 yrs
- Air quality 2/10 Low 1 unhealthy d/yr today · 2 by 30 yrs out
Nearby sold comps map
Loading sold comps map…
Walkable amenities ~0.75 mi
Loading nearby amenities…
Taxation est. · year 1
- Rental income
- $45,180
- − Mortgage interest
- −$22,350
- − Property taxes
- −$5,985
- − Insurance
- −$1,995
- − Repairs & maintenance
- −$3,614
- − Management
- −$3,614
- − Depreciation
- −$11,607
- Taxable loss
- −$3,986
- Est. tax savings @ 24.0%
- +$957
- After-tax cash flow
- $3,560/yr
For passive investors: Depreciation is non-cash, so a rental often shows a tax loss while cash-flowing — sheltering income. Rental losses are passive: they offset passive income freely, and up to $25,000/yr can offset ordinary (W-2) income if you actively participate and your MAGI is under $100k (phasing out to $0 by $150k); unused losses carry forward. On sale, claimed depreciation is recaptured at up to 25%, and gains may owe capital-gains tax (a 1031 exchange can defer both). Figures are a year-1 estimate at your 24.0% rate — not tax advice; consult a CPA.
Condition & rehab AI · 13 photos
This multi-family property requires significant repairs and updates to its exterior and landscaping, but presents a solid investment opportunity with strong rental potential.
Repairs flagged
- Major roof — Shingles are visibly damaged
- Major exterior siding — Siding is peeling and weathered
- Major landscaping — Sparse and unkempt
- Major fencing — Missing or in poor condition
- Major sidewalks — Uneven and cracked
Value-add opportunities
- Both repair and replace roof — A new roof will improve both appearance and functionality
- Both repair and replace exterior siding — New siding will enhance curb appeal and durability
- Both landscaping and tree trimming — Aesthetic improvements will attract tenants and buyers
- Both repair and replace fencing — A functional and attractive fence will enhance property value
- Both repair and replace sidewalks — Smooth and safe sidewalks will improve accessibility and property value
Renovation cost estimate screening
| Repair item | Severity | Est. cost |
|---|---|---|
| roof · Shingles are visibly damaged | Major | $15,000–50,000 |
| exterior siding · Siding is peeling and weathered | Major | $15,000–50,000 |
| landscaping · Sparse and unkempt | Major | $15,000–50,000 |
| fencing · Missing or in poor condition | Major | $15,000–50,000 |
| sidewalks · Uneven and cracked | Major | $15,000–50,000 |
| Total estimated repair cost · 5 items | $75,000–250,000 |
Value-add ROI direction
- Both repair and replace roof — A new roof will improve both appearance and functionality ↑
- Both repair and replace exterior siding — New siding will enhance curb appeal and durability ↑
- Both landscaping and tree trimming — Aesthetic improvements will attract tenants and buyers ↑
- Both repair and replace fencing — A functional and attractive fence will enhance property value ↑
- Both repair and replace sidewalks — Smooth and safe sidewalks will improve accessibility and property value ↑
ⓘ Cost ranges are severity-bucket heuristics (US national rule-of-thumb). Get contractor quotes + a written scope before underwriting a rehab budget.
Schools (NCES district)
- District
- Farmington Central CUSD 265
- NCES district ID
- 1700044
- Math proficiency
- 23% ▼ -8.00%
- Reading proficiency
- 29% ▼ -11.00%
- Median HH income
- $54,785
- Composite
- 23.33/100
- National rank
- #7914
- State rank
- #293 of 620 in IL
Livability — Farmington
- Score
- 62/100
- State rank
- #835
- US rank
- #16471
Category grades
Schools grade is shown separately in the Schools card above.
Census & demographics
- Census place
- Farmington, IL
- Population (ZIP)
- 3,018
Population outlook (Fulton County) Hauer SSP2
- Today (2025)
- 33,356 people
- By 2030
- 32,144 · -3.6%
- By 2040
- 29,518 · -11.5%
- By 2050
- 26,775 · -19.7%
- By 2075
- 19,972 · -40.1%
- By 2100
- 13,580 · -59.3%
Race, ethnicity, and origin ACS 2023
- Neighborhood character
- Predominantly White (97%)
- Race & ethnicity
- White 97% Two or more races 2%
- Common ancestry
- Iranian 4% Portuguese 3% Slovak 3%
- Foreign-born
- 0%
- Languages at home
- 99% English-only · Spanish 0%
Political lean MEDSL · Fulton
- 2024 margin
- Strong R (+23.8) · D 37.1% · R 60.9% · Other 2.0%
- 2008→2024 swing
- -45.2pp toward R · 2008: 21.3pp · 2024: -23.8pp
- All cycles
- 2024: R+23.8 2020: R+20.1 2016: R+15.1 2012: D+11.1 2008: D+21.3
Not yet ingested
- Civics
- —
Market trends
- HPI YoY
- ▼ -62.69%
- Current HPI
- 116.0611
- Rent YoY
- —
- Metro
- —
- State GDP YoY
- ▲ 1.59%
- F500 in state
- 60
Industry mix (Fortune 500 HQ in IL)
| Industry | F500 HQs | Revenue |
|---|---|---|
| Insurance | 4 | $201B |
|
||
| Consumer Goods | 4 | $87B |
|
||
| Industrial Machinery | 3 | $64B |
|
||
| Healthcare | 2 | $55B |
|
||
| Retail / Pharmacy | 1 | $148B |
|
||
| Agriculture / Food | 1 | $86B |
|
||
Price history
3 events — show timeline
- 2026-03-16 Listed $399,000 RMLSA as Distributed by MLS Grid
- 2025-02-28 Listing Removed — RMLSA as Distributed by MLS Grid
- 2024-10-22 Listed — RMLSA as Distributed by MLS Grid
Cash-flow waterfall
monthlySold comps — $/sqft
last 12 mo · ≤1 miLoading sold comps…