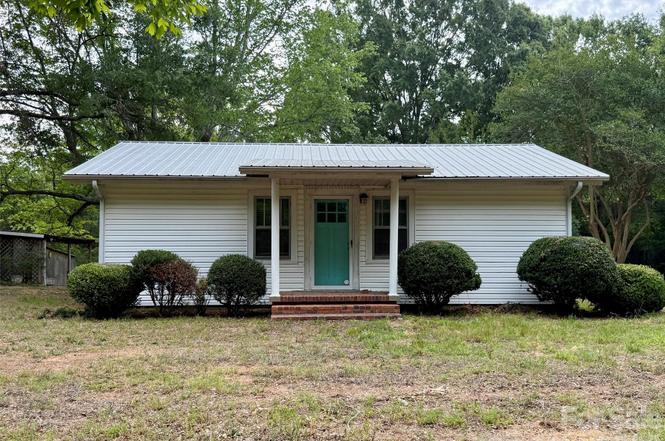
5059 Brown Creek Church Rd · Wadesboro, NC
Flood risk 1/10 · Minimal
- FEMA flood zone
- X (unshaded)
- Chance of flooding over 30 yrs
- 0.0%
- Est. flood insurance / yr
- $507 – $1,088
Fire risk 3/10 · Minor
- Est. fire insurance / yr
- $906 – $1,684
Heat risk 7/10 · Major
- Hot days now (above 108°F)
- 7 days/yr
- Hot days in 30 yrs
- 16 days/yr
Wind risk 6/10 · Moderate
- Chance of severe wind over 30 yrs
- 45.0%
Air-quality risk 2/10 · Minimal
- Unhealthy air days now
- 1 days/yr
- Unhealthy air days in 30 yrs
- 2 days/yr
Risk factors via First Street. Map © Google.
Why this score? — see what drove the B grade
The composite is a weighted blend of 9 inputs, each scored 0–100. Each bar is that input's sub-score; the figure is the points it added to the 100-point composite (weight × sub-score).
- Cash flow +28.6/30.0
- DSCR +10.0/10.0
- Appreciation +10.0/10.0
- ARV discount +7.5/15.0
- 1% rule +6.7/10.0
- Rent growth +2.5/5.0
- Condition / age +2.5/5.0
- Schools +2.1/10.0
- Livability +2.1/5.0
$139,900
🖨 Deal sheet 📄 Offer letter ✓ Due diligence
Listing remarks MLS
Looking for your next investment, rental, or fixer-upper with charm? Welcome to 5059 Brown Creek Church Rd – a 1,150 sq. ft. home with generous room sizes, a flexible floor plan (including a bonus space with its own bath), and land that dreams are built on. This home may not have central heat & air yet, but the value is in the vision: transform it into a long-term rental, a short-term rental close to a popular wedding venue, or create the perfect homestead. Outside, the barn with power offers unlimited potential – studio, workshop, or reimagined event space. The possibilities are endless. Flexible layout and +/- 1.23 acres to grow on are calling you home! If you’ve been waiting for a property where sweat equity meets opportunity – this is it.
Key facts
- Spacious yard
- Covered front porch
- Metal roof
Tags
Property features AI
Finance
- HOA & community: No HOA
Exterior
- Parking: Driveway
- Utilities: County water and well; Septic system
- Home design: Single-family residence; One story; Site-built construction; Residential zoning (RA3/RES)
- Construction: Vinyl exterior; Metal roof; Crawl space foundation; Built on site
- Exterior features: 1.3-acre lot; Gravel and paved road access; Publicly maintained road
Interior
- Kitchen: Gas range; Microwave; Refrigerator
- Bedrooms: Two bedrooms on the main level
- Bathrooms: Two full bathrooms on the main level
- Heating & cooling: Propane heating; Ceiling fans; Window air conditioning units
- Interior features: Seven total rooms; Mud room laundry area
- Laundry & utility: Mud room laundry
Neighborhood map
What this means for you Summary
Snapshot
- This is a 2-bed/2.0-bath single-family listed at $140k.
Deal economics
- At list price, monthly cash flow is $463 ($6k/yr) — positive.
- The deal already cash-flows at list — no discount required.
- Meets the 1% rule at list price ($2k rent vs $140k).
- Cap rate 10.3% vs local median 6.3% in Wadesboro — top-decile yield for the area; either an underpriced asset or a hidden risk that comps aren't pricing in. Stress-test before assuming the spread holds.
Location & tenants
- Location reads 41/100 on livability (#728 in NC) — a working-class tenant base; expect higher turnover. Strengths: cost of living A+; Watch: housing C-, schools F, crime F.
- Anson County Schools (rural): math 20% / reading 32% proficiency, ranked #159 of 178 in NC (top 89%) — low school quality limits family demand, transient renter base, plan for 1-2y turnover; 67% free/reduced lunch — lower-income household profile, screen leases tightly.
- Market conditions: 85 active listings in the ZIP; 55 units permitted in Anson County in 2024 (0 in 5+ unit buildings).
Forward outlook
- In year one you build about $15k of equity ($967 loan paydown + $14k appreciation (10.0% local appreciation)).
- Anson County population projected at -24% by 2050 — secular population decline; favor cash flow + early exit over multi-decade hold.
- At projected returns (10.0% appreciation + 3.0% rent growth), your $39k cash investment doubles in ~2 years — after that, you're playing with house money.
- By year 3, paydown + projected appreciation supports a ~$38k cash-out refi (75% LTV) — recoverable capital for the next deal without selling this one.
Negotiation context
- Only 1 days on market — expect competitive offers; lowballing is unlikely to land.
- 2 sale attempts with the ask held roughly flat each time — persistent listings suggest the price (not the market) is what's stuck; bring a comps-based counter.
- Current owner paid $85k; list at $140k implies a 65% gain — meaningful room to come down on a strong offer.
Risks & watch-outs
- Watch-outs: built in 1947 — expect roof / HVAC / electrical / plumbing capex.
- Climate carrying-cost: major wind risk, 45% chance of damaging wind over 30y; extreme-heat days projected 7→16/yr by 2055 (HVAC capex compounding) — expect insurance premiums to compound above CPI over the hold.
Questions for the listing agent
- Built in 1947 — when were the roof, HVAC, electrical panel, plumbing, and water heater last replaced?
- Is there a deadline driving the sale (1031 exchange, divorce, estate, relocation)? That informs how much negotiation room exists.
- Schools are F-rated, which usually means shorter tenancies and higher turnover. Who's the typical renter profile here, and what's been the actual vacancy rate?
- Crime grade is F in this area — have there been break-ins, vandalism, or insurance claims at this property in the last 3 years? What carrier currently insures it and at what premium?
- What's the average days-on-market for RENTAL listings here right now (not sales)? A rising rental-DOM trend means longer vacancies and softer asking-rent achievability than the comps imply.
- What's the recent tenant-quality profile in this submarket — average credit score on applications, eviction rate, late-payment / NSF rate, and stable-employment percentage? A property-management company in the area should have these aggregated.
- How much new for-sale + rental construction is in the pipeline within 1–3 miles? Heavy new supply typically softens prices + rents 12–24 months out; constrained supply supports both.
Investment metrics
- 1% rule
- 1.17% ✓
- Cap rate
- 10.27%
- Cash-on-cash
- 14.19%
- DSCR
- 1.63
- GRM
- 7.1
CMA / ARV
No comps found within radius.
Projected returns pro-forma
10.0% appreciation · 3.0% rent growth · sell at horizon
- IRR
- 34.7%
- Equity multiple
- 3.70×
- Total profit
- $105,646
- Equity at exit
- $126,033
- IRR
- 29.9%
- Equity multiple
- 8.35×
- Total profit
- $287,785
- Equity at exit
- $271,795
Cash invested: $39,172 (down + closing). Projections, not guarantees.
Landlord ↔ Tenant lean methodology
- Overall (STATE)
- 85 Strongly Landlord-Friendly
- State North Carolina
- 85 Strongly Landlord-Friendly · R+3
- County
- — inherits STATE
- City
- — inherits STATE
ZIP-level market 28170
- Home prices YoY
- 5.8%
- Active inventory
- 85
- Price-to-rent
- 7.1×
Monthly cashflow live
- Estimated rent
- $1,638 medium interval (Pro) →
- Mortgage (P&I)
- −$734
- Tax from tax record
- −$38 /mo · $461/yr
- Insurance
- −$58
- HOA
- −$0
- Vacancy / Maint / Mgmt
- −$344
- Net cashflow
- $463
Break-even live
UW: 25.0% down · 7.5% · 30yr · 1.5% tax · 5.0% vac · 8.0% maint · 8.0% mgmt
Financing live
Cash to close
- Down payment
- $34,975
- Closing costs
- $4,197
- Reserves months
- —
- Total cash needed
- —
Loan-product check · same deal, 3 products live
Conventional
25% down · 7.5% · 30yr
- Down + closing
- —
- Monthly P&I
- —
- Monthly cashflow
- —
- DSCR
- —
- Eligible?
- —
Personal DTI + credit; lowest rate.
DSCR
20% down · 8.5% · 30yr
- Down + closing
- —
- Monthly P&I
- —
- Monthly cashflow
- —
- DSCR
- —
- Eligible?
- —
No personal income docs; deal must DSCR.
Hard money
10% down · 12.0% · 12mo
- Down + closing
- —
- Monthly P&I
- —
- Monthly cashflow
- —
- DSCR
- —
- Eligible?
- —
Short-term bridge; refi at stabilization.
Listing history 2 events
-
2026-06-18remarks 660-char remark
-
2026-06-18$139,900 Active 1 DOM
ⓘ Source: listings_history table (triggers on properties + properties_extension) + one-shot
backfill from property_details.listing_events for pre-trigger history.
Tax reassessment forecast NC · Resets to sale price
- Current annual tax
- $461 · $38/mo
- Projected year-2 tax
- $1,147 · $96/mo
- Expected delta
- +$686/yr (+$57/mo · 148.9%)
ⓘ Screening estimate from a state-policy table — verify with the county assessor before closing.
Climate risk First Street
- Flood 1/10 Low FEMA zone X (unshaded) · 0% chance over 30 yrs
- Wildfire 3/10 Moderate
- Heat 7/10 Severe 7 d/yr ≥108°F today · 16 d/yr by 30 yrs out
- Wind 6/10 Major 45% chance of damaging wind over 30 yrs
- Air quality 2/10 Low 1 unhealthy d/yr today · 2 by 30 yrs out
Nearby sold comps map
Loading sold comps map…
Walkable amenities ~0.75 mi
Loading nearby amenities…
Taxation est. · year 1
- Rental income
- $19,651
- − Mortgage interest
- −$7,837
- − Property taxes
- −$461
- − Insurance
- −$700
- − Repairs & maintenance
- −$1,572
- − Management
- −$1,572
- − Depreciation
- −$4,070
- Taxable income
- $3,440
- Est. tax owed @ 24.0%
- −$826
- After-tax cash flow
- $4,735/yr
For passive investors: Depreciation is non-cash, so a rental often shows a tax loss while cash-flowing — sheltering income. Rental losses are passive: they offset passive income freely, and up to $25,000/yr can offset ordinary (W-2) income if you actively participate and your MAGI is under $100k (phasing out to $0 by $150k); unused losses carry forward. On sale, claimed depreciation is recaptured at up to 25%, and gains may owe capital-gains tax (a 1031 exchange can defer both). Figures are a year-1 estimate at your 24.0% rate — not tax advice; consult a CPA.
Schools (NCES district)
- District
- Anson County Schools
- NCES district ID
- 3700180
- Math proficiency
- 20% ▼ -7.00%
- Reading proficiency
- 32% ▼ -1.00%
- Median HH income
- $34,961
- Composite
- 21.41/100
- National rank
- #8348
- State rank
- #159 of 178 in NC
Livability — Wadesboro
- Score
- 41/100
- State rank
- #728
- US rank
- #27112
Category grades
Schools grade is shown separately in the Schools card above.
Census & demographics
- Population (ZIP)
- 9,595
Population outlook (Anson County) Hauer SSP2
- Today (2025)
- 23,572 people
- By 2030
- 22,384 · -5.0%
- By 2040
- 19,976 · -15.3%
- By 2050
- 17,803 · -24.5%
- By 2075
- 13,839 · -41.3%
- By 2100
- 10,890 · -53.8%
Race, ethnicity, and origin ACS 2023
- Neighborhood character
- Diverse neighborhood (Simpson 0.57)
- Race & ethnicity
- Black 53% White 38% Two or more races 4% Asian 3% Hispanic / Latino 2%
- Common ancestry
- Slovak 1% Russian 1% Serbian 1%
- Foreign-born
- 4% · Canada, South Korea
- Languages at home
- 95% English-only · Spanish 2% Other Asian/Pacific 1% Korean 1%
Political lean MEDSL · Anson
- 2024 margin
- Toss-up / Even · D 48.4% · R 50.9%
- 2008→2024 swing
- -23.5pp toward R · 2008: 20.9pp · 2024: -2.5pp
- All cycles
- 2024: R+2.5 2020: D+4.2 2016: D+12.6 2012: D+25.0 2008: D+20.9
Not yet ingested
- Civics
- —
Market trends
- HPI YoY
- ▲ 12.62%
- Current HPI
- 228.7798
- Rent YoY
- —
- Metro
- —
- State GDP YoY
- ▲ 3.28%
- F500 in state
- 26
Industry mix (Fortune 500 HQ in NC)
| Industry | F500 HQs | Revenue |
|---|---|---|
| Financial Services | 2 | $213B |
|
||
| Retail | 2 | $95B |
|
||
| Industrial Conglomerate | 1 | $38B |
|
||
| Metals / Steel | 1 | $35B |
|
||
| Utilities | 1 | $30B |
|
||
| Industrial Machinery | 1 | $19B |
|
||
Price history
+63.6% since first listed9 events — show timeline
- 2026-06-18 Listed $139,900 CANOPYMLS as Distributed by MLS Grid
- 2025-11-04 Sold (Public Records) $85,000 Public Records
- 2025-11-04 Sold (MLS) $85,000 CANOPYMLS as Distributed by MLS Grid
- 2025-09-20 Contingent — CANOPYMLS as Distributed by MLS Grid
- 2025-09-20 Listed $79,900 CANOPYMLS as Distributed by MLS Grid
- 2025-09-17 Coming Soon $79,900 CANOPYMLS as Distributed by MLS Grid
- 2012-09-05 Sold (Public Records) $60,000 Public Records
- 2010-07-15 Sold (Public Records) $288,000 Public Records
- 2010-04-16 Sold (Public Records) $85,500 Public Records
Property tax history
+1.2%/yrLatest (2025): $461 · +0.0% YoY. Source: county tax records.
Cash-flow waterfall
monthlySold comps — $/sqft
last 12 mo · ≤1 miLoading sold comps…