 🏷️ Likely Rental
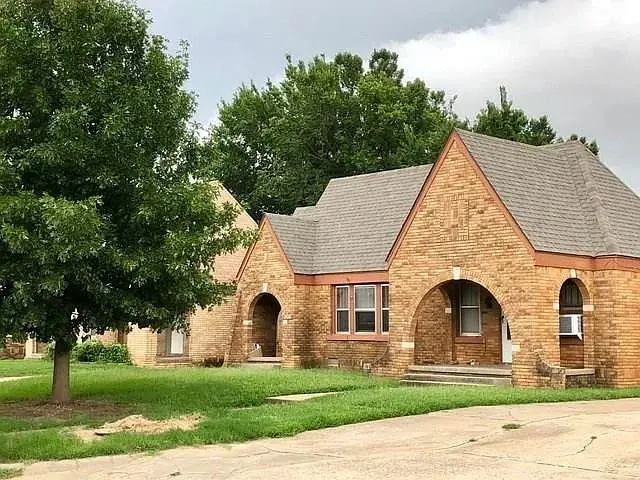
2536 NW 11th St · Oklahoma City, OK
Flood risk 1/10 · Minimal
- FEMA flood zone
- X (unshaded)
- Chance of flooding over 30 yrs
- 0.0%
- Est. flood insurance / yr
- $507 – $1,088
Fire risk 1/10 · Minimal
- Est. fire insurance / yr
- $2,463 – $4,575
Heat risk 6/10 · Moderate
- Hot days now (above 107°F)
- 7 days/yr
- Hot days in 30 yrs
- 19 days/yr
Wind risk 2/10 · Minimal
- Chance of severe wind over 30 yrs
- 3.0%
Air-quality risk 2/10 · Minimal
- Unhealthy air days now
- 1 days/yr
- Unhealthy air days in 30 yrs
- 2 days/yr
Risk factors via First Street. Map © Google.
Why this score? — see what drove the D grade
The composite is a weighted blend of 9 inputs, each scored 0–100. Each bar is that input's sub-score; the figure is the points it added to the 100-point composite (weight × sub-score).
- ARV discount +15.0/15.0
- Cash flow +11.2/30.0
- Rent growth +4.3/5.0
- Livability +4.0/5.0
- DSCR +3.3/10.0
- 1% rule +2.5/10.0
- Condition / age +2.5/5.0
- Schools +0.7/10.0
- Appreciation +0.0/10.0
$209,500
🖨 Deal sheet (PDF) 📄 Offer letter ✓ Due diligence
Listing remarks MLS
One side remodeled. This 100% tenant-occupied duplex offers immediate cash flow with total monthly rents of $1,700. Conveniently located with easy access to major roads, shopping, and employment centers. Turnkey investment—collect rent from day one. Can be sold as a package MLS# 1211471,1211479,1211482
Key facts
- Turnkey investment
- Built 1930
- Listed 104 days
Tags
Neighborhood map
What this means for you Summary
Snapshot
- This is a 2-bed/2.0-bath townhouse listed at $210k.
Deal economics
- At list price, monthly cash flow is $-82 ($-980/yr) — negative.
- To cash-flow at today's rent, offer at most $195k (6.9% below list).
- To meet the 1% rule (rent ≥ 1% of price), the offer needs to be $158k (24.5% below list).
- Recommended offer: $158k (24.5% below list) — sets the bar for 1% rule.
- Cap rate 5.8% vs local median 3.7% in Oklahoma City — top-decile yield for the area; either an underpriced asset or a hidden risk that comps aren't pricing in. Stress-test before assuming the spread holds.
Location & tenants
- Location reads 80/100 on livability (#3 in OK, #1,635 nationally) — a professional / high-income tenant draw. Strengths: amenities A+, commute A+, cost of living A+; Watch: crime F.
- Oklahoma City (urban): math 7% / reading 10% proficiency, ranked #254 of 270 in OK (top 94%) — low school quality limits family demand, transient renter base, plan for 1-2y turnover; 82% free/reduced lunch — lower-income household profile, screen leases tightly.
- Zoned schools: Hawthorne Es (math 8% / reading 17%, grade F, #652 of 845 statewide, top 79%, 376 students, 0% FRL); Taft Ms (math 2% / reading 5%, grade F, #330 of 345 statewide, top 96%, 1,045 students, 0% FRL); Northwest Classen Hs (math 5% / reading 10%, grade F, #420 of 447 statewide, top 95%, 1,702 students, 0% FRL) — zoned schools average 0% FRL vs 82% district-wide (82 pts lower); this property's tenant base skews higher-income than the district average.
- Market conditions: Rents rising fast (+7.3%/yr); 221 active listings in the ZIP; 19 comparable units currently listed for rent nearby; rentals at typical pace (median 19d on market — plan ~3-4 weeks tenant-placement turnaround); 47% of comp listings sitting > 30 days — soft ceiling on asking rent; 5,365 units permitted in Oklahoma County in 2024 (569 in 5+ unit buildings).
- This rent runs 33% of the median local income ($57k/yr) — at the standard rent-burdened threshold; future hikes will face affordability resistance.
Forward outlook
- Local home prices are declining (-3.0%/yr); year-one equity from $1k of loan paydown is wiped out by about $6k of value loss. Plan a longer hold.
- Oklahoma County population projected at +41% by 2050 — long-run rental-demand tailwind backs the buy-and-hold thesis.
Negotiation context
- It's been on market 104 days — a 9% lower offer ($191k) is reasonable based on typical stale-listing flexibility.
- 7 sale attempts since 9y ago with the ask held roughly flat each time — persistent listings suggest the price (not the market) is what's stuck; bring a comps-based counter.
Risks & watch-outs
- Watch-outs: built in 1930 — expect roof / HVAC / electrical / plumbing capex.
- Climate carrying-cost: extreme-heat days projected 7→19/yr by 2055 (HVAC capex compounding) — expect insurance premiums to compound above CPI over the hold.
Questions for the listing agent
- What do current leases actually rent for vs. the listed asking? Can we see a recent rent roll and the last 12 months of T-12 income?
- It's been on market 104 days. Have you received any prior offers? Is the seller open to a 25% concession, seller financing, or rate buy-down credit?
- Built in 1930 — when were the roof, HVAC, electrical panel, plumbing, and water heater last replaced?
- Why hasn't it sold? Are there any deal-killer items the seller is aware of (foundation, flood, title, zoning, code violations)?
- Is there a deadline driving the sale (1031 exchange, divorce, estate, relocation)? That informs how much negotiation room exists.
- Schools are F-rated, which usually means shorter tenancies and higher turnover. Who's the typical renter profile here, and what's been the actual vacancy rate?
- Crime grade is F in this area — have there been break-ins, vandalism, or insurance claims at this property in the last 3 years? What carrier currently insures it and at what premium?
- The area grade is low — what's the realistic commute time and amenity access for the typical tenant pool here? Any planned neighborhood developments (good or bad) we should know about?
- What's the average days-on-market for RENTAL listings here right now (not sales)? A rising rental-DOM trend means longer vacancies and softer asking-rent achievability than the comps imply.
- What's the recent tenant-quality profile in this submarket — average credit score on applications, eviction rate, late-payment / NSF rate, and stable-employment percentage? A property-management company in the area should have these aggregated.
- How much new for-sale + rental construction is in the pipeline within 1–3 miles? Heavy new supply typically softens prices + rents 12–24 months out; constrained supply supports both.
Investment metrics
- 1% rule
- 0.75% ✗
- Cap rate
- 5.83%
- Cash-on-cash
- -1.67%
- DSCR
- 0.93
- GRM
- 11.0
CMA / ARV
- ARV (median comp)
- $358,430
- List price
- $209,500
- Delta
- -41.55%
- Verdict
- UNDERPRICED
- Comps
- 3 within 1.0 mi
Projected returns pro-forma
-3.0% appreciation · 7.29% rent growth · sell at horizon
- IRR
- -14.8%
- Equity multiple
- 0.45×
- Total profit
- $-32,081
- Equity at exit
- $31,237
- IRR
- -0.6%
- Equity multiple
- 0.95×
- Total profit
- $-2,917
- Equity at exit
- $18,114
Cash invested: $58,660 (down + closing). Projections, not guarantees.
Landlord ↔ Tenant lean methodology
- Overall (STATE)
- 83 Strongly Landlord-Friendly
- State Oklahoma
- 83 Strongly Landlord-Friendly · R+20
- County
- — inherits STATE
- City
- — inherits STATE
ZIP-level market 73107
- Rents YoY
- 7.3%
- Active inventory
- 221
- Price-to-rent
- 11.0×
Monthly cashflow live
- Estimated rent
- $1,581 high interval (Pro) →
- Mortgage (P&I)
- −$1,099
- Tax from tax record
- −$144 /mo · $1,734/yr
- Insurance
- −$87
- HOA
- −$0
- Vacancy / Maint / Mgmt
- −$332
- Net cashflow
- $-82
Break-even live
Sensitivity live
| Price | -10% $37 | -5% $-22 | +0% $-82 | +5% $-141 | +10% $-200 |
|---|---|---|---|---|---|
| Rent | -10% $-207 | -5% $-144 | +0% $-82 | +5% $-19 | +10% $43 |
| Rate | -1.0pp $24 | -0.5pp $-28 | base $-82 | +0.5pp $-136 | +1.0pp $-191 |
UW: 25.0% down · 7.5% · 30yr · 1.5% tax · 5.0% vac · 8.0% maint · 8.0% mgmt
Financing live
Cash to close
- Down payment
- $52,375
- Closing costs
- $6,285
- Reserves months
- —
- Total cash needed
- —
Loan-product check · same deal, 3 products live
Conventional
25% down · 7.5% · 30yr
- Down + closing
- —
- Monthly P&I
- —
- Monthly cashflow
- —
- DSCR
- —
- Eligible?
- —
Personal DTI + credit; lowest rate.
DSCR
20% down · 8.5% · 30yr
- Down + closing
- —
- Monthly P&I
- —
- Monthly cashflow
- —
- DSCR
- —
- Eligible?
- —
No personal income docs; deal must DSCR.
Hard money
10% down · 12.0% · 12mo
- Down + closing
- —
- Monthly P&I
- —
- Monthly cashflow
- —
- DSCR
- —
- Eligible?
- —
Short-term bridge; refi at stabilization.
Rent comps 19 comps
| Address | Beds | Baths | Sqft | Rent | $/sqft | DOM | Units | Dist |
|---|---|---|---|---|---|---|---|---|
| 2519 W Park Pl Oklahoma City, OK | 3.0 | 2.0 | 2000 | $1,900 | $0.95 | 45d | 1 | 0.03mi |
| 2525 NW 11th St Oklahoma City, OK | 3.0 | 2.0 | 1415 | $1,550 | $1.10 | 45d | 1 | 0.06mi |
| 1517 N Miller Blvd Oklahoma City, OK | 3.0 | 2.0 | 1968 | $1,650 | $0.84 | 5d | 1 | 0.38mi |
| 2139 NW 15th St Oklahoma City, OK | 3.0 | 2.0 | 1551 | $1,950 | $1.26 | 45d | 1 | 0.59mi |
| 1414 N Drexel Blvd Oklahoma City, OK | 2.0 | 1.0 | 1604 | $1,100 | $0.69 | 3d | 1 | 0.71mi |
| 1928 NW 18th St Oklahoma City, OK | 3.0 | 2.5 | 1914 | $2,200 | $1.15 | 45d | 1 | 0.93mi |
| 2605 NW 24th St Oklahoma City, OK | 2.0 | 1.0 | 1300 | $1,525 | $1.17 | 4d | 1 | 0.99mi |
| 2808 NW 24th St Unit A Oklahoma City, OK | 3.0 | 1.5 | 1604 | $1,595 | $0.99 | 4d | 1 | 1.01mi |
| 1138 N Blackwelder Ave Unit 3 Oklahoma City, OK | 2.0 | 2.0 | 1250 | $1,599 | $1.28 | 13d | 1 | 1.10mi |
| 3145 NW 21st St Oklahoma City, OK | 3.0 | 2.0 | 1728 | $1,600 | $0.93 | 4d | 1 | 1.12mi |
| 2504 NW 27th St Oklahoma City, OK | 2.0 | 1.0 | 1303 | $1,450 | $1.11 | 45d | 1 | 1.15mi |
| 2736 NW 27th St Oklahoma City, OK | 3.0 | 2.0 | 1657 | $1,895 | $1.14 | 3d | 1 | 1.18mi |
| 1721 NW 18th St Oklahoma City, OK | 3.0 | 2.0 | 1900 | $1,300 | $0.68 | 45d | 1 | 1.20mi |
| 2301 N Florida Ave Oklahoma City, OK | 2.0 | 1.5 | 1700 | $1,235 | $0.73 | 18d | 1 | 1.32mi |
| 2004 NW 28th St Oklahoma City, OK | 2.0 | 1.0 | 1425 | $1,195 | $0.84 | 45d | 1 | 1.43mi |
| 1215 NW 13th St Oklahoma City, OK | 3.0 | 1.0 | 1368 | $2,200 | $1.61 | 45d | 1 | 1.44mi |
| 1209 NW 11th St Oklahoma City, OK | 2.0 | 2.5 | 1400 | $1,795 | $1.28 | 18d | 1 | 1.44mi |
| 1209 NW 11th St Oklahoma City, OK | 2.0 | 2.5 | 1400 | $1,795 | $1.28 | 5d | 1 | 1.44mi |
| 1322 NW 17th St Unit B Oklahoma City, OK | 2.0 | 1.0 | 1294 | $1,200 | $0.93 | 46d | 1 | 1.46mi |
Listing history 19 events
-
2026-05-11status Pending 309-char remark
Show marketing remark (309 chars)
One side remodeled. This 100% tenant-occupied duplex offers immediate cash flow with total monthly rents of $1,700. Conveniently located with easy access to major roads, shopping, and employment centers. Turnkey investment—collect rent from day one. Can be sold as a package MLS# 1211471,1211479,1211482
-
2026-01-27$209,500 Active 309-char remark
Show marketing remark (309 chars)
One side remodeled. This 100% tenant-occupied duplex offers immediate cash flow with total monthly rents of $1,700. Conveniently located with easy access to major roads, shopping, and employment centers. Turnkey investment—collect rent from day one. Can be sold as a package MLS# 1211471,1211479,1211482
-
2018-10-22soldstatus $591,000
-
2018-10-17soldstatus $141,840 Sold 69-char remark
Show marketing remark (69 chars)
This is a duplex and is to be sold together with 2538 NW 11th Street.
-
2018-08-25status Pending 69-char remark
Show marketing remark (69 chars)
This is a duplex and is to be sold together with 2538 NW 11th Street.
-
2018-08-15$155,000 Active 69-char remark
Show marketing remark (69 chars)
This is a duplex and is to be sold together with 2538 NW 11th Street.
-
2017-12-15soldstatus $101,500
-
2017-12-14soldstatus $101,250 Sold
-
2017-11-16status Pending
-
2017-11-10status Active
-
2017-11-07status Pending
-
2017-11-07status Active
-
2017-11-07soldstatus $85,000
-
2017-10-31historical
-
2017-10-31status Active
-
2017-10-27historical
-
2017-10-05status Active
-
2017-10-01status Pending
-
2017-09-28$110,000 Active
ⓘ Source: listings_history table (triggers on properties + properties_extension) + one-shot
backfill from property_details.listing_events for pre-trigger history.
Tax reassessment forecast OK · Resets to sale price
- Current annual tax
- $1,734 · $144/mo
- Projected year-2 tax
- $1,885 · $157/mo
- Expected delta
- +$152/yr (+$13/mo · 8.7%)
ⓘ Screening estimate from a state-policy table — verify with the county assessor before closing.
Climate risk First Street
- Flood 1/10 Low FEMA zone X (unshaded) · 0% chance over 30 yrs
- Wildfire 1/10 Low
- Heat 6/10 Major 7 d/yr ≥107°F today · 19 d/yr by 30 yrs out
- Wind 2/10 Low 3% chance of damaging wind over 30 yrs
- Air quality 2/10 Low 1 unhealthy d/yr today · 2 by 30 yrs out
Nearby sold comps map
Loading sold comps map…
Walkable amenities ~0.75 mi
Loading nearby amenities…
Taxation est. · year 1
- Rental income
- $18,968
- − Mortgage interest
- −$11,735
- − Property taxes
- −$1,734
- − Insurance
- −$1,048
- − Repairs & maintenance
- −$1,517
- − Management
- −$1,517
- − Depreciation
- −$6,095
- Taxable loss
- −$4,678
- Est. tax savings @ 24.0%
- +$1,123
- After-tax cash flow
- $143/yr
For passive investors: Depreciation is non-cash, so a rental often shows a tax loss while cash-flowing — sheltering income. Rental losses are passive: they offset passive income freely, and up to $25,000/yr can offset ordinary (W-2) income if you actively participate and your MAGI is under $100k (phasing out to $0 by $150k); unused losses carry forward. On sale, claimed depreciation is recaptured at up to 25%, and gains may owe capital-gains tax (a 1031 exchange can defer both). Figures are a year-1 estimate at your 24.0% rate — not tax advice; consult a CPA.
Schools (NCES district)
- District
- Oklahoma City
- NCES district ID
- 4022770
- Math proficiency
- 7% ▼ -5.00%
- Reading proficiency
- 10% ▼ -6.00%
- Median HH income
- $35,606
- Composite
- 7.0/100
- National rank
- #9970
- State rank
- #254 of 270 in OK
Livability — Oklahoma City
- Score
- 80/100
- State rank
- #3
- US rank
- #1635
Category grades
Schools grade is shown separately in the Schools card above.
Census & demographics
- Census place
- Oklahoma City, OK
- County
- Oklahoma County · 771,644 people
- City population
- 498,656
- Metro
- Oklahoma City, OK
- Population (ZIP)
- 25,791
- Household income
- $56,873
- Rent vs Own
- Severe rent burden
- 1210.0
Population outlook (Oklahoma County) Hauer SSP2
- Today (2025)
- 911,875 people
- By 2030
- 982,413 · +7.7%
- By 2040
- 1,130,468 · +24.0%
- By 2050
- 1,288,422 · +41.3%
- By 2075
- 1,711,482 · +87.7%
- By 2100
- 2,088,448 · +129.0%
Race, ethnicity, and origin ACS 2023
- Neighborhood character
- Diverse neighborhood (Simpson 0.64)
- Race & ethnicity
- White 47% Hispanic / Latino 37% Two or more races 13% Native American 6% Black 5% Asian 2%
- Hispanic origin (detail)
- Mexican 22%
- Common ancestry
- Lithuanian 1% Italian 1% Slovak 1%
- Foreign-born
- 19% · Canada, Vietnam
- Languages at home
- 67% English-only · Spanish 30% Vietnamese 1%
Political lean MEDSL · Oklahoma
- 2024 margin
- Toss-up / Even · D 48.0% · R 49.7% · Other 2.3%
- 2008→2024 swing
- +15.1pp toward D · 2008: -16.8pp · 2024: -1.7pp
- All cycles
- 2024: R+1.7 2020: R+1.1 2016: R+10.5 2012: R+16.7 2008: R+16.8
Not yet ingested
- Civics
- —
Market trends
- HPI YoY
- ▼ -245.03%
- Current HPI
- 274.7844
- Rent YoY
- ▲ 7.29%
- Metro
- Oklahoma City, OK
- State GDP YoY
- ▲ 1.55%
- F500 in state
- 6
Industry mix (Fortune 500 HQ in OK)
| Industry | F500 HQs | Revenue |
|---|---|---|
| Energy | 3 | $48B |
|
||
Price history
+90.5% since first listed19 events — show timeline
- 2026-05-11 Pending — MLSOK
- 2026-01-27 Listed $209,500 MLSOK
- 2018-10-22 Sold (Public Records) $591,000 Public Records
- 2018-10-17 Sold (MLS) $141,840 MLSOK
- 2018-08-25 Pending — MLSOK
- 2018-08-15 Listed $155,000 MLSOK
- 2017-12-15 Sold (Public Records) $101,500 Public Records
- 2017-12-14 Sold (MLS) $101,250 MLSOK
- 2017-11-16 Pending — MLSOK
- 2017-11-10 Relisted — MLSOK
- 2017-11-07 Pending — MLSOK
- 2017-11-07 Relisted — MLSOK
- 2017-11-07 Sold (Public Records) $85,000 Public Records
- 2017-10-31 Listing Removed — MLSOK
- 2017-10-31 Relisted — MLSOK
- 2017-10-27 Listing Removed — MLSOK
- 2017-10-05 Relisted — MLSOK
- 2017-10-01 Pending — MLSOK
- 2017-09-28 Listed $110,000 MLSOK
Property tax history
+7.4%/yrLatest (2025): $1,734 · +4.2% YoY. Source: county tax records.
Cash-flow waterfall
monthlySold comps — $/sqft
last 12 mo · ≤1 miLoading sold comps…