 5-Plex
79-87 N Old Greenfield Rd · Ellenville, NY
Flood risk No data
- FEMA flood zone
- —
- Chance of flooding over 30 yrs
- —
- Est. flood insurance / yr
- —
Fire risk No data
- Est. fire insurance / yr
- —
Heat risk No data
- Hot days now (above threshold)
- —
- Hot days in 30 yrs
- —
Wind risk No data
- Chance of severe wind over 30 yrs
- —
Air-quality risk No data
- Unhealthy air days now
- —
- Unhealthy air days in 30 yrs
- —
Risk factors via First Street. Map © Google.
Why this score? — see what drove the C- grade
The composite is a weighted blend of 9 inputs, each scored 0–100. Each bar is that input's sub-score; the figure is the points it added to the 100-point composite (weight × sub-score).
- Cash flow +15.0/30.0
- Appreciation +10.0/10.0
- ARV discount +7.5/15.0
- 1% rule +5.0/10.0
- DSCR +5.0/10.0
- Schools +3.3/10.0
- Livability +3.0/5.0
- Rent growth +2.5/5.0
- Condition / age +1.0/5.0
$103,100
🖨 Deal sheet 📄 Offer letter ✓ Due diligence
Multi-family units
County records classify this as Multi-Family (2-4 Unit). Listing-text estimate: 5 units. estimate disagrees with records
Listing remarks MLS
Looking for a great opportunity? This property has tons of potential and is average in living space size for the neighborhood. It is located close to main roads with easy access to local amenities, such as shopping, banking, schools, and various eateries. Per our Appraisal describes the property as a MFR (4) built in 1938. It has a GLA of approx. 3395 and has 7 bedrooms and 4.5bath, NO basement and NO Garage. The property is on 33977 sq ft Seller cannot guarantee access at any given time.
Key facts
- 0.78 acre lot
- Built 1938
- Listed 76 days
Neighborhood map
What this means for you Summary
Snapshot
- This is a 5 × 7-bed/4.5-bath units multifamily listed at $103k. Condition is rated poor.
Deal economics
- At list price, monthly cash flow is $6k ($77k/yr) — positive. Per door: $1k/mo.
- The deal already cash-flows at list — no discount required.
- Meets the 1% rule at list price ($9k rent vs $103k).
- Recommended offer: $97k (6.0% below list) — sets the bar for market timing.
- Cap rate 81.4% vs local median 3.8% in Ellenville — top-decile yield for the area; either an underpriced asset or a hidden risk that comps aren't pricing in. Stress-test before assuming the spread holds.
Location & tenants
- Location reads 60/100 on livability (#961 in NY) — a middle-class / working-renter tenant base. Strengths: cost of living A, housing A-; Watch: crime C-, schools D-, amenities F.
- Ellenville Central School District (town): math 32% / reading 46% proficiency, ranked #534 of 590 in NY (top 90%) — families likely to look elsewhere, expect single-tenant / working-renter base with shorter leases.
- Market conditions: 70 active listings in the ZIP; 464 units permitted in Ulster County in 2024 (170 in 5+ unit buildings).
Forward outlook
- In year one you build about $11k of equity ($713 loan paydown + $10k appreciation (10.0% local appreciation)).
- Ulster County population projected at -14% by 2050 — secular population decline; favor cash flow + early exit over multi-decade hold.
- At projected returns (10.0% appreciation + 3.0% rent growth), your $29k cash investment doubles in ~1 year — after that, you're playing with house money.
- By year 4, paydown + projected appreciation supports a ~$39k cash-out refi (75% LTV) — recoverable capital for the next deal without selling this one.
Negotiation context
- It's been on market 76 days — a 6% lower offer ($97k) is reasonable based on typical stale-listing flexibility.
- 2 sale attempts; this cycle's ask has dropped $35k (25%) from the opening price — seller is motivated, your offer sets the floor, not the list.
Risks & watch-outs
- Watch-outs: built in 1938 — expect roof / HVAC / electrical / plumbing capex.
Questions for the listing agent
- It's been on market 76 days. Have you received any prior offers? Is the seller open to a 6% concession, seller financing, or rate buy-down credit?
- Can we see the unit-by-unit rent roll, current vacancy, and any below-market leases? What's the average tenancy length?
- What capital expenditures (roof, boiler, parking lot, exteriors) have been made in the last 5 years, and what's planned in the next 2?
- Have any recent inspections been done? Can we get a copy of the seller's disclosures and any deferred-maintenance estimates?
- Built in 1938 — when were the roof, HVAC, electrical panel, plumbing, and water heater last replaced?
- Why hasn't it sold? Are there any deal-killer items the seller is aware of (foundation, flood, title, zoning, code violations)?
- Is there a deadline driving the sale (1031 exchange, divorce, estate, relocation)? That informs how much negotiation room exists.
- Schools are D-rated, which usually means shorter tenancies and higher turnover. Who's the typical renter profile here, and what's been the actual vacancy rate?
- What's the average days-on-market for RENTAL listings here right now (not sales)? A rising rental-DOM trend means longer vacancies and softer asking-rent achievability than the comps imply.
- What's the recent tenant-quality profile in this submarket — average credit score on applications, eviction rate, late-payment / NSF rate, and stable-employment percentage? A property-management company in the area should have these aggregated.
- How much new apartment / multifamily construction is in the pipeline within 1–3 miles? Heavy new supply (>2% of stock underway) typically softens rents 12–24 months out; light construction supports rent growth.
Investment metrics
- 1% rule
- 8.80% ✓
- Cap rate
- 81.40%
- Cash-on-cash
- 268.23%
- DSCR
- 12.93
- GRM
- 0.9
CMA / ARV
- ARV (median comp)
- $572,874
- List price
- $103,100
- Delta
- -82.00%
- Verdict
- UNDERPRICED
- Comps
- 17 within 2.0 mi
Projected returns pro-forma
10.0% appreciation · 3.0% rent growth · sell at horizon
- IRR
- —
- Equity multiple
- 17.19×
- Total profit
- $467,270
- Equity at exit
- $92,881
- IRR
- —
- Equity multiple
- 37.48×
- Total profit
- $1,053,112
- Equity at exit
- $200,301
Cash invested: $28,868 (down + closing). Projections, not guarantees.
Landlord ↔ Tenant lean methodology
- Overall (STATE)
- 15 Strongly Tenant-Friendly
- State New York
- 15 Strongly Tenant-Friendly · D+10
- County
- — inherits STATE
- City
- — inherits STATE
ZIP-level market 12428
- Home prices YoY
- 20.0%
- Active inventory
- 70
- Price-to-rent
- 4.7×
Monthly cashflow live
- Estimated rent
- $9,070 medium interval (Pro) →
- Mortgage (P&I)
- −$541
- Tax est. 1.5%
- −$129 /mo · $1,546/yr
- Insurance
- −$43
- HOA
- −$0
- Vacancy / Maint / Mgmt
- −$1,905
- Net cashflow
- $6,453
Break-even live
5-unit breakdown (identical units grouped — click to expand)
| Units | Beds | Baths | Est. rent |
|---|---|---|---|
| 5× units | 7 | 4.5 | $9,070 |
| #1 | 7 | 4.5 | $1,814 |
| #2 | 7 | 4.5 | $1,814 |
| #3 | 7 | 4.5 | $1,814 |
| #4 | 7 | 4.5 | $1,814 |
| #5 | 7 | 4.5 | $1,814 |
| Total (5 units) | $9,070 | ||
UW: 25.0% down · 7.5% · 30yr · 1.5% tax · 5.0% vac · 8.0% maint · 8.0% mgmt
Financing live
Cash to close
- Down payment
- $25,775
- Closing costs
- $3,093
- Reserves months
- —
- Total cash needed
- —
Loan-product check · same deal, 3 products live
Conventional
25% down · 7.5% · 30yr
- Down + closing
- —
- Monthly P&I
- —
- Monthly cashflow
- —
- DSCR
- —
- Eligible?
- —
Personal DTI + credit; lowest rate.
DSCR
20% down · 8.5% · 30yr
- Down + closing
- —
- Monthly P&I
- —
- Monthly cashflow
- —
- DSCR
- —
- Eligible?
- —
No personal income docs; deal must DSCR.
Hard money
10% down · 12.0% · 12mo
- Down + closing
- —
- Monthly P&I
- —
- Monthly cashflow
- —
- DSCR
- —
- Eligible?
- —
Short-term bridge; refi at stabilization.
Listing history 17 events
-
2026-06-18days on market $103,100 Active 76 DOM
-
2026-06-17days on market $103,100 Active 75 DOM
-
2026-06-16days on market $103,100 Active 74 DOM
-
2026-06-15days on market $103,100 Active 73 DOM
-
2026-06-13pricedays on market $103,100 Active 71 DOM
-
2026-06-12days on market $113,500 Active 70 DOM
-
2026-06-09days on market $113,500 Active 67 DOM
-
2026-06-08days on market $113,500 Active 66 DOM
-
2026-06-07days on market $113,500 Active 65 DOM
-
2026-06-07days on market $113,500 Active 64 DOM
-
2026-06-04days on market $113,500 Active 61 DOM
-
2026-06-02days on market $113,500 Active 60 DOM
-
2026-06-01days on market $113,500 Active 59 DOM
-
2026-05-31days on market $113,500 Active 58 DOM
-
2026-05-11price $126,500 493-char remark
Show marketing remark (493 chars)
Looking for a great opportunity? This property has tons of potential and is average in living space size for the neighborhood. It is located close to main roads with easy access to local amenities, such as shopping, banking, schools, and various eateries. Per our Appraisal describes the property as a MFR (4) built in 1938. It has a GLA of approx. 3395 and has 7 bedrooms and 4.5bath, NO basement and NO Garage. The property is on 33977 sq ft Seller cannot guarantee access at any given time.
-
2026-04-03status Active 493-char remark
Show marketing remark (493 chars)
Looking for a great opportunity? This property has tons of potential and is average in living space size for the neighborhood. It is located close to main roads with easy access to local amenities, such as shopping, banking, schools, and various eateries. Per our Appraisal describes the property as a MFR (4) built in 1938. It has a GLA of approx. 3395 and has 7 bedrooms and 4.5bath, NO basement and NO Garage. The property is on 33977 sq ft Seller cannot guarantee access at any given time.
-
2026-04-02$137,800 Active 493-char remark
Show marketing remark (493 chars)
Looking for a great opportunity? This property has tons of potential and is average in living space size for the neighborhood. It is located close to main roads with easy access to local amenities, such as shopping, banking, schools, and various eateries. Per our Appraisal describes the property as a MFR (4) built in 1938. It has a GLA of approx. 3395 and has 7 bedrooms and 4.5bath, NO basement and NO Garage. The property is on 33977 sq ft Seller cannot guarantee access at any given time.
ⓘ Source: listings_history table (triggers on properties + properties_extension) + one-shot
backfill from property_details.listing_events for pre-trigger history.
Nearby sold comps map
Loading sold comps map…
Walkable amenities ~0.75 mi
Loading nearby amenities…
Taxation est. · year 1
- Rental income
- $108,840
- − Mortgage interest
- −$5,775
- − Property taxes
- −$1,546
- − Insurance
- −$516
- − Repairs & maintenance
- −$8,707
- − Management
- −$8,707
- − Depreciation
- −$2,999
- Taxable income
- $80,589
- Est. tax owed @ 24.0%
- −$19,341
- After-tax cash flow
- $58,092/yr
For passive investors: Depreciation is non-cash, so a rental often shows a tax loss while cash-flowing — sheltering income. Rental losses are passive: they offset passive income freely, and up to $25,000/yr can offset ordinary (W-2) income if you actively participate and your MAGI is under $100k (phasing out to $0 by $150k); unused losses carry forward. On sale, claimed depreciation is recaptured at up to 25%, and gains may owe capital-gains tax (a 1031 exchange can defer both). Figures are a year-1 estimate at your 24.0% rate — not tax advice; consult a CPA.
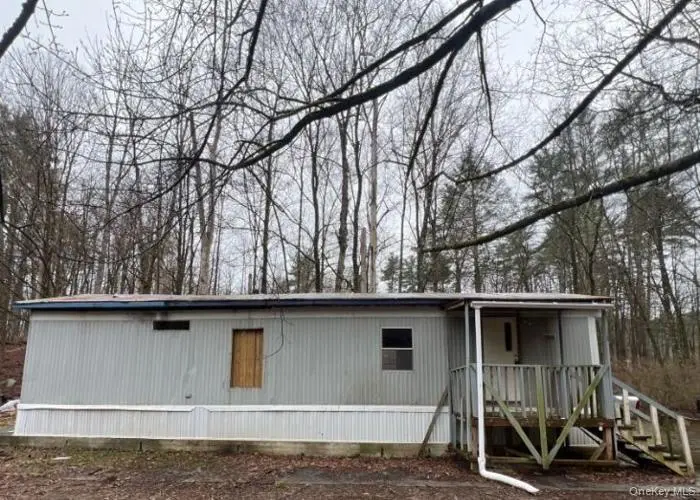
Condition & rehab AI · 13 photos
This property requires extensive renovations to bring it up to modern standards, significantly impacting its resale and rental value.
Repairs flagged
- Major Roof — Signs of wear and potential leaks.
- Major Siding — Weathered and damaged, exposing framing.
- Major Windows — Missing or damaged, allowing for drafts and heat loss.
- Major Flooring — Worn linoleum, needs replacement.
- Major Paint — Worn and peeling, needs repainting.
- Major Kitchen and Bath Fixtures — Outdated and in poor condition, needs replacement.
Value-add opportunities
- Both New Roof — Extends the life of the property and improves curb appeal.
- Both Siding Replacement — Enhances the property's appearance and energy efficiency.
- Both Windows — Improves energy efficiency and enhances the property's curb appeal.
- Both Flooring Replacement — Enhances the property's appearance and comfort.
- Both Paint Job — Enhances the property's appearance and comfort.
- Both Kitchen and Bath Fixtures — Enhances the property's functionality and appeal.
Renovation cost estimate screening
| Repair item | Severity | Est. cost |
|---|---|---|
| Roof · Signs of wear and potential leaks. | Major | $15,000–50,000 |
| Siding · Weathered and damaged, exposing framing. | Major | $15,000–50,000 |
| Windows · Missing or damaged, allowing for drafts and heat loss. | Major | $15,000–50,000 |
| Flooring · Worn linoleum, needs replacement. | Major | $15,000–50,000 |
| Paint · Worn and peeling, needs repainting. | Major | $15,000–50,000 |
| Kitchen and Bath Fixtures · Outdated and in poor condition, needs replacement. | Major | $15,000–50,000 |
| Total estimated repair cost · 6 items | $90,000–300,000 |
Value-add ROI direction
- Both New Roof — Extends the life of the property and improves curb appeal. ↑
- Both Siding Replacement — Enhances the property's appearance and energy efficiency. ↑
- Both Windows — Improves energy efficiency and enhances the property's curb appeal. ↑
- Both Flooring Replacement — Enhances the property's appearance and comfort. ↑
- Both Paint Job — Enhances the property's appearance and comfort. ↑
- Both Kitchen and Bath Fixtures — Enhances the property's functionality and appeal. ↑
ⓘ Cost ranges are severity-bucket heuristics (US national rule-of-thumb). Get contractor quotes + a written scope before underwriting a rehab budget.
Schools (NCES district)
- District
- Ellenville Central School District
- NCES district ID
- 3610500
- Math proficiency
- 32% ▼ -6.00%
- Reading proficiency
- 46% ▲ 10.00%
- Median HH income
- $45,937
- Composite
- 33.22/100
- National rank
- #5525
- State rank
- #534 of 590 in NY
Livability — Ellenville
- Score
- 60/100
- State rank
- #961
- US rank
- #18871
Category grades
Schools grade is shown separately in the Schools card above.
Census & demographics
- Population (ZIP)
- 6,972
Population outlook (Ulster County) Hauer SSP2
- Today (2025)
- 175,887 people
- By 2030
- 171,876 · -2.3%
- By 2040
- 161,771 · -8.0%
- By 2050
- 151,470 · -13.9%
- By 2075
- 133,023 · -24.4%
- By 2100
- 113,504 · -35.5%
Race, ethnicity, and origin ACS 2023
- Neighborhood character
- Majority White (63%)
- Race & ethnicity
- White 63% Hispanic / Latino 28% Two or more races 9% Black 4%
- Hispanic origin (detail)
- Mexican 1% Puerto Rican 17% Dominican 4%
- Common ancestry
- Romanian 5% Italian 3% Lithuanian 3%
- Foreign-born
- 9% · Canada, Jamaica, Dominican Republic
- Languages at home
- 75% English-only · Spanish 20% Russian/Polish/Slavic 4% Other Indo-European 1%
Political lean MEDSL · Ulster
- 2024 margin
- D (+18.7) · D 59.3% · R 40.7%
- 2008→2024 swing
- -4.9pp toward R · 2008: 23.6pp · 2024: 18.7pp
- All cycles
- 2024: D+18.7 2020: D+20.9 2016: D+9.1 2012: D+21.9 2008: D+23.6
Not yet ingested
- Civics
- —
Market trends
- HPI YoY
- ▲ 62.17%
- Current HPI
- 372.5352
- Rent YoY
- —
- Metro
- —
- State GDP YoY
- ▲ 2.60%
- F500 in state
- 92
Industry mix (Fortune 500 HQ in NY)
| Industry | F500 HQs | Revenue |
|---|---|---|
| Financial Services | 10 | $950B |
|
||
| Consumer Goods | 9 | $162B |
|
||
| Insurance | 4 | $225B |
|
||
| Telecommunications | 2 | $144B |
|
||
| Pharmaceuticals | 2 | $112B |
|
||
| Media / Entertainment | 2 | $69B |
|
||
Price history
-8.2% since first listed3 events — show timeline
- 2026-05-11 Price Changed $126,500 OneKey® MLS as Distributed by MLS Grid
- 2026-04-03 Relisted — OneKey® MLS as Distributed by MLS Grid
- 2026-04-02 Listed $137,800 OneKey® MLS as Distributed by MLS Grid
Cash-flow waterfall
monthlySold comps — $/sqft
last 12 mo · ≤1 miLoading sold comps…