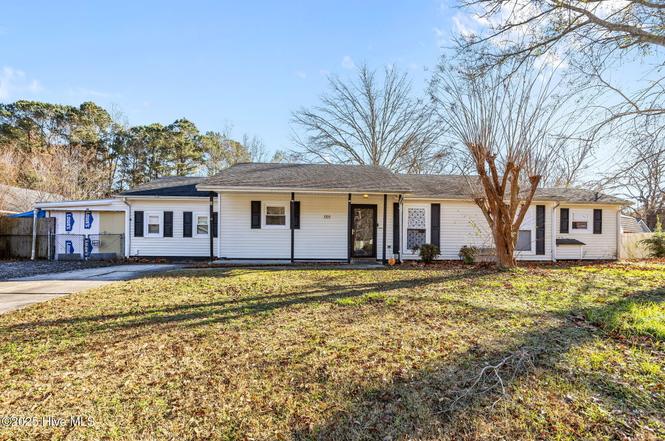
1004 Springdale Dr · Jacksonville, NC
Flood risk 1/10 · Minimal
- FEMA flood zone
- X (unshaded)
- Chance of flooding over 30 yrs
- 0.0%
- Est. flood insurance / yr
- $507 – $1,088
Fire risk 5/10 · Moderate
- Est. fire insurance / yr
- $906 – $1,684
Heat risk 9/10 · Severe
- Hot days now (above 106°F)
- 7 days/yr
- Hot days in 30 yrs
- 18 days/yr
Wind risk 8/10 · Major
- Chance of severe wind over 30 yrs
- 99.0%
Air-quality risk 3/10 · Minor
- Unhealthy air days now
- 2 days/yr
- Unhealthy air days in 30 yrs
- 5 days/yr
Risk factors via First Street. Map © Google.
Why this score? — see what drove the D+ grade
The composite is a weighted blend of 9 inputs, each scored 0–100. Each bar is that input's sub-score; the figure is the points it added to the 100-point composite (weight × sub-score).
- ARV discount +13.9/15.0
- Cash flow +13.7/30.0
- DSCR +4.1/10.0
- Schools +3.9/10.0
- Rent growth +3.6/5.0
- Livability +3.6/5.0
- 1% rule +2.7/10.0
- Condition / age +2.5/5.0
- Appreciation +0.0/10.0
$229,999
🖨 Deal sheet (PDF) 📄 Offer letter ✓ Due diligence
Listing remarks MLS
Welcome to the cozy Springdale Acres subdivision. Schedule to see this beautiful four bedroom and two full bath home which was renovated only a year ago! Enjoy those hot summer days with your very own in-ground pool with fence surrounding it for that added security for children. This open floor plan is perfect for entertaining. The living room has laminate flooring and cozy fireplace, while the family room has carpet and leads to your backyard. The kitchen has granite countertops, stainless steel appliances and laminate floors as well. All four bedrooms have carpet and adequate size and closet.
Key facts
- Covered front porch
- In-ground pool
- Flex room
Tags
Neighborhood map
What this means for you Summary
Snapshot
- This is a 4-bed/2.0-bath single-family listed at $230k.
Deal economics
- At list price, monthly cash flow is $16 ($192/yr) — positive.
- The deal already cash-flows at list — no discount required.
- To meet the 1% rule (rent ≥ 1% of price), the offer needs to be $178k (22.6% below list).
- Recommended offer: $178k (22.6% below list) — sets the bar for 1% rule.
- Cap rate 6.4% vs local median 4.4% in Jacksonville — top-decile yield for the area; either an underpriced asset or a hidden risk that comps aren't pricing in. Stress-test before assuming the spread holds.
Location & tenants
- Location reads 71/100 on livability (#111 in NC) — a middle-class / working-renter tenant base. Strengths: cost of living A+, housing A+, health & safety A+; Watch: employment D, crime F, amenities F.
- Onslow County Schools (other): math 42% / reading 49% proficiency, ranked #84 of 178 in NC (top 47%) — families likely to look elsewhere, expect single-tenant / working-renter base with shorter leases.
- Zoned schools: Blue Creek Elementary (math 42% / reading 47%, grade F, #574 of 1,410 statewide, top 43%, 490 students, 66% FRL); Southwest Middle (math 22% / reading 42%, grade F, #317 of 475 statewide, top 68%, 527 students, 64% FRL); Southwest High (math 52% / reading 47%, grade D, #311 of 535 statewide, top 60%, 702 students, 54% FRL) — zoned schools average 61% FRL vs 37% district-wide (25 pts higher); higher-poverty schools than district average — tighter screening recommended.
- Market conditions: Rents rising fast (+4.5%/yr); 386 active listings in the ZIP; 4 comparable units currently listed for rent nearby; rentals at typical pace (median 23d on market — plan ~3-4 weeks tenant-placement turnaround); 1,246 units permitted in Onslow County in 2024 (0 in 5+ unit buildings).
- This rent runs 33% of the median local income ($66k/yr) — at the standard rent-burdened threshold; future hikes will face affordability resistance.
Forward outlook
- Local home prices are declining (-3.0%/yr); year-one equity from $2k of loan paydown is wiped out by about $7k of value loss. Plan a longer hold.
Negotiation context
- It's been on market 189 days — a 12% lower offer ($202k) is reasonable based on typical stale-listing flexibility.
- 5 sale attempts since 12y ago; this cycle's ask has dropped $35k (13%) from the opening price — seller is motivated, your offer sets the floor, not the list.
- Current owner paid $155k; 48% above their basis — modest negotiation headroom, anchor on the comps not their cost.
Risks & watch-outs
- Climate carrying-cost: severe wind risk, 99% chance of damaging wind over 30y; moderate wildfire risk; extreme-heat days projected 7→18/yr by 2055 (HVAC capex compounding) — expect insurance premiums to compound above CPI over the hold.
Questions for the listing agent
- It's been on market 189 days. Have you received any prior offers? Is the seller open to a 23% concession, seller financing, or rate buy-down credit?
- Why hasn't it sold? Are there any deal-killer items the seller is aware of (foundation, flood, title, zoning, code violations)?
- Is there a deadline driving the sale (1031 exchange, divorce, estate, relocation)? That informs how much negotiation room exists.
- Crime grade is F in this area — have there been break-ins, vandalism, or insurance claims at this property in the last 3 years? What carrier currently insures it and at what premium?
- The area grade is low — what's the realistic commute time and amenity access for the typical tenant pool here? Any planned neighborhood developments (good or bad) we should know about?
- What's the average days-on-market for RENTAL listings here right now (not sales)? A rising rental-DOM trend means longer vacancies and softer asking-rent achievability than the comps imply.
- What's the recent tenant-quality profile in this submarket — average credit score on applications, eviction rate, late-payment / NSF rate, and stable-employment percentage? A property-management company in the area should have these aggregated.
- How much new for-sale + rental construction is in the pipeline within 1–3 miles? Heavy new supply typically softens prices + rents 12–24 months out; constrained supply supports both.
Investment metrics
- 1% rule
- 0.77% ✗
- Cap rate
- 6.38%
- Cash-on-cash
- 0.30%
- DSCR
- 1.01
- GRM
- 10.8
CMA / ARV
- ARV (on-the-fly)
- $268,156
- Comps found
- 12
Show comp detail 12 sales within ~0.75 mi
| Address | Dist | Beds/Ba | Sqft | Sold | Price | $/sf | Match |
|---|---|---|---|---|---|---|---|
| 203 Pegasus Pl S | 0.26mi | 3/2.5 (-1) | 1,682 (-2%) | 3mo | $329,000 | $196 | 76 |
| 1100 Shroyer Cir | 0.17mi | 3/2.0 (-1) | 1,536 (-10%) | 1mo | $240,000 | $156 | 70 |
| 1111 Shroyer Cir | 0.23mi | 4/2.0 | 1,623 (-5%) | 16mo | $217,000 | $134 | 68 |
| 305 Forbes Ln | 0.63mi | 4/2.0 | 1,768 (+4%) | 6mo | $295,000 | $167 | 59 |
| 76 Vandergrift Dr | 0.49mi | 3/2.0 (-1) | 1,755 (+3%) | 12mo | $259,900 | $148 | 58 |
| 1324 Sofia Ct | 0.15mi | 3/2.0 (-1) | 1,901 (+11%) | 16mo | $305,000 | $160 | 56 |
| 106 Lindsey Dr | 0.58mi | 3/2.5 (-1) | 1,805 (+6%) | 3mo | $245,000 | $136 | 54 |
| 1060 Furia Dr | 0.34mi | 4/2.0 | 1,939 (+14%) | 15mo | $305,000 | $157 | 49 |
| 1244 Old Maplehurst Rd | 0.47mi | 3/2.5 (-1) | 1,495 (-12%) | 3mo | $325,000 | $217 | 48 |
| 42 Heritage Dr | 0.74mi | 3/2.0 (-1) | 1,813 (+6%) | 4mo | $250,000 | $138 | 47 |
| 1260 Old Maplehurst Rd | 0.43mi | 3/2.5 (-1) | 1,495 (-12%) | 11mo | $325,000 | $217 | 43 |
| 219 Pollard Dr | 0.74mi | 3/2.0 (-1) | 1,855 (+9%) | 11mo | $285,000 | $154 | 37 |
Match score weights: distance 35% · size 25% · config 20% · recency 20%. Top-matched comps best support the ARV.
Projected returns pro-forma
-3.0% appreciation · 4.47% rent growth · sell at horizon
- IRR
- -14.4%
- Equity multiple
- 0.48×
- Total profit
- $-33,671
- Equity at exit
- $34,294
- IRR
- -3.8%
- Equity multiple
- 0.73×
- Total profit
- $-17,090
- Equity at exit
- $19,886
Cash invested: $64,400 (down + closing). Projections, not guarantees.
Landlord ↔ Tenant lean methodology
- Overall (STATE)
- 85 Strongly Landlord-Friendly
- State North Carolina
- 85 Strongly Landlord-Friendly · R+3
- County
- — inherits STATE
- City
- — inherits STATE
ZIP-level market 28540
- Home prices YoY
- -21.5%
- Rents YoY
- 4.5%
- Active inventory
- 386
- Price-to-rent
- 10.8×
Monthly cashflow live
- Estimated rent
- $1,781 medium interval (Pro) →
- Mortgage (P&I)
- −$1,206
- Tax from tax record
- −$89 /mo · $1,070/yr
- Insurance
- −$96
- HOA
- −$0
- Vacancy / Maint / Mgmt
- −$374
- Net cashflow
- $16
Break-even live
Sensitivity live
| Price | -10% $146 | -5% $81 | +0% $16 | +5% $-49 | +10% $-114 |
|---|---|---|---|---|---|
| Rent | -10% $-125 | -5% $-54 | +0% $16 | +5% $86 | +10% $157 |
| Rate | -1.0pp $132 | -0.5pp $75 | base $16 | +0.5pp $-44 | +1.0pp $-104 |
UW: 25.0% down · 7.5% · 30yr · 1.5% tax · 5.0% vac · 8.0% maint · 8.0% mgmt
Financing live
Cash to close
- Down payment
- $57,500
- Closing costs
- $6,900
- Reserves months
- —
- Total cash needed
- —
Loan-product check · same deal, 3 products live
Conventional
25% down · 7.5% · 30yr
- Down + closing
- —
- Monthly P&I
- —
- Monthly cashflow
- —
- DSCR
- —
- Eligible?
- —
Personal DTI + credit; lowest rate.
DSCR
20% down · 8.5% · 30yr
- Down + closing
- —
- Monthly P&I
- —
- Monthly cashflow
- —
- DSCR
- —
- Eligible?
- —
No personal income docs; deal must DSCR.
Hard money
10% down · 12.0% · 12mo
- Down + closing
- —
- Monthly P&I
- —
- Monthly cashflow
- —
- DSCR
- —
- Eligible?
- —
Short-term bridge; refi at stabilization.
Rent comps 4 comps
| Address | Beds | Baths | Sqft | Rent | $/sqft | DOM | Units | Dist |
|---|---|---|---|---|---|---|---|---|
| 1162 Shroyer Cir Jacksonville, NC | 3.0 | 2.0 | 1294 | $1,700 | $1.31 | 15d | 1 | 0.32mi |
| 94 Vandergrift Dr Jacksonville, NC | 4.0 | 2.0 | 1456 | $1,600 | $1.10 | 15d | 1 | 0.68mi |
| 34 Heritage Ct Jacksonville, NC | 3.0 | 2.0 | 1553 | $1,750 | $1.13 | 23d | 1 | 0.69mi |
| 184 Justice Rd Jacksonville, NC | 3.0 | 2.0 | 1270 | $1,900 | $1.50 | 23d | 1 | 1.47mi |
Listing history 30 events
-
2026-06-21days on market $229,999 Active 189 DOM
-
2026-06-19days on market $229,999 Active 187 DOM
-
2026-06-18days on market $229,999 Active 186 DOM
-
2026-06-17days on market $229,999 Active 185 DOM
-
2026-06-16days on market $229,999 Active 184 DOM
-
2026-06-15days on market $229,999 Active 183 DOM
-
2026-06-14days on market $229,999 Active 181 DOM
-
2026-06-13days on market $229,999 Active 180 DOM
-
2026-06-10days on market $229,999 Active 178 DOM
-
2026-06-09days on market $229,999 Active 177 DOM
-
2026-06-09days on market $229,999 Active 176 DOM
-
2026-06-07days on market $229,999 Active 175 DOM
-
2026-06-03days on market $229,999 Active 171 DOM
-
2026-06-02days on market $229,999 Active 170 DOM
-
2026-06-01days on market $229,999 Active 169 DOM
-
2026-05-31days on market $229,999 Active 168 DOM
-
2026-05-30days on market $229,999 Active 167 DOM
-
2026-03-09price $229,999
-
2026-02-11price $242,000
-
2025-12-14$265,000 Active
-
2017-09-06soldstatus $155,000 601-char remark
Show marketing remark (601 chars)
Welcome to the cozy Springdale Acres subdivision. Schedule to see this beautiful four bedroom and two full bath home which was renovated only a year ago! Enjoy those hot summer days with your very own in-ground pool with fence surrounding it for that added security for children. This open floor plan is perfect for entertaining. The living room has laminate flooring and cozy fireplace, while the family room has carpet and leads to your backyard. The kitchen has granite countertops, stainless steel appliances and laminate floors as well. All four bedrooms have carpet and adequate size and closet.
-
2017-09-06soldstatus $155,000
Show marketing remark (601 chars)
Welcome to the cozy Springdale Acres subdivision. Schedule to see this beautiful four bedroom and two full bath home which was renovated only a year ago! Enjoy those hot summer days with your very own in-ground pool with fence surrounding it for that added security for children. This open floor plan is perfect for entertaining. The living room has laminate flooring and cozy fireplace, while the family room has carpet and leads to your backyard. The kitchen has granite countertops, stainless steel appliances and laminate floors as well. All four bedrooms have carpet and adequate size and closet.
-
2017-01-16$154,950 601-char remark
Show marketing remark (601 chars)
Welcome to the cozy Springdale Acres subdivision. Schedule to see this beautiful four bedroom and two full bath home which was renovated only a year ago! Enjoy those hot summer days with your very own in-ground pool with fence surrounding it for that added security for children. This open floor plan is perfect for entertaining. The living room has laminate flooring and cozy fireplace, while the family room has carpet and leads to your backyard. The kitchen has granite countertops, stainless steel appliances and laminate floors as well. All four bedrooms have carpet and adequate size and closet.
-
2017-01-14historical
-
2016-10-11$155,000
-
2015-05-09soldstatus $142,500
-
2014-12-24$145,000
-
2014-06-18soldstatus $60,229
-
2014-05-26$55,000
-
1993-10-01soldstatus $75,000
ⓘ Source: listings_history table (triggers on properties + properties_extension) + one-shot
backfill from property_details.listing_events for pre-trigger history.
Tax reassessment forecast NC · Resets to sale price
- Current annual tax
- $1,070 · $89/mo
- Projected year-2 tax
- $1,886 · $157/mo
- Expected delta
- +$816/yr (+$68/mo · 76.3%)
ⓘ Screening estimate from a state-policy table — verify with the county assessor before closing.
Climate risk First Street
- Flood 1/10 Low FEMA zone X (unshaded) · 0% chance over 30 yrs
- Wildfire 5/10 Major
- Heat 9/10 Extreme 7 d/yr ≥106°F today · 18 d/yr by 30 yrs out
- Wind 8/10 Severe 99% chance of damaging wind over 30 yrs
- Air quality 3/10 Moderate 2 unhealthy d/yr today · 5 by 30 yrs out
Nearby sold comps map
Loading sold comps map…
Walkable amenities ~0.75 mi
Loading nearby amenities…
Taxation est. · year 1
- Rental income
- $21,374
- − Mortgage interest
- −$12,884
- − Property taxes
- −$1,070
- − Insurance
- −$1,150
- − Repairs & maintenance
- −$1,710
- − Management
- −$1,710
- − Depreciation
- −$6,691
- Taxable loss
- −$3,840
- Est. tax savings @ 24.0%
- +$922
- After-tax cash flow
- $1,114/yr
For passive investors: Depreciation is non-cash, so a rental often shows a tax loss while cash-flowing — sheltering income. Rental losses are passive: they offset passive income freely, and up to $25,000/yr can offset ordinary (W-2) income if you actively participate and your MAGI is under $100k (phasing out to $0 by $150k); unused losses carry forward. On sale, claimed depreciation is recaptured at up to 25%, and gains may owe capital-gains tax (a 1031 exchange can defer both). Figures are a year-1 estimate at your 24.0% rate — not tax advice; consult a CPA.
Schools (NCES district)
- District
- Onslow County Schools
- NCES district ID
- 3703450
- Math proficiency
- 42% ▲ 6.00%
- Reading proficiency
- 49% ▲ 5.00%
- Median HH income
- $46,076
- Composite
- 38.66/100
- National rank
- #4148
- State rank
- #84 of 178 in NC
Livability — Jacksonville
- Score
- 71/100
- State rank
- #111
- US rank
- #6991
Category grades
Schools grade is shown separately in the Schools card above.
Census & demographics
- County
- Onslow County · 164,453 people
- City population
- 96,397
- Metro
- Jacksonville, NC
- Population (ZIP)
- 49,141
- Household income
- $65,625
- Rent vs Own
- Severe rent burden
- 1304.0
Population outlook (Onslow County) Hauer SSP2
- Today (2025)
- 189,789 people
- By 2030
- 194,463 · +2.5%
- By 2040
- 193,629 · +2.0%
- By 2050
- 193,248 · +1.8%
- By 2075
- 196,995 · +3.8%
- By 2100
- 201,513 · +6.2%
Race, ethnicity, and origin ACS 2023
- Neighborhood character
- Diverse neighborhood (Simpson 0.58)
- Race & ethnicity
- White 62% Black 14% Hispanic / Latino 14% Two or more races 13% Asian 2%
- Hispanic origin (detail)
- Mexican 5% Puerto Rican 6%
- Common ancestry
- Italian 3% Serbian 2% Romanian 2%
- Foreign-born
- 4% · Canada, China
- Languages at home
- 90% English-only · Spanish 7% Chinese 1% Other Asian/Pacific 1%
Political lean MEDSL · Onslow
- 2024 margin
- Solid R (+35.9) · D 31.5% · R 67.5% · Other 1.0%
- 2008→2024 swing
- -14.5pp toward R · 2008: -21.5pp · 2024: -35.9pp
- All cycles
- 2024: R+35.9 2020: R+30.2 2016: R+34.6 2012: R+27.0 2008: R+21.5
Not yet ingested
- Civics
- —
Market trends
- HPI YoY
- ▼ -60.11%
- Current HPI
- 219.5571
- Rent YoY
- ▲ 4.47%
- Metro
- Jacksonville, NC
- State GDP YoY
- ▲ 3.28%
- F500 in state
- 26
Industry mix (Fortune 500 HQ in NC)
| Industry | F500 HQs | Revenue |
|---|---|---|
| Financial Services | 2 | $213B |
|
||
| Retail | 2 | $95B |
|
||
| Industrial Conglomerate | 1 | $38B |
|
||
| Metals / Steel | 1 | $35B |
|
||
| Utilities | 1 | $30B |
|
||
| Industrial Machinery | 1 | $19B |
|
||
Price history
+206.7% since first listed13 events — show timeline
- 2026-03-09 Price Changed $229,999 Hive MLS
- 2026-02-11 Price Changed $242,000 Hive MLS
- 2025-12-14 Listed $265,000 Hive MLS
- 2017-09-06 Sold (Public Records) $155,000 Public Records
- 2017-09-06 Sold (MLS) $155,000 Hive MLS
- 2017-01-16 Listed $154,950 Hive MLS
- 2017-01-14 Listing Removed — Hive MLS
- 2016-10-11 Listed $155,000 Hive MLS
- 2015-05-09 Sold (MLS) $142,500 Hive MLS
- 2014-12-24 Listed $145,000 Hive MLS
- 2014-06-18 Sold (MLS) $60,229 Hive MLS
- 2014-05-26 Listed $55,000 Hive MLS
- 1993-10-01 Sold (Public Records) $75,000 Public Records
Property tax history
-0.1%/yrLatest (2025): $1,070 · -21.6% YoY. Source: county tax records.
Cash-flow waterfall
monthlySold comps — $/sqft
last 12 mo · ≤1 miLoading sold comps…